-
×
 Forex Course with Forever Blue
1 × $6.00
Forex Course with Forever Blue
1 × $6.00 -
×
 Astrology At Work & Others
1 × $6.00
Astrology At Work & Others
1 × $6.00 -
×
 Ultra Blue Forex 2024 with Russ Horn
1 × $17.00
Ultra Blue Forex 2024 with Russ Horn
1 × $17.00 -
×
 Bollinger Bands Trading Strategies That Work
1 × $6.00
Bollinger Bands Trading Strategies That Work
1 × $6.00 -
×
 TTM Directional Day Filter Indicator with Value Chart for TS
1 × $6.00
TTM Directional Day Filter Indicator with Value Chart for TS
1 × $6.00 -
×
 Trading to Win Course: One Day at Time (2004 ed.) with Bruce Gilmore
1 × $6.00
Trading to Win Course: One Day at Time (2004 ed.) with Bruce Gilmore
1 × $6.00 -
×
 Online Forex University Course
1 × $10.00
Online Forex University Course
1 × $10.00 -
×
 Backspreads, Diagonals and Butterflies – Advanced Options Strategies
1 × $6.00
Backspreads, Diagonals and Butterflies – Advanced Options Strategies
1 × $6.00 -
×
 Ultimate Scalping Masterclass 4.0 with RockzFX Academy
1 × $6.00
Ultimate Scalping Masterclass 4.0 with RockzFX Academy
1 × $6.00 -
×
 Triple Play Trading Ideas & Mentoring with MarketGauge
1 × $54.00
Triple Play Trading Ideas & Mentoring with MarketGauge
1 × $54.00 -
×
 Intra-Day Trading Tactics with Greg Capra
1 × $6.00
Intra-Day Trading Tactics with Greg Capra
1 × $6.00 -
×
 Crypto Trading Academy with Cheeky Investor - Aussie Day Trader
1 × $13.00
Crypto Trading Academy with Cheeky Investor - Aussie Day Trader
1 × $13.00 -
×
![Trading The Elliott Wave Indicator (2003) [1 MP4] by Robert Prechter image](https://www.totozon.com/wp-content/uploads/2024/05/Trading-The-Elliott-Wave-Indicator-2003-1-MP4-by-Robert-Prechter-image.png) Trading The Elliott Wave Indicator (2003) [1 MP4] - Robert Prechter
1 × $6.00
Trading The Elliott Wave Indicator (2003) [1 MP4] - Robert Prechter
1 × $6.00 -
×
 BuySide Global Professional (Jul 2018)
1 × $101.00
BuySide Global Professional (Jul 2018)
1 × $101.00 -
×
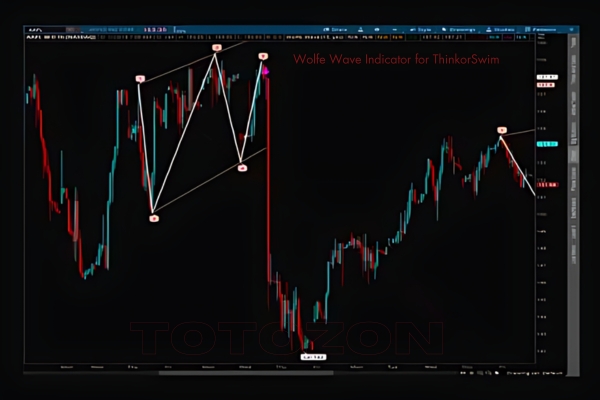 Wolfe Wave Indicator for ThinkorSwim
1 × $6.00
Wolfe Wave Indicator for ThinkorSwim
1 × $6.00 -
×
 TTM Indicators Package for eSignal
1 × $6.00
TTM Indicators Package for eSignal
1 × $6.00 -
×
 Scalp Strategy and Flipping Small Accounts with Opes Trading Group
1 × $5.00
Scalp Strategy and Flipping Small Accounts with Opes Trading Group
1 × $5.00 -
×
 Algo Trading Masterclass with Ali Casey - StatOasis
1 × $23.00
Algo Trading Masterclass with Ali Casey - StatOasis
1 × $23.00 -
×
 Self - Paced Course with Andrew Menaker
1 × $17.00
Self - Paced Course with Andrew Menaker
1 × $17.00 -
×
 Investing in 401k Plans with Cliffsnotes
1 × $6.00
Investing in 401k Plans with Cliffsnotes
1 × $6.00 -
×
 Turning Point. Analysis in Price and Time
1 × $6.00
Turning Point. Analysis in Price and Time
1 × $6.00 -
×
 Beginner's Forex Course with Jossenia Pomare
1 × $60.00
Beginner's Forex Course with Jossenia Pomare
1 × $60.00 -
×
 ApexFX Pro
1 × $5.00
ApexFX Pro
1 × $5.00 -
×
 Commodity Spreads: Techniques and Methods for Spreading Financial Futures, Grains, Meats & Other Commodities with Courtney Smith
1 × $6.00
Commodity Spreads: Techniques and Methods for Spreading Financial Futures, Grains, Meats & Other Commodities with Courtney Smith
1 × $6.00 -
×
 Advanced Spread Trading with Guy Bower - MasterClass Trader
1 × $15.00
Advanced Spread Trading with Guy Bower - MasterClass Trader
1 × $15.00 -
×
 Tradeonix Trading System
1 × $31.00
Tradeonix Trading System
1 × $31.00 -
×
 The Stock Market Mastery Program with Ryan Hildreth
1 × $12.00
The Stock Market Mastery Program with Ryan Hildreth
1 × $12.00 -
×
 The Forex Trading Coach Course
1 × $6.00
The Forex Trading Coach Course
1 × $6.00 -
×
 Investing Courses Bundle
1 × $31.00
Investing Courses Bundle
1 × $31.00 -
×
 Speculator King 1967 with Jesse Livermore
1 × $6.00
Speculator King 1967 with Jesse Livermore
1 × $6.00 -
×
 The Indices Orderflow Masterclass with The Forex Scalpers
1 × $23.00
The Indices Orderflow Masterclass with The Forex Scalpers
1 × $23.00 -
×
 The Complete Guide to Multiple Time Frame Analysis & Reading Price Action with Aiman Almansoori
1 × $13.00
The Complete Guide to Multiple Time Frame Analysis & Reading Price Action with Aiman Almansoori
1 × $13.00 -
×
 Zedd Monopoly Platinum
1 × $5.00
Zedd Monopoly Platinum
1 × $5.00 -
×
 The Essentials of Trading Course & Book with John Forman
1 × $6.00
The Essentials of Trading Course & Book with John Forman
1 × $6.00 -
×
 Intra-Day Trading with Market Internals I with Greg Capra
1 × $6.00
Intra-Day Trading with Market Internals I with Greg Capra
1 × $6.00 -
×
 TTM Bricks, Trend & BB Squeeze for TS
1 × $6.00
TTM Bricks, Trend & BB Squeeze for TS
1 × $6.00 -
×
 TTM Squeeze Clone for eSignal
1 × $6.00
TTM Squeeze Clone for eSignal
1 × $6.00 -
×
 The Bollinger Bands Swing Trading System 2004 with Larry Connors
1 × $6.00
The Bollinger Bands Swing Trading System 2004 with Larry Connors
1 × $6.00 -
×
 Options Trading Business with The Daytrading Room
1 × $23.00
Options Trading Business with The Daytrading Room
1 × $23.00 -
×
 Japenese Candlesticks Charting, Analysis & Trading with Irwin Porter
1 × $6.00
Japenese Candlesticks Charting, Analysis & Trading with Irwin Porter
1 × $6.00 -
×
 Options Trading & Ultimate MasterClass With Tyrone Abela - FX Evolution
1 × $54.00
Options Trading & Ultimate MasterClass With Tyrone Abela - FX Evolution
1 × $54.00 -
×
 The Orderflows Trade Opportunities Encyclopedia with Michael Valtos
1 × $8.00
The Orderflows Trade Opportunities Encyclopedia with Michael Valtos
1 × $8.00 -
×
 TRADING NFX Course with Andrew NFX
1 × $5.00
TRADING NFX Course with Andrew NFX
1 × $5.00 -
×
 How To Design, Test, Evaluate and Implement Profitable Trading Systems(Manual Only)
1 × $4.00
How To Design, Test, Evaluate and Implement Profitable Trading Systems(Manual Only)
1 × $4.00 -
×
 One Week S&P Workshop II with Linda Raschke
1 × $5.00
One Week S&P Workshop II with Linda Raschke
1 × $5.00 -
×
 Bitcoin - Trading – Watch me manage my own account
1 × $8.00
Bitcoin - Trading – Watch me manage my own account
1 × $8.00 -
×
 W. D Gann 's Square Of 9 Applied To Modern Markets with Sean Avidar - Hexatrade350
1 × $23.00
W. D Gann 's Square Of 9 Applied To Modern Markets with Sean Avidar - Hexatrade350
1 × $23.00 -
×
 The Secret Code of Japanese Candlesticks with Felipe Tudela
1 × $5.00
The Secret Code of Japanese Candlesticks with Felipe Tudela
1 × $5.00 -
×
 The In-N-Out Butterfly
1 × $6.00
The In-N-Out Butterfly
1 × $6.00 -
×
 Trading Indicators for the 21th Century
1 × $15.00
Trading Indicators for the 21th Century
1 × $15.00 -
×
 Intermarket Technical Analysis with John J.Murphy
1 × $6.00
Intermarket Technical Analysis with John J.Murphy
1 × $6.00 -
×
 Level 1 - Japanese Candlesticks Trading Mastery Program with Rohit Musale & Rashmi Musale
1 × $5.00
Level 1 - Japanese Candlesticks Trading Mastery Program with Rohit Musale & Rashmi Musale
1 × $5.00 -
×
 Trading with Fibonacci and Market Structure - Price Action Volume Trader
1 × $23.00
Trading with Fibonacci and Market Structure - Price Action Volume Trader
1 × $23.00 -
×
 The Spiral Calendar and Its Effect on Financial Markets and Human Events with Christopher Carolan
1 × $6.00
The Spiral Calendar and Its Effect on Financial Markets and Human Events with Christopher Carolan
1 × $6.00 -
×
 The Sleuth Investor with Avner Mandelman
1 × $6.00
The Sleuth Investor with Avner Mandelman
1 × $6.00 -
×
 The Sellers Code Master Class with Flip2Freedom
1 × $31.00
The Sellers Code Master Class with Flip2Freedom
1 × $31.00 -
×
 The Best Option Trading Course with David Jaffee - Best Stock Strategy
1 × $15.00
The Best Option Trading Course with David Jaffee - Best Stock Strategy
1 × $15.00 -
×
 Ultimate Options Blue Print Course
1 × $23.00
Ultimate Options Blue Print Course
1 × $23.00 -
×
 SQX Mentorship with Tip Toe Hippo
1 × $23.00
SQX Mentorship with Tip Toe Hippo
1 × $23.00 -
×
 High Probability Continuation and Reversal Patterns
1 × $23.00
High Probability Continuation and Reversal Patterns
1 × $23.00 -
×
 Astro FX 2.0
1 × $6.00
Astro FX 2.0
1 × $6.00 -
×
 The Secret To Making 7 Figures In A Year with Steven Dux
1 × $31.00
The Secret To Making 7 Figures In A Year with Steven Dux
1 × $31.00 -
×
 Trading Patterns for Producing Huge Profits with Barry Burns
1 × $4.00
Trading Patterns for Producing Huge Profits with Barry Burns
1 × $4.00 -
×
 The Fortune Strategy. An Instruction Manual
1 × $6.00
The Fortune Strategy. An Instruction Manual
1 × $6.00 -
×
 Essentials in Quantitative Trading QT01 By HangukQuant's
1 × $23.00
Essentials in Quantitative Trading QT01 By HangukQuant's
1 × $23.00

Point And Figure Part III By Bruce Fraser & Roman Bogomazov – Wyckoff Analytics
Original price was: $299.00.$23.00Current price is: $23.00.
File Size: 876.3 MB
Delivery Time: 1–12 hours
Media Type: Online Course
Content Proof: Watch Here!
You may check content proof of “Point And Figure Part III By Bruce Fraser & Roman Bogomazov – Wyckoff Analytics” below:

Point And Figure Part III By Bruce Fraser & Roman Bogomazov – Wyckoff Analytics
Introduction to Point and Figure Charting
Point and Figure (P&F) charting is a timeless method used by traders to analyze and forecast price movements in financial markets. Unlike traditional charts, P&F charts focus solely on price changes, filtering out the noise of time. In Point And Figure Part III, Bruce Fraser and Roman Bogomazov delve deeper into this fascinating technique, providing advanced insights and practical applications for traders.
What is Point and Figure Charting?
Basic Concepts
Point and Figure charting eliminates the time element and focuses on price movements. This method uses ‘X’ to represent rising prices and ‘O’ to denote falling prices.
Historical Background
The origins of P&F charting date back to the late 19th century, and it has been used by traders ever since to identify key levels of support and resistance, as well as potential breakout points.
Advanced Techniques in P&F Charting
Reversal Criteria
In Point And Figure Part III, Fraser and Bogomazov explore various reversal criteria. The standard practice involves using a three-box reversal, but traders can adjust this based on their risk tolerance and market conditions.
Box Size
The box size is a critical component of P&F charts. It determines the price movement needed to draw a new ‘X’ or ‘O’. Fraser and Bogomazov discuss methods for selecting appropriate box sizes for different markets.
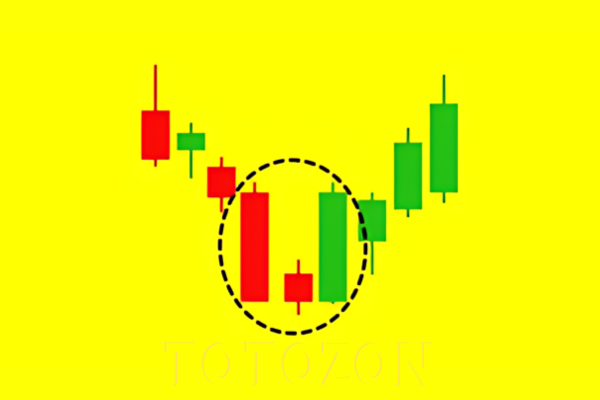
Chart Patterns
- Double Top/Bottom: Indicates potential reversals.
- Triple Top/Bottom: Suggests stronger confirmation of trend reversals.
- Ascending/Descending Triple Tops: Indicates strong continuation signals.
Practical Applications of P&F Charting
Identifying Trends
P&F charts excel at identifying long-term trends. By filtering out minor price fluctuations, they provide a clearer picture of the underlying trend.
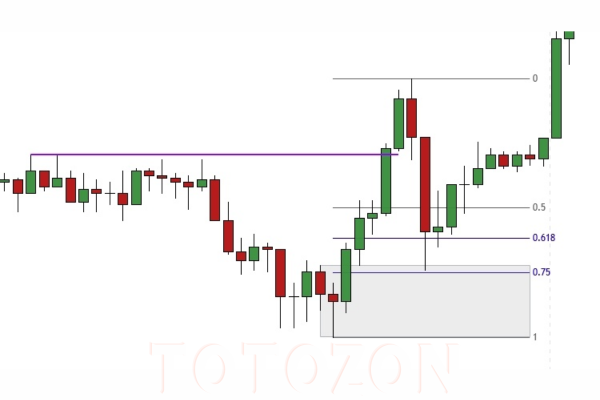
Support and Resistance
The clarity of P&F charts makes it easier to spot key support and resistance levels. This can help traders set stop-loss levels and identify potential entry and exit points.
Breakouts
Fraser and Bogomazov emphasize the importance of breakouts in P&F charting. A breakout occurs when the price moves beyond a predefined level, indicating a potential new trend.
Incorporating Wyckoff Method with P&F
Wyckoff Phases
Combining P&F charting with the Wyckoff Method enhances a trader’s ability to understand market phases such as accumulation, distribution, and markup/markdown.
P&F and Wyckoff Analysis
Fraser and Bogomazov show how to integrate P&F charts with Wyckoff’s principles to improve market timing and trade selection.
Case Studies
Successful Trades
The authors provide several case studies where P&F charting was used to make successful trades. These real-world examples illustrate the effectiveness of combining P&F with other analytical methods.
Lessons Learned
Each case study includes a detailed analysis of what worked and what didn’t, offering valuable lessons for traders looking to refine their strategies.
Tools and Resources for P&F Charting
Software Platforms
Various trading platforms support P&F charting. Fraser and Bogomazov recommend using tools that allow for customization of box size and reversal criteria.
Educational Resources
Wyckoff Analytics offers a wealth of educational resources, including webinars, articles, and tutorials to help traders master P&F charting.
Common Challenges and Solutions
False Signals
One common challenge with P&F charting is dealing with false signals. Fraser and Bogomazov suggest combining P&F with other indicators to confirm signals and reduce false positives.
Charting Software Limitations
Some charting software may not offer advanced P&F customization. It’s important to choose platforms that provide the necessary flexibility and tools.
Future Trends in P&F Charting
Integration with AI
The future of P&F charting may involve integration with AI to automate pattern recognition and enhance predictive accuracy.
Increased Popularity
As more traders seek robust, time-tested methods, the popularity of P&F charting is likely to grow, supported by ongoing advancements and educational efforts.
Conclusion
Point And Figure Part III by Bruce Fraser and Roman Bogomazov offers a comprehensive guide to advanced P&F charting techniques. By incorporating these methods into their trading toolkit, traders can gain a clearer, more accurate view of market trends and make more informed trading decisions. Whether you are a novice or an experienced trader, the insights provided in this series are invaluable for mastering the art of P&F charting.
Frequently Asked Questions
1. What is Point and Figure charting?
Point and Figure charting is a method that focuses on price movements, using ‘X’ and ‘O’ to represent rising and falling prices, respectively.
2. How does P&F charting differ from traditional charts?
Unlike traditional charts, P&F charts ignore time and only focus on significant price movements, filtering out minor fluctuations.
3. What are some key patterns in P&F charting?
Key patterns include double tops/bottoms, triple tops/bottoms, and ascending/descending triple tops.
4. How can I integrate Wyckoff Method with P&F charting?
Combining P&F with Wyckoff’s principles helps in understanding market phases and improving trade timing.
5. What tools are recommended for P&F charting?
Choose trading platforms that offer customization of box size and reversal criteria, and utilize educational resources like those provided by Wyckoff Analytics.
Be the first to review “Point And Figure Part III By Bruce Fraser & Roman Bogomazov – Wyckoff Analytics”
You must be logged in to post a review.
Related products

Forex Trading
Original price was: $4,997.00.$27.00Current price is: $27.00.

Forex Trading
Quantamentals – The Next Great Forefront Of Trading and Investing with Trading Markets
Original price was: $1,495.00.$8.00Current price is: $8.00.
Forex Trading
Original price was: $850.00.$23.00Current price is: $23.00.

Forex Trading
Original price was: $550.00.$5.00Current price is: $5.00.

Original price was: $497.00.$31.00Current price is: $31.00.
Original price was: $999.00.$5.00Current price is: $5.00.
Forex Trading
The Complete Guide to Multiple Time Frame Analysis & Reading Price Action with Aiman Almansoori
Original price was: $1,399.00.$13.00Current price is: $13.00.

Original price was: $649.00.$20.00Current price is: $20.00.

Original price was: $2,120.00.$15.00Current price is: $15.00.
Original price was: $450.00.$23.00Current price is: $23.00.

Original price was: $1,200.00.$23.00Current price is: $23.00.

Original price was: $799.00.$15.00Current price is: $15.00.
Original price was: $1,800.00.$54.00Current price is: $54.00.

Forex Trading
Original price was: $799.00.$15.00Current price is: $15.00.

Forex Trading
Original price was: $397.00.$31.00Current price is: $31.00.

Forex Trading
Original price was: $239.00.$8.00Current price is: $8.00.

Forex Trading
Original price was: $797.00.$10.00Current price is: $10.00.

Original price was: $695.00.$41.00Current price is: $41.00.

Forex Trading
Original price was: $249.00.$15.00Current price is: $15.00.

Forex Trading
Original price was: $125.00.$17.00Current price is: $17.00.

Reviews
There are no reviews yet.