-
×
 The Streetsmart Guide to Timing the Stock Market with Colin Alexander
1 × $6.00
The Streetsmart Guide to Timing the Stock Market with Colin Alexander
1 × $6.00 -
×
 Advanced Iron Condor Course in 2021
1 × $6.00
Advanced Iron Condor Course in 2021
1 × $6.00 -
×
 Commodity Speculation for Beginners with Charles Huff, Barbara Marinacci
1 × $6.00
Commodity Speculation for Beginners with Charles Huff, Barbara Marinacci
1 × $6.00 -
×
 ABCs of Trading and Tech Analysis (Online Investor Expo, Las Vegas 2000) with Tom Bierovic
1 × $6.00
ABCs of Trading and Tech Analysis (Online Investor Expo, Las Vegas 2000) with Tom Bierovic
1 × $6.00 -
×
 Candlestick and Pivot Point Trading Triggers with John Person
1 × $6.00
Candlestick and Pivot Point Trading Triggers with John Person
1 × $6.00 -
×
 WYCKOFF TRADING COURSE (WTC) PART I – ANALYSIS (Fall 2021) with Roman Bogomazov
1 × $209.00
WYCKOFF TRADING COURSE (WTC) PART I – ANALYSIS (Fall 2021) with Roman Bogomazov
1 × $209.00 -
×
 AstroFX Course
1 × $6.00
AstroFX Course
1 × $6.00 -
×
 Advanced Breakthroughs in Day Trading DVD course with George Angell
1 × $6.00
Advanced Breakthroughs in Day Trading DVD course with George Angell
1 × $6.00 -
×
 Qualitative - Financial Statement Analysis with Sandesh Banger
1 × $5.00
Qualitative - Financial Statement Analysis with Sandesh Banger
1 × $5.00 -
×
 Ultimate Trading Course with Dodgy's Dungeon
1 × $8.00
Ultimate Trading Course with Dodgy's Dungeon
1 × $8.00 -
×
 A Seminar On Ocean Theory Home Study Trading Course with Pat Raffalovich
1 × $6.00
A Seminar On Ocean Theory Home Study Trading Course with Pat Raffalovich
1 × $6.00 -
×
 ICT Charter Complete Course (2019)
1 × $13.00
ICT Charter Complete Course (2019)
1 × $13.00 -
×
 The Handbook of Alternative Investments with Darrell R.Jobman
1 × $6.00
The Handbook of Alternative Investments with Darrell R.Jobman
1 × $6.00 -
×
 Equities with Peter Martin
1 × $6.00
Equities with Peter Martin
1 × $6.00 -
×
 The Market Maker’s Edge with Josh Lukeman
1 × $6.00
The Market Maker’s Edge with Josh Lukeman
1 × $6.00 -
×
 Options Trading. The Hidden Reality Course with Charles Cottle
1 × $6.00
Options Trading. The Hidden Reality Course with Charles Cottle
1 × $6.00 -
×
 The Trading Blueprint with Brad Goh - The Trading Geek
1 × $5.00
The Trading Blueprint with Brad Goh - The Trading Geek
1 × $5.00 -
×
 The Complete Guide to Multiple Time Frame Analysis & Reading Price Action with Aiman Almansoori
1 × $13.00
The Complete Guide to Multiple Time Frame Analysis & Reading Price Action with Aiman Almansoori
1 × $13.00 -
×
 High Probability Trading Using Elliott Wave And Fibonacci Analysis withVic Patel - Forex Training Group
1 × $10.00
High Probability Trading Using Elliott Wave And Fibonacci Analysis withVic Patel - Forex Training Group
1 × $10.00 -
×
 The Psychology Of Trading with Brett N.Steenbarger
1 × $6.00
The Psychology Of Trading with Brett N.Steenbarger
1 × $6.00 -
×
 6 Live Sentiment Analysis Trading Bots using Python with The A.I. Whisperer
1 × $5.00
6 Live Sentiment Analysis Trading Bots using Python with The A.I. Whisperer
1 × $5.00 -
×
 E-mini Weekly Options Income with Peter Titus
1 × $15.00
E-mini Weekly Options Income with Peter Titus
1 × $15.00 -
×
 Reality Based Trading with Matt Petrallia - Trading Equilibrium
1 × $17.00
Reality Based Trading with Matt Petrallia - Trading Equilibrium
1 × $17.00 -
×
 ALGO™ Online Retail - Version 2.9
1 × $155.00
ALGO™ Online Retail - Version 2.9
1 × $155.00 -
×
 Activedaytrader - 3 Important Ways to Manage Your Options Position
1 × $15.00
Activedaytrader - 3 Important Ways to Manage Your Options Position
1 × $15.00 -
×
 Buying and Selling Volatility with Kevin B.Connolly
1 × $6.00
Buying and Selling Volatility with Kevin B.Connolly
1 × $6.00 -
×
 Asset Allocation for the Individual Investor with CFA Institute
1 × $6.00
Asset Allocation for the Individual Investor with CFA Institute
1 × $6.00 -
×
 A Non-Random Walk Down Wall Street with Andrew W.Lo
1 × $6.00
A Non-Random Walk Down Wall Street with Andrew W.Lo
1 × $6.00 -
×
 Profitable DayTrading with Precision - George Angell
1 × $6.00
Profitable DayTrading with Precision - George Angell
1 × $6.00 -
×
 The Vital Few vs. the Trivial Many: Invest with the Insiders, Not the Masses with George Muzea
1 × $6.00
The Vital Few vs. the Trivial Many: Invest with the Insiders, Not the Masses with George Muzea
1 × $6.00 -
×
 A Convicted Stock Manipulators Guide to Investing with Marino Specogna
1 × $6.00
A Convicted Stock Manipulators Guide to Investing with Marino Specogna
1 × $6.00 -
×
 Master Trader Technical Strategies with Greg Capra - Master Trader
1 × $5.00
Master Trader Technical Strategies with Greg Capra - Master Trader
1 × $5.00 -
×
 We Fund Traders - The Whale Order
1 × $5.00
We Fund Traders - The Whale Order
1 × $5.00 -
×
 Sample Item Sets 2003 - CFA Level 3
1 × $6.00
Sample Item Sets 2003 - CFA Level 3
1 × $6.00 -
×
 Scalp Trading Mini Course with Jayson Casper
1 × $23.00
Scalp Trading Mini Course with Jayson Casper
1 × $23.00 -
×
 Commodity Options: Trading and Hedging Volatility in the World’s Most Lucrative Market with Carley Garner & Paul Brittain
1 × $6.00
Commodity Options: Trading and Hedging Volatility in the World’s Most Lucrative Market with Carley Garner & Paul Brittain
1 × $6.00 -
×
 The TC2000 Masterclass Course with Sasha Evdakov - Rise2learn
1 × $23.00
The TC2000 Masterclass Course with Sasha Evdakov - Rise2learn
1 × $23.00 -
×
 The Illustrated Guide to Technical Analysis Signals and Phrases with Constance Brown
1 × $6.00
The Illustrated Guide to Technical Analysis Signals and Phrases with Constance Brown
1 × $6.00 -
×
 Measuring Risk in Complex Stochastic Systems with J.Franke, W. Hardle, G. Stahl
1 × $6.00
Measuring Risk in Complex Stochastic Systems with J.Franke, W. Hardle, G. Stahl
1 × $6.00 -
×
 7 Steps to Success Trading Options Online with Larry Spears
1 × $4.00
7 Steps to Success Trading Options Online with Larry Spears
1 × $4.00 -
×
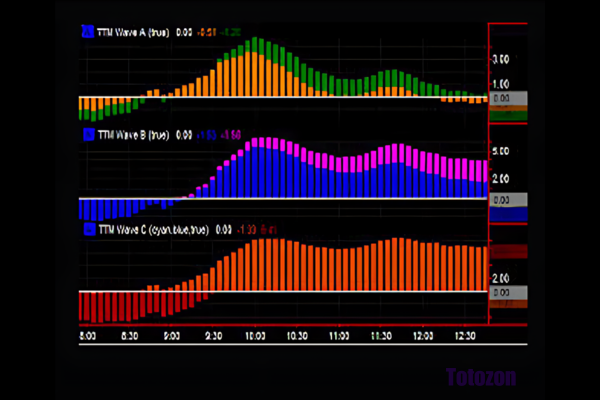 ABC Waves TOS Indicator & Live Class with Simpler Options
1 × $6.00
ABC Waves TOS Indicator & Live Class with Simpler Options
1 × $6.00 -
×
 Master Trader with InvestingSimple
1 × $15.00
Master Trader with InvestingSimple
1 × $15.00 -
×
 WYCKOFF TRADING COURSE (WTC) PART I – ANALYSIS (Spring 2023) - Roman Bogomazov & Alessio Rutigliano
1 × $209.00
WYCKOFF TRADING COURSE (WTC) PART I – ANALYSIS (Spring 2023) - Roman Bogomazov & Alessio Rutigliano
1 × $209.00 -
×
 Advanced Management Strategies - Home Study with Pristine Capital
1 × $27.00
Advanced Management Strategies - Home Study with Pristine Capital
1 × $27.00 -
×
 Andy’s EMini Bar – 60 Min System
1 × $6.00
Andy’s EMini Bar – 60 Min System
1 × $6.00 -
×
 Forecast 2024 Clarification with Larry Williams
1 × $15.00
Forecast 2024 Clarification with Larry Williams
1 × $15.00 -
×
 Sacredscience - Sepharial Arcana – Rubber
1 × $6.00
Sacredscience - Sepharial Arcana – Rubber
1 × $6.00 -
×
 Trading Ist Ein Geschaft (German) (tradingeducators.com)
1 × $6.00
Trading Ist Ein Geschaft (German) (tradingeducators.com)
1 × $6.00 -
×
 Tradezilla 2.0
1 × $5.00
Tradezilla 2.0
1 × $5.00 -
×
 W. D Gann 's Square Of 9 Applied To Modern Markets with Sean Avidar - Hexatrade350
1 × $23.00
W. D Gann 's Square Of 9 Applied To Modern Markets with Sean Avidar - Hexatrade350
1 × $23.00 -
×
 Wyckoff Analytics Courses Collection
1 × $27.00
Wyckoff Analytics Courses Collection
1 × $27.00 -
×
 The Best Option Trading Course with David Jaffee - Best Stock Strategy
1 × $15.00
The Best Option Trading Course with David Jaffee - Best Stock Strategy
1 × $15.00

Beginners Chart Patterns Trading for Penny Stocks
Original price was: $49.00.$6.00Current price is: $6.00.
File Size: Coming soon!
Delivery Time: 1–12 hours
Media Type: Online Course
Beginners Chart Patterns Trading for Penny Stocks
Introduction
Trading penny stocks can be both exciting and profitable, but it requires a good understanding of chart patterns. Chart patterns provide visual representations of price movements, helping traders make informed decisions. This article explores essential chart patterns for beginners trading penny stocks, offering practical insights and tips to enhance your trading strategy.
What are Penny Stocks?
Definition
Penny stocks are typically low-priced stocks of small companies. They trade for less than $5 per share and are often found on over-the-counter (OTC) markets.
Why Trade Penny Stocks?
Penny stocks offer high volatility, which can lead to significant profits if traded correctly. However, they also come with higher risk, making it crucial to understand chart patterns.
Understanding Chart Patterns
1. What are Chart Patterns?
Chart patterns are formations created by the price movements of a stock over time. They help traders predict future price movements based on historical data.
2. Importance of Chart Patterns
Recognizing chart patterns allows traders to identify potential buy and sell signals, improving their chances of making profitable trades.
Common Chart Patterns for Penny Stocks
1. Head and Shoulders
Bullish Head and Shoulders
This pattern indicates a potential reversal in a downtrend. It consists of three peaks, with the middle peak (head) being the highest.
Bearish Head and Shoulders
A bearish version signals a reversal in an uptrend. The pattern forms three peaks, with the middle peak being the lowest.
2. Double Tops and Bottoms
Double Top
A double top pattern indicates a bearish reversal, forming two consecutive peaks at roughly the same price level.
Double Bottom
This pattern signals a bullish reversal, forming two consecutive troughs at approximately the same price level.
3. Triangles
Ascending Triangle
An ascending triangle is a bullish pattern that forms a horizontal resistance line and an upward-sloping support line.
Descending Triangle
A descending triangle is a bearish pattern that forms a horizontal support line and a downward-sloping resistance line.
Symmetrical Triangle
This pattern can signal either a bullish or bearish breakout, forming converging trend lines that resemble a triangle.
4. Flags and Pennants
Bullish Flag
A bullish flag forms after a strong upward move, indicating a continuation of the trend. It appears as a small rectangle that slopes downwards.
Bearish Flag
A bearish flag forms after a significant downward move, signaling a continuation of the trend. It appears as a small rectangle that slopes upwards.
Bullish Pennant
A bullish pennant forms after a strong upward move, resembling a small symmetrical triangle. It indicates a continuation of the bullish trend.
Bearish Pennant
A bearish pennant forms after a significant downward move, resembling a small symmetrical triangle. It signals a continuation of the bearish trend.
How to Trade Chart Patterns
1. Identifying the Pattern
Carefully analyze the stock chart to identify recognizable patterns. Look for clear formations and confirm with volume analysis.
2. Confirming the Pattern
Ensure the pattern is valid by confirming it with other technical indicators, such as moving averages or RSI.
3. Entering the Trade
Based on the identified pattern, determine your entry point. For example, in a bullish flag pattern, enter the trade as the price breaks above the upper trend line.
4. Setting Stop-Loss Orders
To manage risk, place stop-loss orders just below the support level in a bullish pattern or above the resistance level in a bearish pattern.
5. Taking Profits
Determine your profit targets based on the height of the pattern. For instance, in a double bottom pattern, the target could be the height between the bottoms and the neckline added to the breakout point.
Tips for Success in Penny Stock Trading
1. Start Small
Begin with a small investment to minimize risk while you learn and gain experience.
2. Stay Informed
Keep up with market news and trends that could impact the price movements of penny stocks.
3. Practice Patience
Avoid the temptation to make impulsive trades. Wait for clear patterns and signals before entering a trade.
4. Use a Trading Journal
Maintain a trading journal to record your trades, strategies, and outcomes. This helps you learn from your successes and mistakes.
5. Continuous Learning
Invest in your education by attending webinars, reading books, and following experienced traders. Continuous learning is key to long-term success.
Conclusion
Trading penny stocks using chart patterns can be a profitable strategy if done correctly. By understanding and identifying key patterns like head and shoulders, double tops and bottoms, and various triangle formations, you can make informed trading decisions. Remember to start small, stay informed, and practice patience. With time and experience, you can develop a winning strategy for trading penny stocks.
Frequently Asked Questions:
- Business Model Innovation:
Embrace our legitimate business model! We organize group buys, allowing participants to share costs for popular courses, making them accessible to those with limited financial resources. Our approach ensures affordability and accessibility, despite author concerns.
2. The Legal Environment:
The legality of our activity is uncertain. While we lack specific permission from course authors, there’s a technicality: authors didn’t impose resale limits upon course purchase. This presents both an opportunity for us and a benefit for individuals seeking low-cost access.
3. Quality Control:
Unveiling the Truth
Quality is paramount. Purchasing courses directly from sales pages ensures consistency with traditionally obtained materials. However, we’re not official course providers and don’t offer premium services:
- No scheduled coaching calls or sessions with the author.
- No access to the author’s private Facebook group or web portal.
- No entry to the author’s private membership forum.
- Direct email support from the author or their team is unavailable. Operating independently, we aim to bridge the pricing gap without additional services provided by official channels. Your understanding of our unique approach is valued
Be the first to review “Beginners Chart Patterns Trading for Penny Stocks”
You must be logged in to post a review.
Related products

Original price was: $997.00.$13.00Current price is: $13.00.
Forex Trading
Original price was: $797.00.$10.00Current price is: $10.00.

Forex Trading
Original price was: $550.00.$5.00Current price is: $5.00.

Original price was: $999.00.$5.00Current price is: $5.00.

Original price was: $497.00.$31.00Current price is: $31.00.

Forex Trading
Original price was: $4,997.00.$27.00Current price is: $27.00.

Original price was: $4,995.00.$15.00Current price is: $15.00.

Forex Trading
Quantamentals – The Next Great Forefront Of Trading and Investing with Trading Markets
Original price was: $1,495.00.$8.00Current price is: $8.00.

Forex Trading
Original price was: $1,098.00.$39.00Current price is: $39.00.

Forex Trading
Original price was: $397.00.$31.00Current price is: $31.00.

Forex Trading
Original price was: $2,997.00.$23.00Current price is: $23.00.

Original price was: $695.00.$41.00Current price is: $41.00.
Forex Trading
Original price was: $1,898.00.$10.00Current price is: $10.00.

Original price was: $2,120.00.$15.00Current price is: $15.00.

Forex Trading
Original price was: $125.00.$17.00Current price is: $17.00.

Original price was: $450.00.$23.00Current price is: $23.00.

Original price was: $649.00.$20.00Current price is: $20.00.
Original price was: $1,849.00.$15.00Current price is: $15.00.
Forex Trading
Original price was: $697.00.$5.00Current price is: $5.00.

Original price was: $197.00.$5.00Current price is: $5.00.
Reviews
There are no reviews yet.