-
×
 Candlestick - Training Videos (Videos 1.2 GB)
1 × $15.00
Candlestick - Training Videos (Videos 1.2 GB)
1 × $15.00 -
×
 Trading With Venus
1 × $31.00
Trading With Venus
1 × $31.00 -
×
 WYCKOFF TRADING COURSE (WTC) PART I – ANALYSIS (Fall 2021) with Roman Bogomazov
1 × $209.00
WYCKOFF TRADING COURSE (WTC) PART I – ANALYSIS (Fall 2021) with Roman Bogomazov
1 × $209.00 -
×
 3 Day Live Trading Webinar (Jan 2010)
1 × $6.00
3 Day Live Trading Webinar (Jan 2010)
1 × $6.00 -
×
 Signature Trade from Forexia with Dylan Forexia
1 × $85.00
Signature Trade from Forexia with Dylan Forexia
1 × $85.00 -
×
 Dynamite TNT Forex System with Clarence Chee
1 × $6.00
Dynamite TNT Forex System with Clarence Chee
1 × $6.00 -
×
 Concerning The More Certain Fundamentals Of Astrology
1 × $6.00
Concerning The More Certain Fundamentals Of Astrology
1 × $6.00 -
×
 FX Cartel Online Course
1 × $31.00
FX Cartel Online Course
1 × $31.00 -
×
 Chart Your Way to Profits (2nd Ed.) with Tim Knight
1 × $6.00
Chart Your Way to Profits (2nd Ed.) with Tim Knight
1 × $6.00 -
×
 Advanced Price Action Course with ZenFX
1 × $5.00
Advanced Price Action Course with ZenFX
1 × $5.00 -
×
 CFA Level 3 - Examination Morning Session – Essay (2002)
1 × $6.00
CFA Level 3 - Examination Morning Session – Essay (2002)
1 × $6.00 -
×
 The MMXM Traders Course - The MMXM Trader
1 × $5.00
The MMXM Traders Course - The MMXM Trader
1 × $5.00 -
×
 Day Trading Academy
1 × $54.00
Day Trading Academy
1 × $54.00 -
×
 Deep Dive Butterfly Trading Strategy Class with SJG Trades
1 × $41.00
Deep Dive Butterfly Trading Strategy Class with SJG Trades
1 × $41.00 -
×
 The Hidden Order Within Stock Prices with Clay Allen
1 × $6.00
The Hidden Order Within Stock Prices with Clay Allen
1 × $6.00 -
×
 Complete Guide to Online Stock Market Investing (2nd Edition) with Alexander Davidson
1 × $6.00
Complete Guide to Online Stock Market Investing (2nd Edition) with Alexander Davidson
1 × $6.00 -
×
 All in One Forex Course with VintagEducation
1 × $31.00
All in One Forex Course with VintagEducation
1 × $31.00 -
×
 FX GOAT 3.0 (ALL IN ONE) with FX GOAT FOREX TRADING ACADEMY
1 × $5.00
FX GOAT 3.0 (ALL IN ONE) with FX GOAT FOREX TRADING ACADEMY
1 × $5.00 -
×
 Trading Full Circle with Jea Yu
1 × $6.00
Trading Full Circle with Jea Yu
1 × $6.00 -
×
 The Trading Blueprint with Brad Goh - The Trading Geek
1 × $5.00
The Trading Blueprint with Brad Goh - The Trading Geek
1 × $5.00 -
×
 The STRAT Execution Basics with Jermaine McGruder
1 × $31.00
The STRAT Execution Basics with Jermaine McGruder
1 × $31.00 -
×
 Acme
1 × $6.00
Acme
1 × $6.00 -
×
 Quantamentals - The Next Great Forefront Of Trading and Investing with Trading Markets
1 × $8.00
Quantamentals - The Next Great Forefront Of Trading and Investing with Trading Markets
1 × $8.00 -
×
 AM Trader - Strategy Training Course
1 × $23.00
AM Trader - Strategy Training Course
1 × $23.00 -
×
 Commodity Spreads: Techniques and Methods for Spreading Financial Futures, Grains, Meats & Other Commodities with Courtney Smith
1 × $6.00
Commodity Spreads: Techniques and Methods for Spreading Financial Futures, Grains, Meats & Other Commodities with Courtney Smith
1 × $6.00 -
×
 Advanced Gap Trading Strategies with Master Trader
1 × $31.00
Advanced Gap Trading Strategies with Master Trader
1 × $31.00 -
×
 The Management of Equity Investments with Dimitris Chorafas
1 × $6.00
The Management of Equity Investments with Dimitris Chorafas
1 × $6.00 -
×
 The Orderflow Masterclass with PrimeTrading
1 × $17.00
The Orderflow Masterclass with PrimeTrading
1 × $17.00 -
×
 A Forex System For Catching Pips All Day Long with Forex Pip Fishing
1 × $4.00
A Forex System For Catching Pips All Day Long with Forex Pip Fishing
1 × $4.00 -
×
 9-Pack of TOS Indicators
1 × $6.00
9-Pack of TOS Indicators
1 × $6.00 -
×
 Bear Trap Indicator with Markay Latimer
1 × $5.00
Bear Trap Indicator with Markay Latimer
1 × $5.00 -
×
 Build a Professional Trading System using Amibroker with Trading Tuitions - Marwood Research
1 × $23.00
Build a Professional Trading System using Amibroker with Trading Tuitions - Marwood Research
1 × $23.00 -
×
 Hedged Strategy Series in Volatile Markets All 4 with Dan Sheridan
1 × $15.00
Hedged Strategy Series in Volatile Markets All 4 with Dan Sheridan
1 × $15.00 -
×
 A Day Trading Guide
1 × $54.00
A Day Trading Guide
1 × $54.00 -
×
 Big Boy Volume Spread Analysis + Advanced Price Action Mastery Course with Kai Sheng Chew
1 × $15.00
Big Boy Volume Spread Analysis + Advanced Price Action Mastery Course with Kai Sheng Chew
1 × $15.00 -
×
 All About Stocks (3rd Ed.) withEsme E.Faerber
1 × $6.00
All About Stocks (3rd Ed.) withEsme E.Faerber
1 × $6.00 -
×
 The Orderflows Trade Opportunities Encyclopedia with Michael Valtos
1 × $8.00
The Orderflows Trade Opportunities Encyclopedia with Michael Valtos
1 × $8.00 -
×
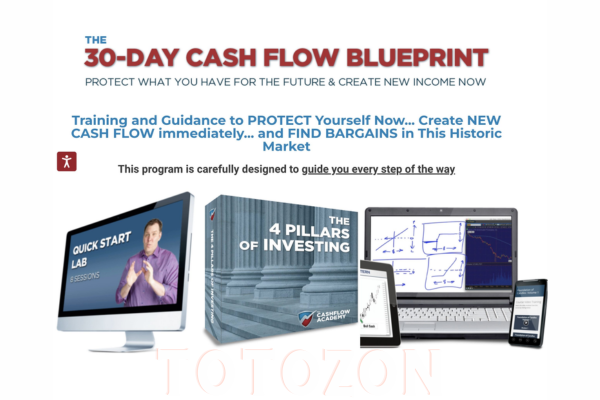 The 30-Day Cash Flow Blueprint with Andy Tanner
1 × $31.00
The 30-Day Cash Flow Blueprint with Andy Tanner
1 × $31.00 -
×
 The Complete Dividend Investing Course (Updated 2019) with Wealthy Education
1 × $6.00
The Complete Dividend Investing Course (Updated 2019) with Wealthy Education
1 × $6.00 -
×
 Scalp Strategy and Flipping Small Accounts with Opes Trading Group
1 × $5.00
Scalp Strategy and Flipping Small Accounts with Opes Trading Group
1 × $5.00 -
×
 Trading Short TermSame Day Trades Sep 2023 with Dan Sheridan & Mark Fenton - Sheridan Options Mentoring
1 × $31.00
Trading Short TermSame Day Trades Sep 2023 with Dan Sheridan & Mark Fenton - Sheridan Options Mentoring
1 × $31.00 -
×
 Fundamentals Trading
1 × $6.00
Fundamentals Trading
1 × $6.00 -
×
 EZ2 Trade Charting Collection eSignal (ez2tradesoftware.com) - Raghee Horner
1 × $6.00
EZ2 Trade Charting Collection eSignal (ez2tradesoftware.com) - Raghee Horner
1 × $6.00 -
×
 Pristine - Greg Capra – Sentiment Internal Indicators. Winning Swing & Position Trading
1 × $6.00
Pristine - Greg Capra – Sentiment Internal Indicators. Winning Swing & Position Trading
1 × $6.00 -
×
 Forex Power Strategy Course with Jason Steele
1 × $6.00
Forex Power Strategy Course with Jason Steele
1 × $6.00 -
×
 The Best (Public) Trading Methods I’ve Found for Futures & Equities with Perry J.Kaufman
1 × $6.00
The Best (Public) Trading Methods I’ve Found for Futures & Equities with Perry J.Kaufman
1 × $6.00 -
×
 The Instagram DM Automation Playbook with Natasha Takahashi
1 × $6.00
The Instagram DM Automation Playbook with Natasha Takahashi
1 × $6.00 -
×
 Stock Traders Almanac 2008 with Jeffrey Hirsch & Yale Hirsch
1 × $6.00
Stock Traders Almanac 2008 with Jeffrey Hirsch & Yale Hirsch
1 × $6.00 -
×
 Baby Blue Trading Technique for the E-Minis with Dave Wright
1 × $6.00
Baby Blue Trading Technique for the E-Minis with Dave Wright
1 × $6.00 -
×
 Trading Using Ocean Theory with Pat Raffolovich
1 × $4.00
Trading Using Ocean Theory with Pat Raffolovich
1 × $4.00 -
×
 The 1st Leveraged ETF Trading Strategies Workshop
1 × $54.00
The 1st Leveraged ETF Trading Strategies Workshop
1 × $54.00 -
×
 CFA Pro Level 1 2004 CD - Scheweser
1 × $6.00
CFA Pro Level 1 2004 CD - Scheweser
1 × $6.00 -
×
 Trading Volatility - The Ultimate Course with Master Trader
1 × $69.00
Trading Volatility - The Ultimate Course with Master Trader
1 × $69.00 -
×
 Avoiding Trading Mistakes with Mark D.Cook
1 × $6.00
Avoiding Trading Mistakes with Mark D.Cook
1 × $6.00 -
×
 Simple Trade Strategies
1 × $31.00
Simple Trade Strategies
1 × $31.00 -
×
 Crypto Trading Cyber Security for Bitcoin & Altcoin Holders with Zlatin Georgiev
1 × $5.00
Crypto Trading Cyber Security for Bitcoin & Altcoin Holders with Zlatin Georgiev
1 × $5.00 -
×
 ICT Prodigy Trading Course – $650K in Payouts with Alex Solignani
1 × $15.00
ICT Prodigy Trading Course – $650K in Payouts with Alex Solignani
1 × $15.00 -
×
 Trading Aplications of Japanese Candlestick Charting with Gary S.Wagner & Bradley L.Matheny
1 × $6.00
Trading Aplications of Japanese Candlestick Charting with Gary S.Wagner & Bradley L.Matheny
1 × $6.00 -
×
 Channel Analysis. The Key to Improved Timing of Trades with Brian J.Millard
1 × $6.00
Channel Analysis. The Key to Improved Timing of Trades with Brian J.Millard
1 × $6.00 -
×
 Transforms and Applications Handbook (2nd Edition) with Alexander Poularikas
1 × $6.00
Transforms and Applications Handbook (2nd Edition) with Alexander Poularikas
1 × $6.00 -
×
 The Market Geometry Basic Seminar DVD with Market Geometry
1 × $31.00
The Market Geometry Basic Seminar DVD with Market Geometry
1 × $31.00 -
×
 Forex Made Easy: 6 Ways to Trade the Dollar with James Dicks
1 × $6.00
Forex Made Easy: 6 Ways to Trade the Dollar with James Dicks
1 × $6.00 -
×
![Trading The Elliott Wave Indicator (2003) [1 MP4] by Robert Prechter image](https://www.totozon.com/wp-content/uploads/2024/05/Trading-The-Elliott-Wave-Indicator-2003-1-MP4-by-Robert-Prechter-image.png) Trading The Elliott Wave Indicator (2003) [1 MP4] - Robert Prechter
1 × $6.00
Trading The Elliott Wave Indicator (2003) [1 MP4] - Robert Prechter
1 × $6.00 -
×
 Commitments of Traders : Strategies for Tracking the Market and Trading Profitably with Floyd Upperman
1 × $6.00
Commitments of Traders : Strategies for Tracking the Market and Trading Profitably with Floyd Upperman
1 × $6.00 -
×
 Active Investment Management: Finding and Harnessing Investment Skill with Charles Jackson
1 × $6.00
Active Investment Management: Finding and Harnessing Investment Skill with Charles Jackson
1 × $6.00 -
×
 TradeCraft: Your Path to Peak Performance Trading By Adam Grimes
1 × $15.00
TradeCraft: Your Path to Peak Performance Trading By Adam Grimes
1 × $15.00 -
×
 Crystal Ball Pack PLUS bonus Live Trade By Pat Mitchell - Trick Trades
1 × $20.00
Crystal Ball Pack PLUS bonus Live Trade By Pat Mitchell - Trick Trades
1 × $20.00

Beginners Chart Patterns Trading for Penny Stocks
Original price was: $49.00.$6.00Current price is: $6.00.
File Size: Coming soon!
Delivery Time: 1–12 hours
Media Type: Online Course
Beginners Chart Patterns Trading for Penny Stocks
Introduction
Trading penny stocks can be both exciting and profitable, but it requires a good understanding of chart patterns. Chart patterns provide visual representations of price movements, helping traders make informed decisions. This article explores essential chart patterns for beginners trading penny stocks, offering practical insights and tips to enhance your trading strategy.
What are Penny Stocks?
Definition
Penny stocks are typically low-priced stocks of small companies. They trade for less than $5 per share and are often found on over-the-counter (OTC) markets.
Why Trade Penny Stocks?
Penny stocks offer high volatility, which can lead to significant profits if traded correctly. However, they also come with higher risk, making it crucial to understand chart patterns.
Understanding Chart Patterns
1. What are Chart Patterns?
Chart patterns are formations created by the price movements of a stock over time. They help traders predict future price movements based on historical data.
2. Importance of Chart Patterns
Recognizing chart patterns allows traders to identify potential buy and sell signals, improving their chances of making profitable trades.
Common Chart Patterns for Penny Stocks
1. Head and Shoulders
Bullish Head and Shoulders
This pattern indicates a potential reversal in a downtrend. It consists of three peaks, with the middle peak (head) being the highest.
Bearish Head and Shoulders
A bearish version signals a reversal in an uptrend. The pattern forms three peaks, with the middle peak being the lowest.
2. Double Tops and Bottoms
Double Top
A double top pattern indicates a bearish reversal, forming two consecutive peaks at roughly the same price level.
Double Bottom
This pattern signals a bullish reversal, forming two consecutive troughs at approximately the same price level.
3. Triangles
Ascending Triangle
An ascending triangle is a bullish pattern that forms a horizontal resistance line and an upward-sloping support line.
Descending Triangle
A descending triangle is a bearish pattern that forms a horizontal support line and a downward-sloping resistance line.
Symmetrical Triangle
This pattern can signal either a bullish or bearish breakout, forming converging trend lines that resemble a triangle.
4. Flags and Pennants
Bullish Flag
A bullish flag forms after a strong upward move, indicating a continuation of the trend. It appears as a small rectangle that slopes downwards.
Bearish Flag
A bearish flag forms after a significant downward move, signaling a continuation of the trend. It appears as a small rectangle that slopes upwards.
Bullish Pennant
A bullish pennant forms after a strong upward move, resembling a small symmetrical triangle. It indicates a continuation of the bullish trend.
Bearish Pennant
A bearish pennant forms after a significant downward move, resembling a small symmetrical triangle. It signals a continuation of the bearish trend.
How to Trade Chart Patterns
1. Identifying the Pattern
Carefully analyze the stock chart to identify recognizable patterns. Look for clear formations and confirm with volume analysis.
2. Confirming the Pattern
Ensure the pattern is valid by confirming it with other technical indicators, such as moving averages or RSI.
3. Entering the Trade
Based on the identified pattern, determine your entry point. For example, in a bullish flag pattern, enter the trade as the price breaks above the upper trend line.
4. Setting Stop-Loss Orders
To manage risk, place stop-loss orders just below the support level in a bullish pattern or above the resistance level in a bearish pattern.
5. Taking Profits
Determine your profit targets based on the height of the pattern. For instance, in a double bottom pattern, the target could be the height between the bottoms and the neckline added to the breakout point.
Tips for Success in Penny Stock Trading
1. Start Small
Begin with a small investment to minimize risk while you learn and gain experience.
2. Stay Informed
Keep up with market news and trends that could impact the price movements of penny stocks.
3. Practice Patience
Avoid the temptation to make impulsive trades. Wait for clear patterns and signals before entering a trade.
4. Use a Trading Journal
Maintain a trading journal to record your trades, strategies, and outcomes. This helps you learn from your successes and mistakes.
5. Continuous Learning
Invest in your education by attending webinars, reading books, and following experienced traders. Continuous learning is key to long-term success.
Conclusion
Trading penny stocks using chart patterns can be a profitable strategy if done correctly. By understanding and identifying key patterns like head and shoulders, double tops and bottoms, and various triangle formations, you can make informed trading decisions. Remember to start small, stay informed, and practice patience. With time and experience, you can develop a winning strategy for trading penny stocks.
Frequently Asked Questions:
- Business Model Innovation:
Embrace our legitimate business model! We organize group buys, allowing participants to share costs for popular courses, making them accessible to those with limited financial resources. Our approach ensures affordability and accessibility, despite author concerns.
2. The Legal Environment:
The legality of our activity is uncertain. While we lack specific permission from course authors, there’s a technicality: authors didn’t impose resale limits upon course purchase. This presents both an opportunity for us and a benefit for individuals seeking low-cost access.
3. Quality Control:
Unveiling the Truth
Quality is paramount. Purchasing courses directly from sales pages ensures consistency with traditionally obtained materials. However, we’re not official course providers and don’t offer premium services:
- No scheduled coaching calls or sessions with the author.
- No access to the author’s private Facebook group or web portal.
- No entry to the author’s private membership forum.
- Direct email support from the author or their team is unavailable. Operating independently, we aim to bridge the pricing gap without additional services provided by official channels. Your understanding of our unique approach is valued
Be the first to review “Beginners Chart Patterns Trading for Penny Stocks”
You must be logged in to post a review.
Related products

Original price was: $1,849.00.$15.00Current price is: $15.00.
Original price was: $2,120.00.$15.00Current price is: $15.00.
Original price was: $299.00.$8.00Current price is: $8.00.

Forex Trading
Original price was: $550.00.$5.00Current price is: $5.00.
Original price was: $695.00.$41.00Current price is: $41.00.

Original price was: $139.00.$23.00Current price is: $23.00.

Original price was: $895.00.$15.00Current price is: $15.00.
Original price was: $649.00.$20.00Current price is: $20.00.

Original price was: $197.00.$5.00Current price is: $5.00.

Forex Trading
Original price was: $4,997.00.$27.00Current price is: $27.00.
Original price was: $999.00.$5.00Current price is: $5.00.

Forex Trading
Original price was: $850.00.$23.00Current price is: $23.00.
Forex Trading
Original price was: $397.00.$31.00Current price is: $31.00.

Original price was: $450.00.$23.00Current price is: $23.00.
Forex Trading
Original price was: $697.00.$5.00Current price is: $5.00.

Original price was: $1,200.00.$23.00Current price is: $23.00.

Original price was: $497.00.$31.00Current price is: $31.00.

Original price was: $799.00.$15.00Current price is: $15.00.

Forex Trading
Original price was: $1,098.00.$39.00Current price is: $39.00.

Original price was: $497.00.$11.00Current price is: $11.00.
Reviews
There are no reviews yet.