-
×
 CFA Level 2 - Sample Item Sets 2003
1 × $6.00
CFA Level 2 - Sample Item Sets 2003
1 × $6.00 -
×
 Support and Resistance Trading with Rob Booker
1 × $6.00
Support and Resistance Trading with Rob Booker
1 × $6.00 -
×
 Trade Execution with Yuri Shramenko
1 × $6.00
Trade Execution with Yuri Shramenko
1 × $6.00 -
×
 90 Days To Trade MasterClass with Jerremy Newsome & Matt Delong - Real Life Trading
1 × $104.00
90 Days To Trade MasterClass with Jerremy Newsome & Matt Delong - Real Life Trading
1 × $104.00 -
×
 Advanced Trading Applications of Candlestick Charting with Gary S.Wagner & Bradley L.Matheny
1 × $6.00
Advanced Trading Applications of Candlestick Charting with Gary S.Wagner & Bradley L.Matheny
1 × $6.00 -
×
 Stock Market Rules (2nd Ed.) with Michael Sheimo
1 × $6.00
Stock Market Rules (2nd Ed.) with Michael Sheimo
1 × $6.00 -
×
 The FX Swing Trading Blueprint with Swing FX
1 × $6.00
The FX Swing Trading Blueprint with Swing FX
1 × $6.00 -
×
 ETF Profit Driver Course with Bill Poulos
1 × $6.00
ETF Profit Driver Course with Bill Poulos
1 × $6.00 -
×
 Technical Analysis Entry & Exit with Andrew Baxter
1 × $6.00
Technical Analysis Entry & Exit with Andrew Baxter
1 × $6.00 -
×
 Order flow self-study training program with iMFtracker
1 × $10.00
Order flow self-study training program with iMFtracker
1 × $10.00 -
×
 All About Mutual Funds with Bruce Jacobs
1 × $6.00
All About Mutual Funds with Bruce Jacobs
1 × $6.00 -
×
 The Complete Guide to Multiple Time Frame Analysis & Reading Price Action with Aiman Almansoori
1 × $13.00
The Complete Guide to Multiple Time Frame Analysis & Reading Price Action with Aiman Almansoori
1 × $13.00 -
×
 Crystal Ball Pack PLUS bonus Live Trade By Pat Mitchell - Trick Trades
1 × $20.00
Crystal Ball Pack PLUS bonus Live Trade By Pat Mitchell - Trick Trades
1 × $20.00 -
×
 Hedge Fund Alpha with John Longo - World Scientific
1 × $6.00
Hedge Fund Alpha with John Longo - World Scientific
1 × $6.00 -
×
 Trading with the Gods Fibonacci Series with Alan Oliver
1 × $6.00
Trading with the Gods Fibonacci Series with Alan Oliver
1 × $6.00 -
×
 Dan Sheridan Butterfly Course (Sep 2012)
1 × $6.00
Dan Sheridan Butterfly Course (Sep 2012)
1 × $6.00 -
×
 Elliott Wave Swing High Low Indicator for ThinkorSwim with Fibonacci
1 × $6.00
Elliott Wave Swing High Low Indicator for ThinkorSwim with Fibonacci
1 × $6.00 -
×
 Adz Trading Academy
1 × $5.00
Adz Trading Academy
1 × $5.00 -
×
 Active Investing courses notes with Alan Hull
1 × $6.00
Active Investing courses notes with Alan Hull
1 × $6.00 -
×
 Offensive & Defensive Strengths of Stocks, Groups & Sectors Gary Anderson
1 × $6.00
Offensive & Defensive Strengths of Stocks, Groups & Sectors Gary Anderson
1 × $6.00 -
×
 Sovereign Man Price Value International 2016
1 × $15.00
Sovereign Man Price Value International 2016
1 × $15.00 -
×
 4 Day Trading Bootcamp
1 × $31.00
4 Day Trading Bootcamp
1 × $31.00 -
×
 All Access Online Trading Course with Steve Luke
1 × $6.00
All Access Online Trading Course with Steve Luke
1 × $6.00 -
×
 Technical Analysis Applications in the Global Currency Markets (2nd Ed.) with Cornelius Luca
1 × $6.00
Technical Analysis Applications in the Global Currency Markets (2nd Ed.) with Cornelius Luca
1 × $6.00 -
×
 Cheatcode Trend System with Dominique Woodson
1 × $15.00
Cheatcode Trend System with Dominique Woodson
1 × $15.00 -
×
 5 Part Daytrading Course with Kevin Haggerty
1 × $6.00
5 Part Daytrading Course with Kevin Haggerty
1 × $6.00 -
×
 Advanced Spread Trading with Guy Bower - MasterClass Trader
1 × $15.00
Advanced Spread Trading with Guy Bower - MasterClass Trader
1 × $15.00 -
×
 The Michanics of Futures Trading - Roy Habben
1 × $6.00
The Michanics of Futures Trading - Roy Habben
1 × $6.00 -
×
 Trading Full Circle the Complete Underground Trader System for Timing with Jea Yu
1 × $6.00
Trading Full Circle the Complete Underground Trader System for Timing with Jea Yu
1 × $6.00 -
×
 The Trading Blueprint with Brad Goh - The Trading Geek
1 × $5.00
The Trading Blueprint with Brad Goh - The Trading Geek
1 × $5.00 -
×
 Mastering Income Spread Trading with Dave Aquino - Base Camp Trading
1 × $23.00
Mastering Income Spread Trading with Dave Aquino - Base Camp Trading
1 × $23.00 -
×
 Applied Quantitative Methods for Trading and Investment with Christian Dunis, Jason Laws & Patrick Na¿m
1 × $6.00
Applied Quantitative Methods for Trading and Investment with Christian Dunis, Jason Laws & Patrick Na¿m
1 × $6.00 -
×
 Trading Strategies with Larry Sanders
1 × $6.00
Trading Strategies with Larry Sanders
1 × $6.00 -
×
 Big Boy Volume Spread Analysis + Advanced Price Action Mastery Course with Kai Sheng Chew
1 × $15.00
Big Boy Volume Spread Analysis + Advanced Price Action Mastery Course with Kai Sheng Chew
1 × $15.00 -
×
 Forecast 2024 Clarification with Larry Williams
1 × $15.00
Forecast 2024 Clarification with Larry Williams
1 × $15.00 -
×
 The Investor Accelerator Premium Membership
1 × $34.00
The Investor Accelerator Premium Membership
1 × $34.00 -
×
 Value, Price & Profit with Karl Marx
1 × $6.00
Value, Price & Profit with Karl Marx
1 × $6.00 -
×
 Trading Day By Day & Code (chickgoslin.com) with Chick Goslin
1 × $6.00
Trading Day By Day & Code (chickgoslin.com) with Chick Goslin
1 × $6.00 -
×
 Stock Trading Strategies Technical Analysis MasterClass 2 with Jyoti Bansal
1 × $6.00
Stock Trading Strategies Technical Analysis MasterClass 2 with Jyoti Bansal
1 × $6.00 -
×
 Beat The Market Maker
1 × $62.00
Beat The Market Maker
1 × $62.00 -
×
 BD FX Course with FX Learning
1 × $6.00
BD FX Course with FX Learning
1 × $6.00 -
×
 The A14 Weekly Option Strategy Workshop with Amy Meissner
1 × $23.00
The A14 Weekly Option Strategy Workshop with Amy Meissner
1 × $23.00 -
×
 Channels & Cycles. A Tribute to J.M.Hurst with Brian J.Millard
1 × $6.00
Channels & Cycles. A Tribute to J.M.Hurst with Brian J.Millard
1 × $6.00 -
×
 Become A Quant Trader Bundle with Lachezar Haralampiev & Radoslav Haralampiev - Quant Factory
1 × $17.00
Become A Quant Trader Bundle with Lachezar Haralampiev & Radoslav Haralampiev - Quant Factory
1 × $17.00 -
×
 Affinity Foundation Stocks Course with Affinitytrading
1 × $6.00
Affinity Foundation Stocks Course with Affinitytrading
1 × $6.00 -
×
 WickOrTreat Trading Course with WickOrTreat
1 × $6.00
WickOrTreat Trading Course with WickOrTreat
1 × $6.00 -
×
 ART Online 4 Weeks Home Study Course with Bennett McDowell
1 × $78.00
ART Online 4 Weeks Home Study Course with Bennett McDowell
1 × $78.00 -
×
 How To Invest By Instinct: Instinctively Self Guided Investments with Lin Eldridge
1 × $6.00
How To Invest By Instinct: Instinctively Self Guided Investments with Lin Eldridge
1 × $6.00 -
×
 The Afluent Desktop Currency Trader with Amin Sadak
1 × $6.00
The Afluent Desktop Currency Trader with Amin Sadak
1 × $6.00 -
×
 D5 Render Course with Nuno Silva
1 × $27.00
D5 Render Course with Nuno Silva
1 × $27.00 -
×
 Complete Gunner24 Trading & Forecasting Course
1 × $6.00
Complete Gunner24 Trading & Forecasting Course
1 × $6.00 -
×
 Unlocking the Mysteries of Trend Analysis - Rick Bensignor
1 × $6.00
Unlocking the Mysteries of Trend Analysis - Rick Bensignor
1 × $6.00 -
×
 The Subtle Trap of Trading with Brian McAboy
1 × $6.00
The Subtle Trap of Trading with Brian McAboy
1 × $6.00 -
×
 Algo Trading Masterclass with Ali Casey - StatOasis
1 × $23.00
Algo Trading Masterclass with Ali Casey - StatOasis
1 × $23.00 -
×
 The Inve$tment A$trology Articles with Alan Richter
1 × $6.00
The Inve$tment A$trology Articles with Alan Richter
1 × $6.00 -
×
 Investing Smart. How to Pick Stocks with Investors Business Daily By Dhun H.Sethna
1 × $4.00
Investing Smart. How to Pick Stocks with Investors Business Daily By Dhun H.Sethna
1 × $4.00 -
×
 Building Automated Trading Systems C++.NET with Benjamin Van Vliet
1 × $6.00
Building Automated Trading Systems C++.NET with Benjamin Van Vliet
1 × $6.00 -
×
 Wall Street Training
1 × $6.00
Wall Street Training
1 × $6.00 -
×
 High Probability Trading Using Elliott Wave And Fibonacci Analysis withVic Patel - Forex Training Group
1 × $10.00
High Probability Trading Using Elliott Wave And Fibonacci Analysis withVic Patel - Forex Training Group
1 × $10.00 -
×
 Traders Classroom Collection Volume 1-4 with Jeffrey Kennedy
1 × $15.00
Traders Classroom Collection Volume 1-4 with Jeffrey Kennedy
1 × $15.00 -
×
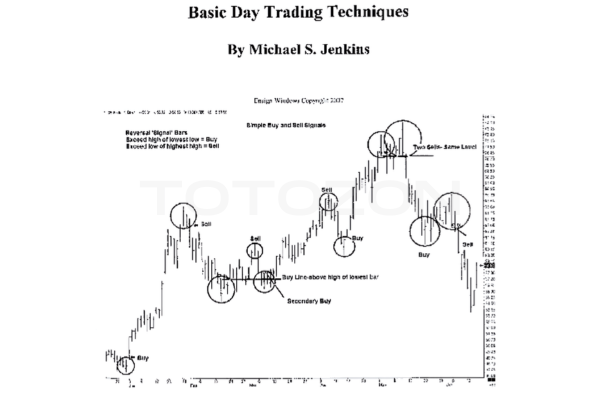 Basic Day Trading Techniques with Michael Jenkins
1 × $6.00
Basic Day Trading Techniques with Michael Jenkins
1 × $6.00 -
×
 Winning With The Market with Douglas R.Sease
1 × $6.00
Winning With The Market with Douglas R.Sease
1 × $6.00 -
×
 White Phoenix’s The Smart (Money) Approach to Trading with Jayson Casper
1 × $39.00
White Phoenix’s The Smart (Money) Approach to Trading with Jayson Casper
1 × $39.00

Beginners Chart Patterns Trading for Penny Stocks
Original price was: $49.00.$6.00Current price is: $6.00.
File Size: Coming soon!
Delivery Time: 1–12 hours
Media Type: Online Course
Beginners Chart Patterns Trading for Penny Stocks
Introduction
Trading penny stocks can be both exciting and profitable, but it requires a good understanding of chart patterns. Chart patterns provide visual representations of price movements, helping traders make informed decisions. This article explores essential chart patterns for beginners trading penny stocks, offering practical insights and tips to enhance your trading strategy.
What are Penny Stocks?
Definition
Penny stocks are typically low-priced stocks of small companies. They trade for less than $5 per share and are often found on over-the-counter (OTC) markets.
Why Trade Penny Stocks?
Penny stocks offer high volatility, which can lead to significant profits if traded correctly. However, they also come with higher risk, making it crucial to understand chart patterns.
Understanding Chart Patterns
1. What are Chart Patterns?
Chart patterns are formations created by the price movements of a stock over time. They help traders predict future price movements based on historical data.
2. Importance of Chart Patterns
Recognizing chart patterns allows traders to identify potential buy and sell signals, improving their chances of making profitable trades.
Common Chart Patterns for Penny Stocks
1. Head and Shoulders
Bullish Head and Shoulders
This pattern indicates a potential reversal in a downtrend. It consists of three peaks, with the middle peak (head) being the highest.
Bearish Head and Shoulders
A bearish version signals a reversal in an uptrend. The pattern forms three peaks, with the middle peak being the lowest.
2. Double Tops and Bottoms
Double Top
A double top pattern indicates a bearish reversal, forming two consecutive peaks at roughly the same price level.
Double Bottom
This pattern signals a bullish reversal, forming two consecutive troughs at approximately the same price level.
3. Triangles
Ascending Triangle
An ascending triangle is a bullish pattern that forms a horizontal resistance line and an upward-sloping support line.
Descending Triangle
A descending triangle is a bearish pattern that forms a horizontal support line and a downward-sloping resistance line.
Symmetrical Triangle
This pattern can signal either a bullish or bearish breakout, forming converging trend lines that resemble a triangle.
4. Flags and Pennants
Bullish Flag
A bullish flag forms after a strong upward move, indicating a continuation of the trend. It appears as a small rectangle that slopes downwards.
Bearish Flag
A bearish flag forms after a significant downward move, signaling a continuation of the trend. It appears as a small rectangle that slopes upwards.
Bullish Pennant
A bullish pennant forms after a strong upward move, resembling a small symmetrical triangle. It indicates a continuation of the bullish trend.
Bearish Pennant
A bearish pennant forms after a significant downward move, resembling a small symmetrical triangle. It signals a continuation of the bearish trend.
How to Trade Chart Patterns
1. Identifying the Pattern
Carefully analyze the stock chart to identify recognizable patterns. Look for clear formations and confirm with volume analysis.
2. Confirming the Pattern
Ensure the pattern is valid by confirming it with other technical indicators, such as moving averages or RSI.
3. Entering the Trade
Based on the identified pattern, determine your entry point. For example, in a bullish flag pattern, enter the trade as the price breaks above the upper trend line.
4. Setting Stop-Loss Orders
To manage risk, place stop-loss orders just below the support level in a bullish pattern or above the resistance level in a bearish pattern.
5. Taking Profits
Determine your profit targets based on the height of the pattern. For instance, in a double bottom pattern, the target could be the height between the bottoms and the neckline added to the breakout point.
Tips for Success in Penny Stock Trading
1. Start Small
Begin with a small investment to minimize risk while you learn and gain experience.
2. Stay Informed
Keep up with market news and trends that could impact the price movements of penny stocks.
3. Practice Patience
Avoid the temptation to make impulsive trades. Wait for clear patterns and signals before entering a trade.
4. Use a Trading Journal
Maintain a trading journal to record your trades, strategies, and outcomes. This helps you learn from your successes and mistakes.
5. Continuous Learning
Invest in your education by attending webinars, reading books, and following experienced traders. Continuous learning is key to long-term success.
Conclusion
Trading penny stocks using chart patterns can be a profitable strategy if done correctly. By understanding and identifying key patterns like head and shoulders, double tops and bottoms, and various triangle formations, you can make informed trading decisions. Remember to start small, stay informed, and practice patience. With time and experience, you can develop a winning strategy for trading penny stocks.
Frequently Asked Questions:
- Business Model Innovation:
Embrace our legitimate business model! We organize group buys, allowing participants to share costs for popular courses, making them accessible to those with limited financial resources. Our approach ensures affordability and accessibility, despite author concerns.
2. The Legal Environment:
The legality of our activity is uncertain. While we lack specific permission from course authors, there’s a technicality: authors didn’t impose resale limits upon course purchase. This presents both an opportunity for us and a benefit for individuals seeking low-cost access.
3. Quality Control:
Unveiling the Truth
Quality is paramount. Purchasing courses directly from sales pages ensures consistency with traditionally obtained materials. However, we’re not official course providers and don’t offer premium services:
- No scheduled coaching calls or sessions with the author.
- No access to the author’s private Facebook group or web portal.
- No entry to the author’s private membership forum.
- Direct email support from the author or their team is unavailable. Operating independently, we aim to bridge the pricing gap without additional services provided by official channels. Your understanding of our unique approach is valued
Be the first to review “Beginners Chart Patterns Trading for Penny Stocks”
You must be logged in to post a review.
Related products

Forex Trading
Original price was: $850.00.$23.00Current price is: $23.00.

Original price was: $997.00.$8.00Current price is: $8.00.
Forex Trading
Original price was: $249.00.$15.00Current price is: $15.00.

Original price was: $299.00.$8.00Current price is: $8.00.

Forex Trading
Original price was: $239.00.$8.00Current price is: $8.00.

Original price was: $197.00.$5.00Current price is: $5.00.
Original price was: $895.00.$15.00Current price is: $15.00.

Forex Trading
Original price was: $999.00.$15.00Current price is: $15.00.

Original price was: $497.00.$11.00Current price is: $11.00.
Forex Trading
The Complete Guide to Multiple Time Frame Analysis & Reading Price Action with Aiman Almansoori
Original price was: $1,399.00.$13.00Current price is: $13.00.

Original price was: $1,200.00.$23.00Current price is: $23.00.

Original price was: $497.00.$31.00Current price is: $31.00.

Original price was: $695.00.$41.00Current price is: $41.00.
Forex Trading
Original price was: $797.00.$10.00Current price is: $10.00.

Forex Trading
Original price was: $499.00.$15.00Current price is: $15.00.

Forex Trading
Original price was: $397.00.$31.00Current price is: $31.00.

Original price was: $450.00.$23.00Current price is: $23.00.

Forex Trading
Original price was: $799.00.$15.00Current price is: $15.00.

Forex Trading
Quantamentals – The Next Great Forefront Of Trading and Investing with Trading Markets
Original price was: $1,495.00.$8.00Current price is: $8.00.

Forex Trading
Original price was: $125.00.$17.00Current price is: $17.00.
Reviews
There are no reviews yet.