-
×
 5 Day Bootcamp with AWFX AnthonysWorld
1 × $34.00
5 Day Bootcamp with AWFX AnthonysWorld
1 × $34.00 -
×
 Quantum Stone Capital
1 × $15.00
Quantum Stone Capital
1 × $15.00 -
×
 HandBook of Parametric and Nonparametric Statistical Procedures with David J.Sheskin
1 × $6.00
HandBook of Parametric and Nonparametric Statistical Procedures with David J.Sheskin
1 × $6.00 -
×
 Learn To Day-Trade the E-Mini S&P 500. Simple-as-123 with Marshall Jones
1 × $6.00
Learn To Day-Trade the E-Mini S&P 500. Simple-as-123 with Marshall Jones
1 × $6.00 -
×
 Matrix Spread Options Trading Course with Base Camp Trading
1 × $31.00
Matrix Spread Options Trading Course with Base Camp Trading
1 × $31.00 -
×
 Get to know the VIX Index (aka The Fear Index)
1 × $15.00
Get to know the VIX Index (aka The Fear Index)
1 × $15.00 -
×
 Cecil Robles Advent Forex Course & Indicators with Adventforex
1 × $6.00
Cecil Robles Advent Forex Course & Indicators with Adventforex
1 × $6.00 -
×
 Investment Science with David G.Luenberger
1 × $6.00
Investment Science with David G.Luenberger
1 × $6.00 -
×
 The Naked Eye: Raw Data Analytics with Edgar Torres - Raw Data Analytics
1 × $8.00
The Naked Eye: Raw Data Analytics with Edgar Torres - Raw Data Analytics
1 × $8.00 -
×
 How to Avoid Tax on Your Stock Market Profits with Lee Hadnum
1 × $6.00
How to Avoid Tax on Your Stock Market Profits with Lee Hadnum
1 × $6.00 -
×
 0 DTE Options Trading Workshop with Aeromir Corporation
1 × $15.00
0 DTE Options Trading Workshop with Aeromir Corporation
1 × $15.00 -
×
 Futures Commodity Trading with G. Scott Martin
1 × $6.00
Futures Commodity Trading with G. Scott Martin
1 × $6.00 -
×
 Psycho-Paper 96 with Charles Drummond
1 × $6.00
Psycho-Paper 96 with Charles Drummond
1 × $6.00 -
×
 Right Line Trading IndicatorSuite (May 2015)
1 × $31.00
Right Line Trading IndicatorSuite (May 2015)
1 × $31.00 -
×
 P.A.T Trading Course (Low Video Quality) with Martin Cole
1 × $6.00
P.A.T Trading Course (Low Video Quality) with Martin Cole
1 × $6.00 -
×
 The Adventures of the Cycle Hunter. The Cyclist with Craig Bttlc
1 × $6.00
The Adventures of the Cycle Hunter. The Cyclist with Craig Bttlc
1 × $6.00 -
×
 Master Class Recording 2019 with Oil Trading Academy
1 × $17.00
Master Class Recording 2019 with Oil Trading Academy
1 × $17.00 -
×
 Profitable Strategies with Gemify Academy
1 × $10.00
Profitable Strategies with Gemify Academy
1 × $10.00 -
×
 Complete Times Course with Afshin Taghechian
1 × $6.00
Complete Times Course with Afshin Taghechian
1 × $6.00 -
×
 Advanced Technical Strategies Home Study Course with T3 LIVE
1 × $31.00
Advanced Technical Strategies Home Study Course with T3 LIVE
1 × $31.00 -
×
 Profiletraders - MARKET PROFILE TACTICAL STRATEGIES FOR DAY TRADING
1 × $23.00
Profiletraders - MARKET PROFILE TACTICAL STRATEGIES FOR DAY TRADING
1 × $23.00 -
×
 White Phoenix’s The Smart (Money) Approach to Trading with Jayson Casper
1 × $39.00
White Phoenix’s The Smart (Money) Approach to Trading with Jayson Casper
1 × $39.00 -
×
 Guide To Selling High Probability Spreads Class with Don Kaufman
1 × $6.00
Guide To Selling High Probability Spreads Class with Don Kaufman
1 × $6.00 -
×
 How I Day Trade Course with Traderade
1 × $15.00
How I Day Trade Course with Traderade
1 × $15.00 -
×
 Technical Analysis 201: From Chart Setups to Trading Execution Methodology Class with Jeff Bierman
1 × $6.00
Technical Analysis 201: From Chart Setups to Trading Execution Methodology Class with Jeff Bierman
1 × $6.00 -
×
 New York Institute of Finance – Futures. A Personal Seminar
1 × $6.00
New York Institute of Finance – Futures. A Personal Seminar
1 × $6.00 -
×
 5 Essential Building Blocks to Successful Trading Workshop with Steve "Slim" Miller
1 × $6.00
5 Essential Building Blocks to Successful Trading Workshop with Steve "Slim" Miller
1 × $6.00 -
×
 Strike Zone Strategy 2.0 Elite Package with Joe Rokop
1 × $39.00
Strike Zone Strategy 2.0 Elite Package with Joe Rokop
1 × $39.00 -
×
 FXStreet Unrecorded Webinars Sept & Oct, 2011 with Sam Seiden
1 × $6.00
FXStreet Unrecorded Webinars Sept & Oct, 2011 with Sam Seiden
1 × $6.00 -
×
 Forex Trading Systems Elearning Course - Busted Breakout System with Van Tharp
1 × $6.00
Forex Trading Systems Elearning Course - Busted Breakout System with Van Tharp
1 × $6.00 -
×
 The Complete Turtle Trader with Michael Covel
1 × $6.00
The Complete Turtle Trader with Michael Covel
1 × $6.00 -
×
 Quarterly Theory with Trader Daye
1 × $20.00
Quarterly Theory with Trader Daye
1 × $20.00 -
×
 High Probability Trading Using Elliott Wave And Fibonacci Analysis withVic Patel - Forex Training Group
1 × $10.00
High Probability Trading Using Elliott Wave And Fibonacci Analysis withVic Patel - Forex Training Group
1 × $10.00 -
×
 How to Manage a $25,000 Portfolio with Dan Sheridan - Sheridan Options Mentoring
1 × $6.00
How to Manage a $25,000 Portfolio with Dan Sheridan - Sheridan Options Mentoring
1 × $6.00 -
×
 The Best Option Trading Course with David Jaffee - Best Stock Strategy
1 × $15.00
The Best Option Trading Course with David Jaffee - Best Stock Strategy
1 × $15.00 -
×
 The A to Z of Mathematics: A Basic Guide with Thomas Sidebotham
1 × $6.00
The A to Z of Mathematics: A Basic Guide with Thomas Sidebotham
1 × $6.00 -
×
 The HV7 Option Trading System with Amy Meissner – Aeromir
1 × $8.00
The HV7 Option Trading System with Amy Meissner – Aeromir
1 × $8.00 -
×
 How to Call the Top in a Stock (To the Penny!) and Earn 9-11% Annualized Cash Yields Doing It with Dan Ferris
1 × $6.00
How to Call the Top in a Stock (To the Penny!) and Earn 9-11% Annualized Cash Yields Doing It with Dan Ferris
1 × $6.00 -
×
 Master The Art of Technical Analysis with Raul Gonzalez
1 × $31.00
Master The Art of Technical Analysis with Raul Gonzalez
1 × $31.00 -
×
 Best of the Best: Collars with Amy Meissner & Scott Ruble
1 × $15.00
Best of the Best: Collars with Amy Meissner & Scott Ruble
1 × $15.00 -
×
 The 4 Horsemen CD with David Elliott
1 × $6.00
The 4 Horsemen CD with David Elliott
1 × $6.00 -
×
 An Introduction to Option Trading Success with James Bittman
1 × $6.00
An Introduction to Option Trading Success with James Bittman
1 × $6.00 -
×
 Guidelines for Analysis and Establishing a Trading Plan with Charles Drummond
1 × $6.00
Guidelines for Analysis and Establishing a Trading Plan with Charles Drummond
1 × $6.00 -
×
 The TC2000 Masterclass Course with Sasha Evdakov - Rise2learn
1 × $23.00
The TC2000 Masterclass Course with Sasha Evdakov - Rise2learn
1 × $23.00 -
×
 Fundamental Analysis with CA Rachana Ranade
1 × $5.00
Fundamental Analysis with CA Rachana Ranade
1 × $5.00 -
×
 Investing Guide For New Investor with Alfred Scillitani
1 × $6.00
Investing Guide For New Investor with Alfred Scillitani
1 × $6.00 -
×
 Pablo Order Flow Education with Pablo
1 × $6.00
Pablo Order Flow Education with Pablo
1 × $6.00 -
×
 How I use Technical Analysis & Orderflow with Adam Webb - Traderskew
1 × $54.00
How I use Technical Analysis & Orderflow with Adam Webb - Traderskew
1 × $54.00 -
×
 How I Trade the QQQs with Don Miller
1 × $6.00
How I Trade the QQQs with Don Miller
1 × $6.00 -
×
 Profit in the Futures Markets! with Jack Bernstein
1 × $6.00
Profit in the Futures Markets! with Jack Bernstein
1 × $6.00 -
×
 Forex and Stocks Trading Course - Set and Forget with Alfonso Moreno
1 × $6.00
Forex and Stocks Trading Course - Set and Forget with Alfonso Moreno
1 × $6.00 -
×
 Day Trading Insight with Al Brooks
1 × $10.00
Day Trading Insight with Al Brooks
1 × $10.00 -
×
 The Adventures of the Cycle Hunter. The Trader with Craig Bttlc
1 × $6.00
The Adventures of the Cycle Hunter. The Trader with Craig Bttlc
1 × $6.00 -
×
 The Orderflow Masterclass with PrimeTrading
1 × $17.00
The Orderflow Masterclass with PrimeTrading
1 × $17.00 -
×
 Finserv Corp Complete Course
1 × $4.00
Finserv Corp Complete Course
1 × $4.00 -
×
 Adx Mastery Complete Course
1 × $6.00
Adx Mastery Complete Course
1 × $6.00

How Do You Read Charts? A Guide to Classic Price Pattern Recognition Class with Professor Jeff Bierman
Original price was: $95.00.$6.00Current price is: $6.00.
File Size: 1.25 GB
Delivery Time: 1–12 hours
Media Type: Online Course
Content Proof: Watch Here!
You may check content proof of “How Do You Read Charts? A Guide to Classic Price Pattern Recognition Class with Professor Jeff Bierman” below:

How Do You Read Charts? A Guide to Classic Price Pattern Recognition Class with Professor Jeff Bierman
Introduction
In the world of trading and investment, chart reading is not just a skill—it’s an essential language. Professor Jeff Bierman, a renowned expert in technical analysis, has developed a comprehensive approach to understanding this language through classic price pattern recognition. Let’s dive into the fundamentals of chart reading as taught by Professor Bierman, and discover how you can turn these intricate patterns into actionable trading strategies.
Understanding Chart Types
What Are the Main Types of Charts?
- Line Charts: Simple and straightforward, showing the closing prices over time.
- Bar Charts: Provide more data such as opening, high, low, and closing prices.
- Candlestick Charts: Offer a detailed view of market psychology and can indicate potential reversals.
Why Chart Types Matter
Choosing the right chart type can enhance your ability to read and interpret market movements effectively. Each chart type provides different insights, which are crucial for making informed trading decisions.
The Basics of Price Patterns
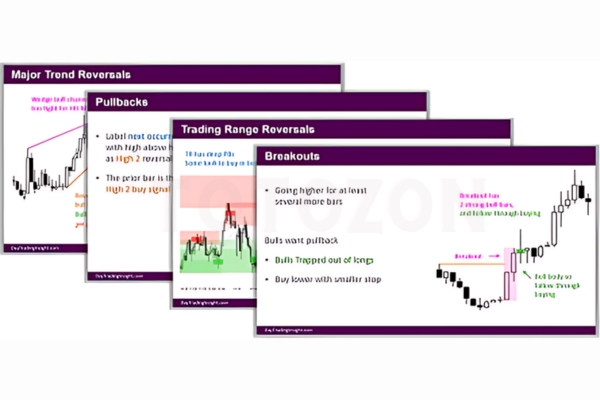
Identifying Common Price Patterns
- Head and Shoulders: Indicative of a reversal in trend.
- Double Tops and Bottoms: Signal strength or weakness in a market.
- Triangles and Flags: Suggest continuation or breakout.
What These Patterns Tell Us
Price patterns are the language of the markets. By learning to recognize these patterns, traders can anticipate potential market movements and adjust their strategies accordingly.
Decoding Market Trends with Professor Bierman
The Role of Volume in Chart Analysis
Volume plays a pivotal role in confirming the strength of a price pattern. Professor Bierman emphasizes the importance of volume analysis as a fundamental aspect of chart interpretation.
How Volume Influences Price Movements
- High volume during a market breakout suggests a strong move.
- Low volume may indicate a lack of conviction or potential reversal.
Using Technical Indicators
Technical indicators such as moving averages, RSI (Relative Strength Index), and MACD (Moving Average Convergence Divergence) are tools that, when used alongside price patterns, can provide deeper insights into market trends.
Applying Price Pattern Recognition in Trading
Steps to Effective Chart Reading
- Identify the chart type and set an appropriate time frame.
- Recognize the prevailing price patterns.
- Analyze volume and apply technical indicators to confirm the pattern.
- Make informed trading decisions based on the analysis.
Real-World Application
Through practical examples and case studies in his classes, Professor Bierman demonstrates how these strategies can be applied in real trading scenarios.
Advanced Techniques in Price Pattern Recognition
Beyond the Basics
Professor Bierman also covers more complex patterns and scenarios, including false breakouts and the psychology behind price movements, providing a more nuanced understanding of market dynamics.
Integrating Multiple Analysis Tools
Combining price patterns with other forms of technical analysis creates a robust trading strategy that can adapt to various market conditions.
Conclusion
Chart reading is an invaluable skill in the trading world, and Professor Jeff Bierman’s class on classic price pattern recognition offers a foundational gateway into mastering this skill. By understanding and applying the techniques discussed, traders can enhance their ability to make strategic decisions based on comprehensive market analysis.
FAQs
1. How important is chart type selection in trading?
Chart type selection is crucial as it determines the clarity and type of information available for making trading decisions.
2. Can price patterns predict market movements accurately?
While not infallible, price patterns provide significant insights and are widely used as predictive tools in trading.
3. How does Professor Bierman suggest using volume in trading?
Professor Bierman recommends using volume as a confirmation tool to ensure the strength of price movements and patterns.
4. Are technical indicators necessary for recognizing price patterns?
While not necessary, technical indicators greatly enhance the reliability of pattern recognition and trading decisions.
5. What’s the first step for a novice trader in learning chart reading?
The first step is understanding different chart types and beginning to recognize basic price patterns.
Be the first to review “How Do You Read Charts? A Guide to Classic Price Pattern Recognition Class with Professor Jeff Bierman”
You must be logged in to post a review.
Related products

Forex Trading
Quantamentals – The Next Great Forefront Of Trading and Investing with Trading Markets
Original price was: $1,495.00.$8.00Current price is: $8.00.
Original price was: $997.00.$8.00Current price is: $8.00.

Forex Trading
Original price was: $697.00.$5.00Current price is: $5.00.
Original price was: $799.00.$15.00Current price is: $15.00.

Forex Trading
Original price was: $499.00.$15.00Current price is: $15.00.

Original price was: $695.00.$41.00Current price is: $41.00.

Original price was: $1,800.00.$54.00Current price is: $54.00.
Original price was: $1,849.00.$15.00Current price is: $15.00.

Original price was: $310.00.$23.00Current price is: $23.00.
Forex Trading
Original price was: $125.00.$17.00Current price is: $17.00.

Forex Trading
Original price was: $2,997.00.$23.00Current price is: $23.00.

Forex Trading
Original price was: $799.00.$15.00Current price is: $15.00.

Original price was: $139.00.$23.00Current price is: $23.00.

Original price was: $1,200.00.$23.00Current price is: $23.00.

Forex Trading
Original price was: $1,098.00.$39.00Current price is: $39.00.

Original price was: $999.00.$5.00Current price is: $5.00.

Forex Trading
Original price was: $500.00.$5.00Current price is: $5.00.

Forex Trading
Original price was: $550.00.$5.00Current price is: $5.00.

Forex Trading
Original price was: $2,000.00.$23.00Current price is: $23.00.

Original price was: $2,120.00.$15.00Current price is: $15.00.

Reviews
There are no reviews yet.