-
×
 Practical Approach to Ninjatrader 8 Platform with Rajandran R
1 × $6.00
Practical Approach to Ninjatrader 8 Platform with Rajandran R
1 × $6.00 -
×
 The Great Divergence: China, Europe, and the Making of the Modern World Economy with Kenneth Pomeranz
1 × $6.00
The Great Divergence: China, Europe, and the Making of the Modern World Economy with Kenneth Pomeranz
1 × $6.00 -
×
 FOUS4 with Cameron Fous
1 × $5.00
FOUS4 with Cameron Fous
1 × $5.00 -
×
 Staying Alive in the Markets (Video & Manual) with Mark Cook
1 × $6.00
Staying Alive in the Markets (Video & Manual) with Mark Cook
1 × $6.00 -
×
 Price Analysis Webinar with Carolyn Boroden
1 × $6.00
Price Analysis Webinar with Carolyn Boroden
1 × $6.00 -
×
 30 Day Masterclass with Joe Elite Trader Hub ICT
1 × $6.00
30 Day Masterclass with Joe Elite Trader Hub ICT
1 × $6.00 -
×
 Options 201: Vertical and Calendar Spread Essentials 5 Part Class with Don Kaufman On Demand Replay
1 × $6.00
Options 201: Vertical and Calendar Spread Essentials 5 Part Class with Don Kaufman On Demand Replay
1 × $6.00 -
×
 High Reward Low Risk Forex Trading with Jarratt Davis and Vic Noble
1 × $6.00
High Reward Low Risk Forex Trading with Jarratt Davis and Vic Noble
1 × $6.00 -
×
 Gann Trade Real Time with Larry B.Jacobs
1 × $6.00
Gann Trade Real Time with Larry B.Jacobs
1 × $6.00 -
×
 Trade Options Like a DPM with The Admiral Webinar Series with Hamzei Analytics
1 × $6.00
Trade Options Like a DPM with The Admiral Webinar Series with Hamzei Analytics
1 × $6.00 -
×
 A Game Plan for Investing in the 21st Century with Thomas J.Dorsey
1 × $6.00
A Game Plan for Investing in the 21st Century with Thomas J.Dorsey
1 × $6.00 -
×
 HINT (High Income No Taxes) with Jeff Watson
1 × $54.00
HINT (High Income No Taxes) with Jeff Watson
1 × $54.00 -
×
 Setups of a Winning Trader with Gareth Soloway
1 × $521.00
Setups of a Winning Trader with Gareth Soloway
1 × $521.00 -
×
 Psycho-Paper 96 with Charles Drummond
1 × $6.00
Psycho-Paper 96 with Charles Drummond
1 × $6.00 -
×
 Options Trading & Ultimate MasterClass With Tyrone Abela - FX Evolution
1 × $54.00
Options Trading & Ultimate MasterClass With Tyrone Abela - FX Evolution
1 × $54.00 -
×
 Pattern Recognition: A Fundamental Introduction to Japanese Candlestick Charting Techniques Class with Jeff Bierman
1 × $6.00
Pattern Recognition: A Fundamental Introduction to Japanese Candlestick Charting Techniques Class with Jeff Bierman
1 × $6.00 -
×
 Russell Futures Scalping Course with Bill McDowell
1 × $6.00
Russell Futures Scalping Course with Bill McDowell
1 × $6.00 -
×
 Investing Online for Dummies (5th Edition) with Kathleen Sindell
1 × $6.00
Investing Online for Dummies (5th Edition) with Kathleen Sindell
1 × $6.00 -
×
 The Prop Trading Code with Brannigan Barrett - Axia Futures
1 × $23.00
The Prop Trading Code with Brannigan Barrett - Axia Futures
1 × $23.00 -
×
 TradeCraft: Your Path to Peak Performance Trading By Adam Grimes
1 × $15.00
TradeCraft: Your Path to Peak Performance Trading By Adam Grimes
1 × $15.00 -
×
 Ultimate Trading Course with Dodgy's Dungeon
1 × $8.00
Ultimate Trading Course with Dodgy's Dungeon
1 × $8.00 -
×
 A Really Friendly Guide to Wavelets with C.Vallens
1 × $6.00
A Really Friendly Guide to Wavelets with C.Vallens
1 × $6.00 -
×
 Deep Dive Butterfly Trading Strategy Class with SJG Trades
1 × $41.00
Deep Dive Butterfly Trading Strategy Class with SJG Trades
1 × $41.00 -
×
 Options Trading. The Hidden Reality Course with Charles Cottle
1 × $6.00
Options Trading. The Hidden Reality Course with Charles Cottle
1 × $6.00 -
×
 4 Strategies That Will Make You a Professional Day Trader with Jerremy Newsome
1 × $6.00
4 Strategies That Will Make You a Professional Day Trader with Jerremy Newsome
1 × $6.00 -
×
 5 Essential Building Blocks to Successful Trading Workshop with Steve "Slim" Miller
1 × $6.00
5 Essential Building Blocks to Successful Trading Workshop with Steve "Slim" Miller
1 × $6.00 -
×
 The Complete Guide to Multiple Time Frame Analysis & Reading Price Action with Aiman Almansoori
1 × $13.00
The Complete Guide to Multiple Time Frame Analysis & Reading Price Action with Aiman Almansoori
1 × $13.00 -
×
 $20 – 52k 20 pips a day challange with Rafał Zuchowicz - TopMasterTrader
1 × $5.00
$20 – 52k 20 pips a day challange with Rafał Zuchowicz - TopMasterTrader
1 × $5.00 -
×
 “The Beast” Automated Trading System V2 (Feb 2015)
1 × $15.00
“The Beast” Automated Trading System V2 (Feb 2015)
1 × $15.00 -
×
 2010 The Market Mastery Protégé Program
1 × $31.00
2010 The Market Mastery Protégé Program
1 × $31.00 -
×
 High Probability Trading Using Elliott Wave And Fibonacci Analysis withVic Patel - Forex Training Group
1 × $10.00
High Probability Trading Using Elliott Wave And Fibonacci Analysis withVic Patel - Forex Training Group
1 × $10.00 -
×
 2016 Chicago Annual Options Seminar with Dan Sheridan
1 × $23.00
2016 Chicago Annual Options Seminar with Dan Sheridan
1 × $23.00 -
×
 WondaFX Signature Strategy with WondaFX
1 × $5.00
WondaFX Signature Strategy with WondaFX
1 × $5.00 -
×
 Matrix Spread Options Trading Course with Base Camp Trading
1 × $31.00
Matrix Spread Options Trading Course with Base Camp Trading
1 × $31.00 -
×
 Home Run Options Trading Course with Dave Aquino - Base Camp Trading
1 × $11.00
Home Run Options Trading Course with Dave Aquino - Base Camp Trading
1 × $11.00 -
×
 1DTE Options Crashcourse with Justin Kay
1 × $46.00
1DTE Options Crashcourse with Justin Kay
1 × $46.00 -
×
 A-Z Course with InvestiTrade Academy
1 × $5.00
A-Z Course with InvestiTrade Academy
1 × $5.00 -
×
 The A14 Weekly Option Strategy Workshop with Amy Meissner
1 × $23.00
The A14 Weekly Option Strategy Workshop with Amy Meissner
1 × $23.00 -
×
 Compass Trading System with Right Line Trading
1 × $39.00
Compass Trading System with Right Line Trading
1 × $39.00 -
×
 Quantamentals - The Next Great Forefront Of Trading and Investing with Trading Markets
1 × $8.00
Quantamentals - The Next Great Forefront Of Trading and Investing with Trading Markets
1 × $8.00 -
×
 21 Candlesticks Every Trader Should Know with Melvin Pasternak
1 × $5.00
21 Candlesticks Every Trader Should Know with Melvin Pasternak
1 × $5.00 -
×
 Uncover Resilient Stocks in Today’s Market with Peter Worden
1 × $6.00
Uncover Resilient Stocks in Today’s Market with Peter Worden
1 × $6.00 -
×
 Advanced Spread Trading with Guy Bower - MasterClass Trader
1 × $15.00
Advanced Spread Trading with Guy Bower - MasterClass Trader
1 × $15.00 -
×
 Market Risk Analysis, Volume III, Pricing, Hedging and Trading Financial Instruments with Carol Alexander
1 × $6.00
Market Risk Analysis, Volume III, Pricing, Hedging and Trading Financial Instruments with Carol Alexander
1 × $6.00 -
×
 Crystal Ball Pack PLUS bonus Live Trade By Pat Mitchell - Trick Trades
1 × $20.00
Crystal Ball Pack PLUS bonus Live Trade By Pat Mitchell - Trick Trades
1 × $20.00 -
×
 11 Paper with Charles Drummond
1 × $6.00
11 Paper with Charles Drummond
1 × $6.00 -
×
 White Phoenix’s The Smart (Money) Approach to Trading with Jayson Casper
1 × $39.00
White Phoenix’s The Smart (Money) Approach to Trading with Jayson Casper
1 × $39.00 -
×
 ICT Prodigy Trading Course – $650K in Payouts with Alex Solignani
1 × $15.00
ICT Prodigy Trading Course – $650K in Payouts with Alex Solignani
1 × $15.00 -
×
 14-Day Options Trading Bootcamp (Jule 2014)
1 × $15.00
14-Day Options Trading Bootcamp (Jule 2014)
1 × $15.00 -
×
 Order flow self-study training program with iMFtracker
1 × $10.00
Order flow self-study training program with iMFtracker
1 × $10.00 -
×
 2-Phase Inducement Theorem with Vector Trading FX
1 × $6.00
2-Phase Inducement Theorem with Vector Trading FX
1 × $6.00 -
×
 Masterclass 3.0 with RockzFX Academy
1 × $6.00
Masterclass 3.0 with RockzFX Academy
1 × $6.00 -
×
 The Market Geometry Basic Seminar DVD with Market Geometry
1 × $31.00
The Market Geometry Basic Seminar DVD with Market Geometry
1 × $31.00 -
×
 Scalp Strategy and Flipping Small Accounts with Opes Trading Group
1 × $5.00
Scalp Strategy and Flipping Small Accounts with Opes Trading Group
1 × $5.00 -
×
 Algo Trading Masterclass with Ali Casey - StatOasis
1 × $23.00
Algo Trading Masterclass with Ali Casey - StatOasis
1 × $23.00 -
×
 TRADING NFX Course with Andrew NFX
1 × $5.00
TRADING NFX Course with Andrew NFX
1 × $5.00

How Do You Read Charts? A Guide to Classic Price Pattern Recognition Class with Professor Jeff Bierman
Original price was: $95.00.$6.00Current price is: $6.00.
File Size: 1.25 GB
Delivery Time: 1–12 hours
Media Type: Online Course
Content Proof: Watch Here!
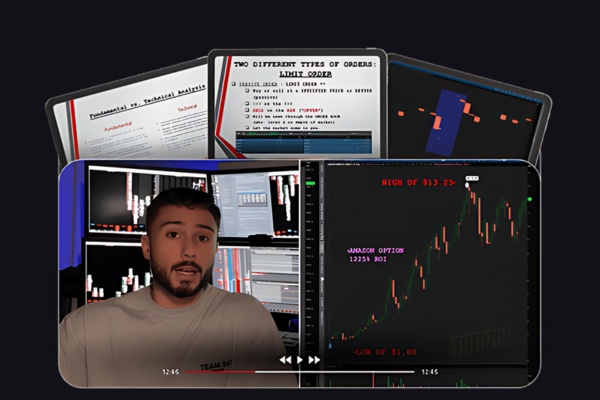
You may check content proof of “How Do You Read Charts? A Guide to Classic Price Pattern Recognition Class with Professor Jeff Bierman” below:

How Do You Read Charts? A Guide to Classic Price Pattern Recognition Class with Professor Jeff Bierman
Introduction
In the world of trading and investment, chart reading is not just a skill—it’s an essential language. Professor Jeff Bierman, a renowned expert in technical analysis, has developed a comprehensive approach to understanding this language through classic price pattern recognition. Let’s dive into the fundamentals of chart reading as taught by Professor Bierman, and discover how you can turn these intricate patterns into actionable trading strategies.
Understanding Chart Types
What Are the Main Types of Charts?
- Line Charts: Simple and straightforward, showing the closing prices over time.
- Bar Charts: Provide more data such as opening, high, low, and closing prices.
- Candlestick Charts: Offer a detailed view of market psychology and can indicate potential reversals.
Why Chart Types Matter
Choosing the right chart type can enhance your ability to read and interpret market movements effectively. Each chart type provides different insights, which are crucial for making informed trading decisions.
The Basics of Price Patterns
Identifying Common Price Patterns
- Head and Shoulders: Indicative of a reversal in trend.
- Double Tops and Bottoms: Signal strength or weakness in a market.
- Triangles and Flags: Suggest continuation or breakout.
What These Patterns Tell Us
Price patterns are the language of the markets. By learning to recognize these patterns, traders can anticipate potential market movements and adjust their strategies accordingly.
Decoding Market Trends with Professor Bierman
The Role of Volume in Chart Analysis
Volume plays a pivotal role in confirming the strength of a price pattern. Professor Bierman emphasizes the importance of volume analysis as a fundamental aspect of chart interpretation.
How Volume Influences Price Movements
- High volume during a market breakout suggests a strong move.
- Low volume may indicate a lack of conviction or potential reversal.
Using Technical Indicators
Technical indicators such as moving averages, RSI (Relative Strength Index), and MACD (Moving Average Convergence Divergence) are tools that, when used alongside price patterns, can provide deeper insights into market trends.
Applying Price Pattern Recognition in Trading
Steps to Effective Chart Reading
- Identify the chart type and set an appropriate time frame.
- Recognize the prevailing price patterns.
- Analyze volume and apply technical indicators to confirm the pattern.
- Make informed trading decisions based on the analysis.
Real-World Application
Through practical examples and case studies in his classes, Professor Bierman demonstrates how these strategies can be applied in real trading scenarios.
Advanced Techniques in Price Pattern Recognition
Beyond the Basics
Professor Bierman also covers more complex patterns and scenarios, including false breakouts and the psychology behind price movements, providing a more nuanced understanding of market dynamics.
Integrating Multiple Analysis Tools
Combining price patterns with other forms of technical analysis creates a robust trading strategy that can adapt to various market conditions.
Conclusion
Chart reading is an invaluable skill in the trading world, and Professor Jeff Bierman’s class on classic price pattern recognition offers a foundational gateway into mastering this skill. By understanding and applying the techniques discussed, traders can enhance their ability to make strategic decisions based on comprehensive market analysis.
FAQs
1. How important is chart type selection in trading?
Chart type selection is crucial as it determines the clarity and type of information available for making trading decisions.
2. Can price patterns predict market movements accurately?
While not infallible, price patterns provide significant insights and are widely used as predictive tools in trading.
3. How does Professor Bierman suggest using volume in trading?
Professor Bierman recommends using volume as a confirmation tool to ensure the strength of price movements and patterns.
4. Are technical indicators necessary for recognizing price patterns?
While not necessary, technical indicators greatly enhance the reliability of pattern recognition and trading decisions.
5. What’s the first step for a novice trader in learning chart reading?
The first step is understanding different chart types and beginning to recognize basic price patterns.
Be the first to review “How Do You Read Charts? A Guide to Classic Price Pattern Recognition Class with Professor Jeff Bierman”
You must be logged in to post a review.
Related products

Forex Trading
Original price was: $999.00.$15.00Current price is: $15.00.

Forex Trading
Original price was: $2,995.00.$31.00Current price is: $31.00.
Forex Trading
Original price was: $239.00.$8.00Current price is: $8.00.

Original price was: $450.00.$23.00Current price is: $23.00.
Original price was: $310.00.$23.00Current price is: $23.00.

Forex Trading
Original price was: $4,997.00.$27.00Current price is: $27.00.

Forex Trading
Original price was: $125.00.$17.00Current price is: $17.00.
Forex Trading
The Complete Guide to Multiple Time Frame Analysis & Reading Price Action with Aiman Almansoori
Original price was: $1,399.00.$13.00Current price is: $13.00.
Forex Trading
Original price was: $1,098.00.$39.00Current price is: $39.00.

Forex Trading
Original price was: $249.00.$15.00Current price is: $15.00.
Forex Trading
Original price was: $500.00.$5.00Current price is: $5.00.
Original price was: $497.00.$31.00Current price is: $31.00.

Original price was: $139.00.$23.00Current price is: $23.00.

Forex Trading
Original price was: $697.00.$5.00Current price is: $5.00.
Original price was: $1,200.00.$23.00Current price is: $23.00.
Original price was: $700.00.$39.00Current price is: $39.00.

Original price was: $997.00.$13.00Current price is: $13.00.
Original price was: $4,995.00.$15.00Current price is: $15.00.
Original price was: $649.00.$20.00Current price is: $20.00.
Forex Trading
Original price was: $550.00.$5.00Current price is: $5.00.

Reviews
There are no reviews yet.