-
×
 TradeCraft: Your Path to Peak Performance Trading By Adam Grimes
1 × $15.00
TradeCraft: Your Path to Peak Performance Trading By Adam Grimes
1 × $15.00 -
×
 Fibonacci for the Active Trader with Derrik Hobbs
1 × $6.00
Fibonacci for the Active Trader with Derrik Hobbs
1 × $6.00 -
×
 Mastertrader – Mastering Swing Trading
1 × $31.00
Mastertrader – Mastering Swing Trading
1 × $31.00 -
×
 Hedge Fund Market Wizards: How Winning Traders Win with Jack Schwager
1 × $6.00
Hedge Fund Market Wizards: How Winning Traders Win with Jack Schwager
1 × $6.00 -
×
 Trading For Busy People with Josias Kere
1 × $6.00
Trading For Busy People with Josias Kere
1 × $6.00 -
×
 Profit in the Futures Markets! with Jack Bernstein
1 × $6.00
Profit in the Futures Markets! with Jack Bernstein
1 × $6.00 -
×
 CAT 2007 Seminar with Stephen W.Bigalow
1 × $6.00
CAT 2007 Seminar with Stephen W.Bigalow
1 × $6.00 -
×
 How To Become StressFree Trader with Jason Starzec
1 × $4.00
How To Become StressFree Trader with Jason Starzec
1 × $4.00 -
×
 Hedged Strategy Series in Volatile Markets All 4 with Dan Sheridan
1 × $15.00
Hedged Strategy Series in Volatile Markets All 4 with Dan Sheridan
1 × $15.00 -
×
 THE ART OF ADJUSTING IN 2017
1 × $6.00
THE ART OF ADJUSTING IN 2017
1 × $6.00 -
×
 The Mathematics of Money Management. Risk Analysis Techniques for Traders
1 × $6.00
The Mathematics of Money Management. Risk Analysis Techniques for Traders
1 × $6.00 -
×
 Secrets of the Darvas Trading System
1 × $6.00
Secrets of the Darvas Trading System
1 × $6.00 -
×
 NASDAQ Level II Trading Strategies
1 × $6.00
NASDAQ Level II Trading Strategies
1 × $6.00 -
×
 Complete Day Trading Course with The Trading Floor
1 × $13.00
Complete Day Trading Course with The Trading Floor
1 × $13.00 -
×
 Behavior and Performance of Investment Newsletter Analysts (Article) with Alok Kumar
1 × $6.00
Behavior and Performance of Investment Newsletter Analysts (Article) with Alok Kumar
1 × $6.00 -
×
 Staying Alive in the Markets (Video & Manual) with Mark Cook
1 × $6.00
Staying Alive in the Markets (Video & Manual) with Mark Cook
1 × $6.00 -
×
 Fibonacci Ratios with Pattern Recognition - Larry Pesavento & Steven Shapiro
1 × $6.00
Fibonacci Ratios with Pattern Recognition - Larry Pesavento & Steven Shapiro
1 × $6.00 -
×
 The Prop Trading Code with Brannigan Barrett - Axia Futures
1 × $23.00
The Prop Trading Code with Brannigan Barrett - Axia Futures
1 × $23.00 -
×
 How Do You Read Charts? A Guide to Classic Price Pattern Recognition Class with Professor Jeff Bierman
1 × $6.00
How Do You Read Charts? A Guide to Classic Price Pattern Recognition Class with Professor Jeff Bierman
1 × $6.00 -
×
 Defending Options with Simpler Options
1 × $6.00
Defending Options with Simpler Options
1 × $6.00 -
×
 The Adventures of the Cycle Hunter. The Cyclist with Craig Bttlc
1 × $6.00
The Adventures of the Cycle Hunter. The Cyclist with Craig Bttlc
1 × $6.00 -
×
 Storehouse Tutorial Group Videos
1 × $23.00
Storehouse Tutorial Group Videos
1 × $23.00 -
×
 FasTrack Premium with Note Conference
1 × $78.00
FasTrack Premium with Note Conference
1 × $78.00 -
×
 Mastering the Geometry of Market Energy with Charles Drummond
1 × $6.00
Mastering the Geometry of Market Energy with Charles Drummond
1 × $6.00 -
×
 A-Z Course with InvestiTrade Academy
1 × $5.00
A-Z Course with InvestiTrade Academy
1 × $5.00 -
×
 Advanced Trader with Nikos Trading Academy
1 × $5.00
Advanced Trader with Nikos Trading Academy
1 × $5.00 -
×
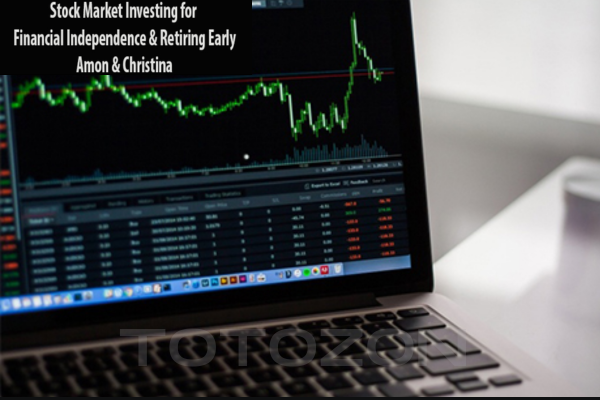 Stock Market Investing for Financial Independence & Retiring Early with Amon & Christina
1 × $15.00
Stock Market Investing for Financial Independence & Retiring Early with Amon & Christina
1 × $15.00 -
×
 Royal Exchange Forex with Jan Teslar
1 × $6.00
Royal Exchange Forex with Jan Teslar
1 × $6.00 -
×
 Four Dimensional Stock Market Structures & Cycles with Bradley Cowan
1 × $6.00
Four Dimensional Stock Market Structures & Cycles with Bradley Cowan
1 × $6.00 -
×
 How I Day Trade Course with Traderade
1 × $15.00
How I Day Trade Course with Traderade
1 × $15.00 -
×
 Steve Jobs. The Greatest Second Act in the History of Business with Young Simon
1 × $6.00
Steve Jobs. The Greatest Second Act in the History of Business with Young Simon
1 × $6.00 -
×
 Fast Track Course with Tradelikerocket
1 × $233.00
Fast Track Course with Tradelikerocket
1 × $233.00 -
×
 The Litle Book of Bulletproof Investing
1 × $6.00
The Litle Book of Bulletproof Investing
1 × $6.00 -
×
 Cash Flow Investing Course
1 × $20.00
Cash Flow Investing Course
1 × $20.00 -
×
 Risk Stop Loss and Position Size with Daryl Guppy
1 × $6.00
Risk Stop Loss and Position Size with Daryl Guppy
1 × $6.00 -
×
 How to Call the Top in a Stock (To the Penny!) and Earn 9-11% Annualized Cash Yields Doing It with Dan Ferris
1 × $6.00
How to Call the Top in a Stock (To the Penny!) and Earn 9-11% Annualized Cash Yields Doing It with Dan Ferris
1 × $6.00 -
×
 ICT Prodigy Trading Course – $650K in Payouts with Alex Solignani
1 × $15.00
ICT Prodigy Trading Course – $650K in Payouts with Alex Solignani
1 × $15.00 -
×
 High Probability Trading Using Elliott Wave And Fibonacci Analysis withVic Patel - Forex Training Group
1 × $10.00
High Probability Trading Using Elliott Wave And Fibonacci Analysis withVic Patel - Forex Training Group
1 × $10.00 -
×
 EFT – The Art of Delivery with Gary Craig
1 × $5.00
EFT – The Art of Delivery with Gary Craig
1 × $5.00 -
×
 Pattern Picking with Charles Drummond
1 × $6.00
Pattern Picking with Charles Drummond
1 × $6.00 -
×
 Creating the Optimal Trade for Explosive Profits with George A.Fontanills
1 × $6.00
Creating the Optimal Trade for Explosive Profits with George A.Fontanills
1 × $6.00 -
×
 Sea Lanes & Pipelines with Bernard D.Cole
1 × $6.00
Sea Lanes & Pipelines with Bernard D.Cole
1 × $6.00 -
×
 Tharp Think Essentials Video Workshop with Van Tharp
1 × $5.00
Tharp Think Essentials Video Workshop with Van Tharp
1 × $5.00 -
×
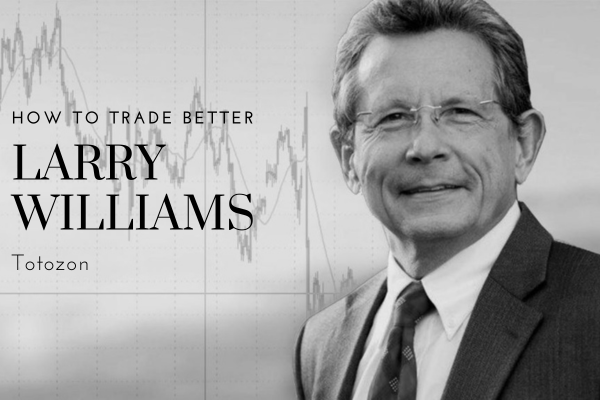 How to Trade Better with Larry Williams
1 × $6.00
How to Trade Better with Larry Williams
1 × $6.00 -
×
 Profitable Strategies with Gemify Academy
1 × $10.00
Profitable Strategies with Gemify Academy
1 × $10.00 -
×
 Generative AI for Asset Managers Workshop Recording with Ernest Chan
1 × $55.00
Generative AI for Asset Managers Workshop Recording with Ernest Chan
1 × $55.00 -
×
 Best of the Best: Collars with Amy Meissner & Scott Ruble
1 × $15.00
Best of the Best: Collars with Amy Meissner & Scott Ruble
1 × $15.00
How Do You Read Charts? A Guide to Classic Price Pattern Recognition Class with Professor Jeff Bierman
Original price was: $95.00.$6.00Current price is: $6.00.
File Size: 1.25 GB
Delivery Time: 1–12 hours
Media Type: Online Course
Content Proof: Watch Here!
You may check content proof of “How Do You Read Charts? A Guide to Classic Price Pattern Recognition Class with Professor Jeff Bierman” below:

How Do You Read Charts? A Guide to Classic Price Pattern Recognition Class with Professor Jeff Bierman
Introduction
In the world of trading and investment, chart reading is not just a skill—it’s an essential language. Professor Jeff Bierman, a renowned expert in technical analysis, has developed a comprehensive approach to understanding this language through classic price pattern recognition. Let’s dive into the fundamentals of chart reading as taught by Professor Bierman, and discover how you can turn these intricate patterns into actionable trading strategies.
Understanding Chart Types
What Are the Main Types of Charts?
- Line Charts: Simple and straightforward, showing the closing prices over time.
- Bar Charts: Provide more data such as opening, high, low, and closing prices.
- Candlestick Charts: Offer a detailed view of market psychology and can indicate potential reversals.
Why Chart Types Matter
Choosing the right chart type can enhance your ability to read and interpret market movements effectively. Each chart type provides different insights, which are crucial for making informed trading decisions.
The Basics of Price Patterns
Identifying Common Price Patterns
- Head and Shoulders: Indicative of a reversal in trend.
- Double Tops and Bottoms: Signal strength or weakness in a market.
- Triangles and Flags: Suggest continuation or breakout.
What These Patterns Tell Us
Price patterns are the language of the markets. By learning to recognize these patterns, traders can anticipate potential market movements and adjust their strategies accordingly.
Decoding Market Trends with Professor Bierman
The Role of Volume in Chart Analysis
Volume plays a pivotal role in confirming the strength of a price pattern. Professor Bierman emphasizes the importance of volume analysis as a fundamental aspect of chart interpretation.
How Volume Influences Price Movements
- High volume during a market breakout suggests a strong move.
- Low volume may indicate a lack of conviction or potential reversal.
Using Technical Indicators
Technical indicators such as moving averages, RSI (Relative Strength Index), and MACD (Moving Average Convergence Divergence) are tools that, when used alongside price patterns, can provide deeper insights into market trends.
Applying Price Pattern Recognition in Trading
Steps to Effective Chart Reading
- Identify the chart type and set an appropriate time frame.
- Recognize the prevailing price patterns.
- Analyze volume and apply technical indicators to confirm the pattern.
- Make informed trading decisions based on the analysis.
Real-World Application
Through practical examples and case studies in his classes, Professor Bierman demonstrates how these strategies can be applied in real trading scenarios.
Advanced Techniques in Price Pattern Recognition
Beyond the Basics
Professor Bierman also covers more complex patterns and scenarios, including false breakouts and the psychology behind price movements, providing a more nuanced understanding of market dynamics.
Integrating Multiple Analysis Tools
Combining price patterns with other forms of technical analysis creates a robust trading strategy that can adapt to various market conditions.
Conclusion
Chart reading is an invaluable skill in the trading world, and Professor Jeff Bierman’s class on classic price pattern recognition offers a foundational gateway into mastering this skill. By understanding and applying the techniques discussed, traders can enhance their ability to make strategic decisions based on comprehensive market analysis.
FAQs
1. How important is chart type selection in trading?
Chart type selection is crucial as it determines the clarity and type of information available for making trading decisions.
2. Can price patterns predict market movements accurately?
While not infallible, price patterns provide significant insights and are widely used as predictive tools in trading.
3. How does Professor Bierman suggest using volume in trading?
Professor Bierman recommends using volume as a confirmation tool to ensure the strength of price movements and patterns.
4. Are technical indicators necessary for recognizing price patterns?
While not necessary, technical indicators greatly enhance the reliability of pattern recognition and trading decisions.
5. What’s the first step for a novice trader in learning chart reading?
The first step is understanding different chart types and beginning to recognize basic price patterns.
Be the first to review “How Do You Read Charts? A Guide to Classic Price Pattern Recognition Class with Professor Jeff Bierman”
You must be logged in to post a review.
Related products

Forex Trading
Quantamentals – The Next Great Forefront Of Trading and Investing with Trading Markets
Original price was: $1,495.00.$8.00Current price is: $8.00.

Original price was: $997.00.$8.00Current price is: $8.00.

Original price was: $450.00.$23.00Current price is: $23.00.
Forex Trading
Original price was: $797.00.$10.00Current price is: $10.00.

Forex Trading
Original price was: $249.00.$15.00Current price is: $15.00.

Forex Trading
Original price was: $125.00.$17.00Current price is: $17.00.

Original price was: $700.00.$39.00Current price is: $39.00.
Original price was: $4,995.00.$15.00Current price is: $15.00.

Original price was: $649.00.$20.00Current price is: $20.00.

Forex Trading
Original price was: $697.00.$5.00Current price is: $5.00.

Original price was: $997.00.$13.00Current price is: $13.00.
Original price was: $2,120.00.$15.00Current price is: $15.00.

Original price was: $497.00.$31.00Current price is: $31.00.

Original price was: $497.00.$11.00Current price is: $11.00.

Forex Trading
Original price was: $4,997.00.$27.00Current price is: $27.00.

Original price was: $299.00.$8.00Current price is: $8.00.

Original price was: $895.00.$15.00Current price is: $15.00.

Forex Trading
Original price was: $499.00.$15.00Current price is: $15.00.
Forex Trading
Original price was: $1,898.00.$10.00Current price is: $10.00.

Original price was: $1,849.00.$15.00Current price is: $15.00.

Reviews
There are no reviews yet.