-
×
 Scalp Strategy and Flipping Small Accounts with Opes Trading Group
1 × $5.00
Scalp Strategy and Flipping Small Accounts with Opes Trading Group
1 × $5.00 -
×
 ADR Pro For Metatrader 4.0 with Compass FX
1 × $15.00
ADR Pro For Metatrader 4.0 with Compass FX
1 × $15.00 -
×
 4 Strategies That Will Make You a Professional Day Trader with Jerremy Newsome
1 × $6.00
4 Strategies That Will Make You a Professional Day Trader with Jerremy Newsome
1 × $6.00 -
×
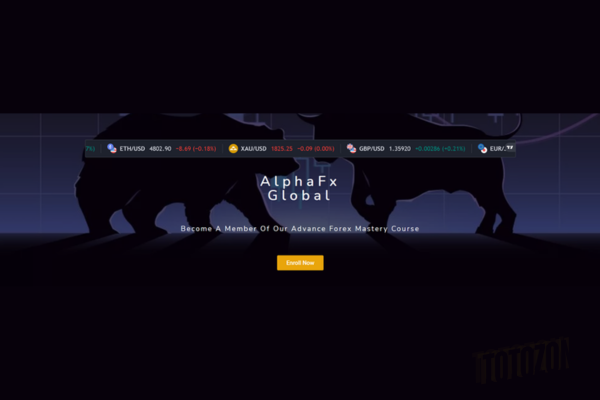 Advanced Forex Mastery Course with Alpha Forex Global
1 × $5.00
Advanced Forex Mastery Course with Alpha Forex Global
1 × $5.00 -
×
 The Best Option Trading Course with David Jaffee - Best Stock Strategy
1 × $15.00
The Best Option Trading Course with David Jaffee - Best Stock Strategy
1 × $15.00 -
×
 Futures Trading (German)
1 × $6.00
Futures Trading (German)
1 × $6.00 -
×
 Volume Profile 2023 (Elite Pack) with Trader Dale
1 × $5.00
Volume Profile 2023 (Elite Pack) with Trader Dale
1 × $5.00 -
×
 Algo Trading Masterclass with Ali Casey - StatOasis
1 × $23.00
Algo Trading Masterclass with Ali Casey - StatOasis
1 × $23.00 -
×
 FXStreet Unrecorded Webinars Sept & Oct, 2011 with Sam Seiden
1 × $6.00
FXStreet Unrecorded Webinars Sept & Oct, 2011 with Sam Seiden
1 × $6.00 -
×
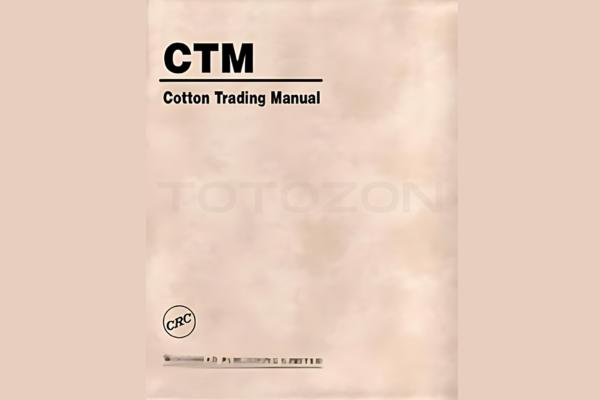 Cotton Trading Manual with Terry Townsend
1 × $6.00
Cotton Trading Manual with Terry Townsend
1 × $6.00 -
×
 AI For Traders with Trading Markets
1 × $31.00
AI For Traders with Trading Markets
1 × $31.00 -
×
 Bond Market Course with The Macro Compass
1 × $15.00
Bond Market Course with The Macro Compass
1 × $15.00 -
×
 Matrix Spread Options Trading Course with Base Camp Trading
1 × $31.00
Matrix Spread Options Trading Course with Base Camp Trading
1 × $31.00 -
×
 0 DTE Options Trading Workshop with Aeromir Corporation
1 × $15.00
0 DTE Options Trading Workshop with Aeromir Corporation
1 × $15.00 -
×
 JJ Dream Team Workshop Training Full Course
1 × $55.00
JJ Dream Team Workshop Training Full Course
1 × $55.00 -
×
 The A14 Weekly Option Strategy Workshop with Amy Meissner
1 × $23.00
The A14 Weekly Option Strategy Workshop with Amy Meissner
1 × $23.00 -
×
 High Probability Trading Using Elliott Wave And Fibonacci Analysis withVic Patel - Forex Training Group
1 × $10.00
High Probability Trading Using Elliott Wave And Fibonacci Analysis withVic Patel - Forex Training Group
1 × $10.00 -
×
 The Trading Blueprint with Brad Goh - The Trading Geek
1 × $5.00
The Trading Blueprint with Brad Goh - The Trading Geek
1 × $5.00 -
×
 Crystal Ball Pack PLUS bonus Live Trade By Pat Mitchell - Trick Trades
1 × $20.00
Crystal Ball Pack PLUS bonus Live Trade By Pat Mitchell - Trick Trades
1 × $20.00 -
×
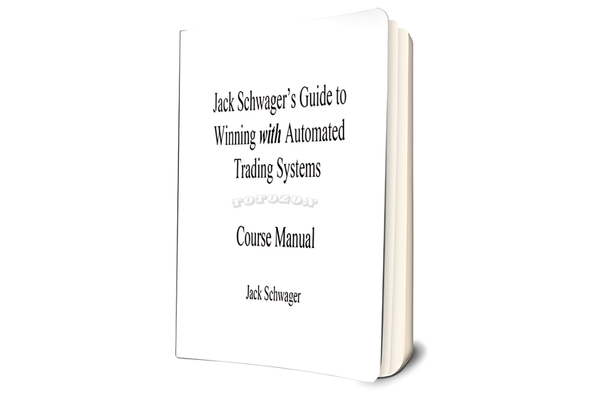 Guide to Winning with Automated Trading Systems with Jack Schwager
1 × $6.00
Guide to Winning with Automated Trading Systems with Jack Schwager
1 × $6.00 -
×
 Renko Profits Accelerator
1 × $15.00
Renko Profits Accelerator
1 × $15.00 -
×
 Day One Trader with John Sussex
1 × $6.00
Day One Trader with John Sussex
1 × $6.00 -
×
 All Candlestick Patterns Tested And Ranked with Quantified Strategies
1 × $8.00
All Candlestick Patterns Tested And Ranked with Quantified Strategies
1 × $8.00 -
×
 How To Read The Market Professionally with TradeSmart
1 × $27.00
How To Read The Market Professionally with TradeSmart
1 × $27.00 -
×
 The Nasdaq Investor with Max Isaacman
1 × $6.00
The Nasdaq Investor with Max Isaacman
1 × $6.00 -
×
 Butterfly and Condor Workshop with Aeromir
1 × $15.00
Butterfly and Condor Workshop with Aeromir
1 × $15.00 -
×
 MTA - Technically Speaking Newsletters
1 × $6.00
MTA - Technically Speaking Newsletters
1 × $6.00 -
×
 “The Beast” Automated Trading System V2 (Feb 2015)
1 × $15.00
“The Beast” Automated Trading System V2 (Feb 2015)
1 × $15.00 -
×
 The Complete Guide to Multiple Time Frame Analysis & Reading Price Action with Aiman Almansoori
1 × $13.00
The Complete Guide to Multiple Time Frame Analysis & Reading Price Action with Aiman Almansoori
1 × $13.00 -
×
 Best of the Best: Collars with Amy Meissner & Scott Ruble
1 × $15.00
Best of the Best: Collars with Amy Meissner & Scott Ruble
1 × $15.00

Pattern Recognition: A Fundamental Introduction to Japanese Candlestick Charting Techniques Class with Jeff Bierman
Original price was: $95.00.$6.00Current price is: $6.00.
File Size: 878 MB
Delivery Time: 1–12 hours
Media Type: Online Course
Content Proof: Watch Here!
You may check content proof of “Pattern Recognition: A Fundamental Introduction to Japanese Candlestick Charting Techniques Class with Jeff Bierman” below:

Pattern Recognition: A Fundamental Introduction to Japanese Candlestick Charting Techniques Class with Jeff Bierman
Introduction
Understanding the nuances of Japanese Candlestick charting is essential for any trader looking to gain deeper insights into market psychology and price movements. Jeff Bierman, an expert in technical analysis, provides a thorough introduction to this powerful charting technique that has stood the test of time. Let’s explore the foundational elements of candlestick charting and how it can be applied to enhance trading strategies.
What Are Japanese Candlesticks?
The Origin of Candlestick Charting
Originally developed in Japan over 300 years ago for rice trading, candlestick patterns have evolved into a crucial tool in the technical analyst’s toolkit, offering detailed information about market sentiment and potential price movements.
Understanding the Candlestick Structure
- The Body: Shows the open and close price.
- The Wicks: Indicate the high and low.
Color Significance in Candlesticks
- Green/White: Indicates a price increase.
- Red/Black: Indicates a price decrease.
Basic Candlestick Patterns
Single Candlestick Patterns
- Doji: Represents indecision in the market.
- Hammer: Suggests a potential bullish reversal.
- Shooting Star: Points to a potential bearish reversal.
Why Single Patterns Matter
These patterns provide immediate insights into daily market movements, offering clues about potential reversals or continuations.
Complex Candlestick Patterns
Multiple Candlestick Patterns
- Bullish Engulfing: Can signal a reversal from bearish to bullish.
- Bearish Engulfing: Might indicate a shift from bullish to bearish.
- Morning Star: A three-candle pattern suggesting a bullish reversal.
Understanding Pattern Combinations
Multiple patterns can provide a clearer picture of market trends and help traders make more informed decisions.
The Psychology Behind Candlestick Patterns
Market Emotions and Candlesticks
Candlestick patterns are deeply tied to investor psychology, reflecting the tug-of-war between buyers and sellers.
Interpreting Emotional Cues
Patterns like the Doji or Engulfing setups can indicate shifts in market sentiment that are crucial for anticipating future movements.
Integrating Candlesticks with Other Technical Tools
Combining Candlesticks with Technical Indicators
- RSI
- MACD
- Moving Averages
These tools can help confirm the signals provided by candlestick patterns, leading to more robust trading strategies.
Practical Application of Candlestick Techniques
Real-World Trading Scenarios
Professor Bierman emphasizes practical application through real-world examples, demonstrating how these patterns play out in live markets.
How to Practice Candlestick Analysis
- Simulated trading sessions.
- Historical chart analysis.
Advanced Techniques and Strategies
Beyond the Basics
Exploring the nuances of complex patterns and how they can predict market movements.
Strategic Integration
How to blend candlestick analysis with overall trading strategies for optimal performance.
Conclusion
Japanese candlestick charting techniques offer a dynamic and insightful way to view market trends. With Professor Jeff Bierman’s guidance, traders can master these techniques, enriching their trading toolkit and enhancing their decision-making processes.
FAQs
1. Why are Japanese candlesticks popular among traders?
They provide a visually intuitive method of understanding market dynamics and trader sentiment.
2. Can candlestick patterns be used for all types of trading?
Yes, candlestick patterns are versatile and can be applied across different markets, including forex, stocks, and commodities.
3. How reliable are candlestick patterns in predicting market movements?
While not foolproof, when combined with other technical analysis tools, candlestick patterns can significantly enhance prediction accuracy.
4. What should a beginner focus on when learning candlesticks?
Beginners should start with basic patterns and gradually explore more complex formations.
5. How does Jeff Bierman suggest traders refine their candlestick charting skills?
Through continuous practice and review of historical data to recognize patterns and their outcomes.
Be the first to review “Pattern Recognition: A Fundamental Introduction to Japanese Candlestick Charting Techniques Class with Jeff Bierman”
You must be logged in to post a review.
Related products

Original price was: $197.00.$5.00Current price is: $5.00.

Original price was: $695.00.$41.00Current price is: $41.00.

Forex Trading
Quantamentals – The Next Great Forefront Of Trading and Investing with Trading Markets
Original price was: $1,495.00.$8.00Current price is: $8.00.

Forex Trading
Original price was: $239.00.$8.00Current price is: $8.00.
Forex Trading
Original price was: $2,995.00.$31.00Current price is: $31.00.

Original price was: $139.00.$23.00Current price is: $23.00.

Forex Trading
Original price was: $500.00.$5.00Current price is: $5.00.

Forex Trading
Original price was: $1,098.00.$39.00Current price is: $39.00.

Forex Trading
Original price was: $2,997.00.$23.00Current price is: $23.00.

Forex Trading
Original price was: $125.00.$17.00Current price is: $17.00.

Original price was: $1,200.00.$23.00Current price is: $23.00.

Original price was: $997.00.$13.00Current price is: $13.00.

Original price was: $497.00.$11.00Current price is: $11.00.

Original price was: $997.00.$8.00Current price is: $8.00.

Original price was: $700.00.$39.00Current price is: $39.00.
Forex Trading
Original price was: $799.00.$15.00Current price is: $15.00.
Forex Trading
Original price was: $4,997.00.$27.00Current price is: $27.00.

Forex Trading
Original price was: $249.00.$15.00Current price is: $15.00.
Original price was: $999.00.$5.00Current price is: $5.00.
Forex Trading
Original price was: $1,898.00.$10.00Current price is: $10.00.
Reviews
There are no reviews yet.