-
×
 Butterfly and Condor Workshop with Aeromir
1 × $15.00
Butterfly and Condor Workshop with Aeromir
1 × $15.00 -
×
 W. D Gann 's Square Of 9 Applied To Modern Markets with Sean Avidar - Hexatrade350
1 × $23.00
W. D Gann 's Square Of 9 Applied To Modern Markets with Sean Avidar - Hexatrade350
1 × $23.00 -
×
 The A14 Weekly Option Strategy Workshop with Amy Meissner
1 × $23.00
The A14 Weekly Option Strategy Workshop with Amy Meissner
1 × $23.00 -
×
 Trading Ist Ein Geschaft (German) (tradingeducators.com)
1 × $6.00
Trading Ist Ein Geschaft (German) (tradingeducators.com)
1 × $6.00 -
×
 Order flow self-study training program with iMFtracker
1 × $10.00
Order flow self-study training program with iMFtracker
1 × $10.00 -
×
 High Probability Trading Using Elliott Wave And Fibonacci Analysis withVic Patel - Forex Training Group
1 × $10.00
High Probability Trading Using Elliott Wave And Fibonacci Analysis withVic Patel - Forex Training Group
1 × $10.00 -
×
 Compass Trading System with Right Line Trading
1 × $39.00
Compass Trading System with Right Line Trading
1 × $39.00 -
×
 Matrix Spread Options Trading Course with Base Camp Trading
1 × $31.00
Matrix Spread Options Trading Course with Base Camp Trading
1 × $31.00 -
×
 Algo Trading Masterclass with Ali Casey - StatOasis
1 × $23.00
Algo Trading Masterclass with Ali Casey - StatOasis
1 × $23.00 -
×
 The Orderflow Masterclass with PrimeTrading
1 × $17.00
The Orderflow Masterclass with PrimeTrading
1 × $17.00 -
×
 TradeCraft: Your Path to Peak Performance Trading By Adam Grimes
1 × $15.00
TradeCraft: Your Path to Peak Performance Trading By Adam Grimes
1 × $15.00 -
×
 Best of the Best: Collars with Amy Meissner & Scott Ruble
1 × $15.00
Best of the Best: Collars with Amy Meissner & Scott Ruble
1 × $15.00 -
×
 Trampoline Trading with Claytrader
1 × $6.00
Trampoline Trading with Claytrader
1 × $6.00 -
×
 0 DTE Options Trading Workshop with Aeromir Corporation
1 × $15.00
0 DTE Options Trading Workshop with Aeromir Corporation
1 × $15.00 -
×
 True Momentum System Basic Package with Sam Shames
1 × $13.00
True Momentum System Basic Package with Sam Shames
1 × $13.00 -
×
 White Phoenix’s The Smart (Money) Approach to Trading with Jayson Casper
1 × $39.00
White Phoenix’s The Smart (Money) Approach to Trading with Jayson Casper
1 × $39.00 -
×
 Crypto Trading Academy with Cheeky Investor - Aussie Day Trader
1 × $13.00
Crypto Trading Academy with Cheeky Investor - Aussie Day Trader
1 × $13.00 -
×
 The Prop Trading Code with Brannigan Barrett - Axia Futures
1 × $23.00
The Prop Trading Code with Brannigan Barrett - Axia Futures
1 × $23.00 -
×
 Advanced Spread Trading with Guy Bower - MasterClass Trader
1 × $15.00
Advanced Spread Trading with Guy Bower - MasterClass Trader
1 × $15.00 -
×
 SQX Mentorship with Tip Toe Hippo
1 × $23.00
SQX Mentorship with Tip Toe Hippo
1 × $23.00 -
×
 Wheels of Gann. Top Secret Forecast Guide with Pat Reda
1 × $6.00
Wheels of Gann. Top Secret Forecast Guide with Pat Reda
1 × $6.00 -
×
 Scalp Strategy and Flipping Small Accounts with Opes Trading Group
1 × $5.00
Scalp Strategy and Flipping Small Accounts with Opes Trading Group
1 × $5.00 -
×
 Trading Short TermSame Day Trades Sep 2023 with Dan Sheridan & Mark Fenton - Sheridan Options Mentoring
1 × $31.00
Trading Short TermSame Day Trades Sep 2023 with Dan Sheridan & Mark Fenton - Sheridan Options Mentoring
1 × $31.00 -
×
 TTW TradeFinder and Bookmap Course with Trading To Win
1 × $10.00
TTW TradeFinder and Bookmap Course with Trading To Win
1 × $10.00 -
×
 Home Run Options Trading Course with Dave Aquino - Base Camp Trading
1 × $11.00
Home Run Options Trading Course with Dave Aquino - Base Camp Trading
1 × $11.00 -
×
 Essentials in Quantitative Trading QT01 By HangukQuant's
1 × $23.00
Essentials in Quantitative Trading QT01 By HangukQuant's
1 × $23.00 -
×
 Advanced Seminar
1 × $31.00
Advanced Seminar
1 × $31.00 -
×
 TRADING NFX Course with Andrew NFX
1 × $5.00
TRADING NFX Course with Andrew NFX
1 × $5.00 -
×
 $20 – 52k 20 pips a day challange with Rafał Zuchowicz - TopMasterTrader
1 × $5.00
$20 – 52k 20 pips a day challange with Rafał Zuchowicz - TopMasterTrader
1 × $5.00 -
×
 WondaFX Signature Strategy with WondaFX
1 × $5.00
WondaFX Signature Strategy with WondaFX
1 × $5.00 -
×
 Quantamentals - The Next Great Forefront Of Trading and Investing with Trading Markets
1 × $8.00
Quantamentals - The Next Great Forefront Of Trading and Investing with Trading Markets
1 × $8.00 -
×
 Bond Market Course with The Macro Compass
1 × $15.00
Bond Market Course with The Macro Compass
1 × $15.00 -
×
 The Best Option Trading Course with David Jaffee - Best Stock Strategy
1 × $15.00
The Best Option Trading Course with David Jaffee - Best Stock Strategy
1 × $15.00 -
×
 The Naked Eye: Raw Data Analytics with Edgar Torres - Raw Data Analytics
1 × $8.00
The Naked Eye: Raw Data Analytics with Edgar Torres - Raw Data Analytics
1 × $8.00 -
×
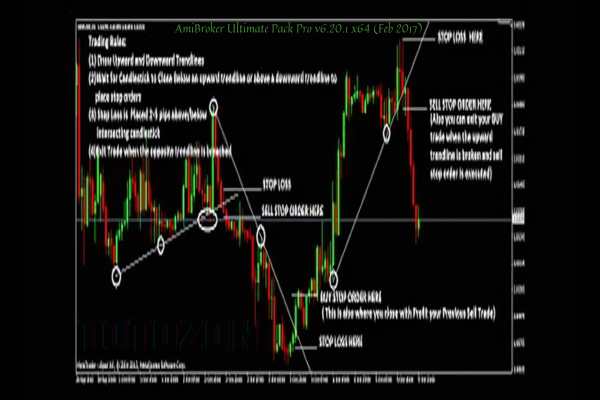 AmiBroker Ultimate Pack Pro v6.20.1 x64 (Feb 2017)
1 × $6.00
AmiBroker Ultimate Pack Pro v6.20.1 x64 (Feb 2017)
1 × $6.00 -
×
 The Orderflows Trade Opportunities Encyclopedia with Michael Valtos
1 × $8.00
The Orderflows Trade Opportunities Encyclopedia with Michael Valtos
1 × $8.00 -
×
 The Trading Blueprint with Brad Goh - The Trading Geek
1 × $5.00
The Trading Blueprint with Brad Goh - The Trading Geek
1 × $5.00 -
×
 Winning with Options with Michael Thomsett
1 × $6.00
Winning with Options with Michael Thomsett
1 × $6.00 -
×
 10-Week Stock Trading Program with Stock Market Lab
1 × $6.00
10-Week Stock Trading Program with Stock Market Lab
1 × $6.00 -
×
 TradeGuider Education Package
1 × $54.00
TradeGuider Education Package
1 × $54.00 -
×
 Forex and Stocks Trading Course - Set and Forget with Alfonso Moreno
1 × $6.00
Forex and Stocks Trading Course - Set and Forget with Alfonso Moreno
1 × $6.00 -
×
 Options Trading & Ultimate MasterClass With Tyrone Abela - FX Evolution
1 × $54.00
Options Trading & Ultimate MasterClass With Tyrone Abela - FX Evolution
1 × $54.00 -
×
 2014 Advanced Swing Trading Summit
1 × $31.00
2014 Advanced Swing Trading Summit
1 × $31.00 -
×
 TTM Directional Day Filter System for TS
1 × $6.00
TTM Directional Day Filter System for TS
1 × $6.00 -
×
 BOSSPack Course with Pat Mitchell – Trick Trades
1 × $69.00
BOSSPack Course with Pat Mitchell – Trick Trades
1 × $69.00 -
×
 Deep Dive Butterfly Trading Strategy Class with SJG Trades
1 × $41.00
Deep Dive Butterfly Trading Strategy Class with SJG Trades
1 × $41.00 -
×
 How To Read The Market Professionally with TradeSmart
1 × $27.00
How To Read The Market Professionally with TradeSmart
1 × $27.00 -
×
 2 Day Personal Training Course (Seminar Package) with Martin Pring
1 × $6.00
2 Day Personal Training Course (Seminar Package) with Martin Pring
1 × $6.00 -
×
 The Complete Guide to Multiple Time Frame Analysis & Reading Price Action with Aiman Almansoori
1 × $13.00
The Complete Guide to Multiple Time Frame Analysis & Reading Price Action with Aiman Almansoori
1 × $13.00 -
×
 Applications of Abstract Algebra with Maple - Richard E.Kline, Neil Sigmon, Ernst Stitzinger
1 × $6.00
Applications of Abstract Algebra with Maple - Richard E.Kline, Neil Sigmon, Ernst Stitzinger
1 × $6.00 -
×
 Tunnel Through the Air (1994 Conference of Astro-Timing Techniques) with Bonnie Lee Hill
1 × $4.00
Tunnel Through the Air (1994 Conference of Astro-Timing Techniques) with Bonnie Lee Hill
1 × $4.00 -
×
 14-Day Options Trading Bootcamp (Jule 2014)
1 × $15.00
14-Day Options Trading Bootcamp (Jule 2014)
1 × $15.00 -
×
 Forecast 2024 Clarification with Larry Williams
1 × $15.00
Forecast 2024 Clarification with Larry Williams
1 × $15.00 -
×
 21 Candlesticks Every Trader Should Know with Melvin Pasternak
1 × $5.00
21 Candlesticks Every Trader Should Know with Melvin Pasternak
1 × $5.00 -
×
 AI For Traders with Trading Markets
1 × $31.00
AI For Traders with Trading Markets
1 × $31.00 -
×
 ”Trading With The Generals 2003-2004” Training Course with Kevin Haggerty
1 × $6.00
”Trading With The Generals 2003-2004” Training Course with Kevin Haggerty
1 × $6.00 -
×
 Advanced Daytrading Seminar with Ken Calhoun
1 × $155.00
Advanced Daytrading Seminar with Ken Calhoun
1 × $155.00 -
×
 Day Trading Systems & Methods with Charles Le Beau, David Lucas
1 × $6.00
Day Trading Systems & Methods with Charles Le Beau, David Lucas
1 × $6.00 -
×
 Advanced Technical Analysis PART2 with Corey Halliday
1 × $6.00
Advanced Technical Analysis PART2 with Corey Halliday
1 × $6.00 -
×
 Sovereign Man Confidential
1 × $6.00
Sovereign Man Confidential
1 × $6.00 -
×
 Uncover Resilient Stocks in Today’s Market with Peter Worden
1 × $6.00
Uncover Resilient Stocks in Today’s Market with Peter Worden
1 × $6.00 -
×
 Advanced Symmetrics Mental Harmonics Course
1 × $15.00
Advanced Symmetrics Mental Harmonics Course
1 × $15.00

Trading Aplications of Japanese Candlestick Charting with Gary S.Wagner & Bradley L.Matheny
$6.00
File Size: Coming soon!
Delivery Time: 1–12 hours
Media Type: Online Course
Content Proof: Watch Here!
You may check content proof of “Trading Aplications of Japanese Candlestick Charting with Gary S.Wagner & Bradley L.Matheny” below:

Trading Applications of Japanese Candlestick Charting with Gary S. Wagner & Bradley L. Matheny
Japanese candlestick charting is a powerful tool that provides traders with visual insights into market sentiment and potential price movements. Gary S. Wagner and Bradley L. Matheny are experts in this field, offering valuable techniques and strategies to maximize the benefits of candlestick charting. This article will explore the practical applications of Japanese candlestick charting and how traders can leverage these methods for successful trading.
Introduction to Japanese Candlestick Charting
What Are Japanese Candlestick Charts?
Japanese candlestick charts are a type of financial chart that graphically displays price movements over time. Each “candlestick” represents one period of trading and provides information on the opening, closing, high, and low prices.
Who Are Gary S. Wagner & Bradley L. Matheny?
Gary S. Wagner and Bradley L. Matheny are renowned technical analysts and authors known for their expertise in Japanese candlestick charting. Their insights and strategies have helped countless traders understand and utilize this powerful charting method.
Components of a Candlestick
The Body
Bullish vs. Bearish Candles
The body of a candlestick represents the range between the opening and closing prices. A bullish candle indicates that the closing price is higher than the opening price, while a bearish candle shows that the closing price is lower.
The Wicks
Upper and Lower Shadows
The wicks, or shadows, represent the highest and lowest prices during the trading period. The upper shadow extends from the top of the body to the high, and the lower shadow extends from the bottom of the body to the low.
Color and Patterns
Common Colors
Typically, a bullish candle is green or white, and a bearish candle is red or black, helping traders quickly identify market trends.
Basic Candlestick Patterns
Single Candlestick Patterns
Doji
A doji forms when the opening and closing prices are nearly the same, indicating market indecision.
Hammer
A hammer has a small body and a long lower shadow, suggesting a potential reversal from a downtrend.
Multiple Candlestick Patterns
Bullish Engulfing
A bullish engulfing pattern occurs when a small bearish candle is followed by a larger bullish candle, indicating a potential upward reversal.
Bearish Harami
A bearish harami consists of a large bullish candle followed by a smaller bearish candle within the body of the first, signaling potential market reversals.
Advanced Candlestick Patterns
Morning Star
Pattern Description
A morning star is a three-candle pattern that indicates a potential bullish reversal. It consists of a long bearish candle, a small-bodied candle (star), and a long bullish candle.
Significance
This pattern suggests that the selling pressure is diminishing, and a new buying trend may be starting.
Evening Star
Pattern Description
An evening star is the opposite of a morning star and indicates a potential bearish reversal. It consists of a long bullish candle, a small-bodied candle, and a long bearish candle.
Significance
This pattern suggests that the buying pressure is diminishing, and a new selling trend may be starting.
Practical Applications in Trading
Identifying Trends
Uptrends and Downtrends
Candlestick charts help traders identify trends. An uptrend is characterized by a series of bullish candles, while a downtrend consists of bearish candles.
Spotting Reversals
Key Reversal Patterns
Patterns like doji, hammer, and engulfing patterns can signal potential market reversals, helping traders make timely decisions.
Supporting Indicators
Moving Averages
Combining candlestick patterns with moving averages can provide more accurate trading signals.
Relative Strength Index (RSI)
Using RSI alongside candlestick charts helps confirm overbought or oversold conditions.
Developing a Trading Strategy
Step-by-Step Guide
Step 1: Analyze Candlestick Patterns
Identify key candlestick patterns on your chart to understand potential price movements.
Step 2: Confirm with Indicators
Use supporting indicators like moving averages and RSI to confirm your analysis.
Step 3: Set Entry and Exit Points
Determine your entry and exit points based on identified patterns and confirmed signals.
Risk Management
Setting Stop-Loss Orders
Implement stop-loss orders to protect your trades from significant losses.
Position Sizing
Adjust your position size according to your risk tolerance and the specific trade setup.
Common Mistakes to Avoid
Overtrading
Avoiding Excessive Trades
Overtrading can lead to higher transaction costs and reduced profitability. Focus on quality trades rather than quantity.
Ignoring Confirmation
Importance of Confirmation
Relying solely on candlestick patterns without confirmation from other indicators can lead to false signals.
Tips for Success
Continuous Learning
Educational Resources
Continuously educate yourself on candlestick patterns and technical analysis to improve your trading skills.
Regular Practice
Paper Trading
Practice your strategies through paper trading to gain confidence and refine your techniques without risking real money.
Conclusion
Japanese candlestick charting offers a wealth of information that can enhance your trading strategy. By understanding and applying the insights shared by Gary S. Wagner and Bradley L. Matheny, traders can make more informed decisions and improve their trading performance. Whether you’re a novice or an experienced trader, mastering candlestick charts can provide a significant edge in the financial markets.
FAQs
1. What are the key components of a candlestick?
A candlestick has a body, which shows the range between the opening and closing prices, and wicks or shadows, which indicate the highest and lowest prices during the trading period.
2. How can candlestick patterns help identify market trends?
Candlestick patterns, such as uptrends and downtrends, help traders identify the overall direction of the market and potential reversal points.
3. Why is it important to confirm candlestick patterns with other indicators?
Confirming candlestick patterns with other indicators like moving averages and RSI reduces the risk of false signals and enhances the accuracy of trading decisions.
4. What are some common candlestick patterns to look for?
Common patterns include the doji, hammer, bullish engulfing, and harami, which can indicate market indecision, potential reversals, and trend continuations.
5. How can I manage risk when trading with candlestick charts?
Implement risk management strategies such as setting stop-loss orders and adjusting position sizes according to your risk tolerance and trading strategy.
Be the first to review “Trading Aplications of Japanese Candlestick Charting with Gary S.Wagner & Bradley L.Matheny”
You must be logged in to post a review.
Related products
Original price was: $497.00.$11.00Current price is: $11.00.

Original price was: $649.00.$20.00Current price is: $20.00.
Forex Trading
Original price was: $499.00.$15.00Current price is: $15.00.
Forex Trading
Original price was: $797.00.$10.00Current price is: $10.00.
Original price was: $1,200.00.$23.00Current price is: $23.00.
Original price was: $4,995.00.$15.00Current price is: $15.00.
Original price was: $999.00.$5.00Current price is: $5.00.
Original price was: $997.00.$8.00Current price is: $8.00.
Forex Trading
Original price was: $550.00.$5.00Current price is: $5.00.
Forex Trading
The Complete Guide to Multiple Time Frame Analysis & Reading Price Action with Aiman Almansoori
Original price was: $1,399.00.$13.00Current price is: $13.00.
Original price was: $1,800.00.$54.00Current price is: $54.00.
Forex Trading
Original price was: $2,995.00.$31.00Current price is: $31.00.
Forex Trading
Original price was: $397.00.$31.00Current price is: $31.00.
Original price was: $299.00.$8.00Current price is: $8.00.
Forex Trading
Original price was: $125.00.$17.00Current price is: $17.00.
Forex Trading
Original price was: $2,997.00.$23.00Current price is: $23.00.
Original price was: $700.00.$39.00Current price is: $39.00.
Forex Trading
Original price was: $850.00.$23.00Current price is: $23.00.
Forex Trading
Original price was: $799.00.$15.00Current price is: $15.00.
Original price was: $695.00.$41.00Current price is: $41.00.

Reviews
There are no reviews yet.