-
×
 W. D Gann 's Square Of 9 Applied To Modern Markets with Sean Avidar - Hexatrade350
1 × $23.00
W. D Gann 's Square Of 9 Applied To Modern Markets with Sean Avidar - Hexatrade350
1 × $23.00 -
×
 Ultra Blue Forex 2024 with Russ Horn
1 × $17.00
Ultra Blue Forex 2024 with Russ Horn
1 × $17.00 -
×
 A+ Setups Big Caps Options with Jtrader
1 × $6.00
A+ Setups Big Caps Options with Jtrader
1 × $6.00 -
×
 Compass Trading System with Right Line Trading
1 × $39.00
Compass Trading System with Right Line Trading
1 × $39.00 -
×
 Scalp Strategy and Flipping Small Accounts with Opes Trading Group
1 × $5.00
Scalp Strategy and Flipping Small Accounts with Opes Trading Group
1 × $5.00 -
×
 Advanced Spread Trading with Guy Bower - MasterClass Trader
1 × $15.00
Advanced Spread Trading with Guy Bower - MasterClass Trader
1 × $15.00 -
×
 Options Trading & Ultimate MasterClass With Tyrone Abela - FX Evolution
1 × $54.00
Options Trading & Ultimate MasterClass With Tyrone Abela - FX Evolution
1 × $54.00 -
×
 $20 – 52k 20 pips a day challange with Rafał Zuchowicz - TopMasterTrader
1 × $5.00
$20 – 52k 20 pips a day challange with Rafał Zuchowicz - TopMasterTrader
1 × $5.00 -
×
 Matrix Spread Options Trading Course with Base Camp Trading
1 × $31.00
Matrix Spread Options Trading Course with Base Camp Trading
1 × $31.00 -
×
 Building Winning Trading Systems with Tradestation (with CD) - George Pruitt
1 × $6.00
Building Winning Trading Systems with Tradestation (with CD) - George Pruitt
1 × $6.00 -
×
 The Trading Blueprint with Brad Goh - The Trading Geek
1 × $5.00
The Trading Blueprint with Brad Goh - The Trading Geek
1 × $5.00 -
×
 Bond Market Course with The Macro Compass
1 × $15.00
Bond Market Course with The Macro Compass
1 × $15.00 -
×
 Vertex Investing Course (2023)
1 × $8.00
Vertex Investing Course (2023)
1 × $8.00 -
×
 Zap Seminar - David Stendahl – Day Trading the E-Minis
1 × $6.00
Zap Seminar - David Stendahl – Day Trading the E-Minis
1 × $6.00 -
×
 Algo Trading Masterclass with Ali Casey - StatOasis
1 × $23.00
Algo Trading Masterclass with Ali Casey - StatOasis
1 × $23.00 -
×
 Train & Trade Academy with Omar Agag
1 × $5.00
Train & Trade Academy with Omar Agag
1 × $5.00 -
×
 TRADING NFX Course with Andrew NFX
1 × $5.00
TRADING NFX Course with Andrew NFX
1 × $5.00 -
×
 Crypto Trading Academy with Cheeky Investor - Aussie Day Trader
1 × $13.00
Crypto Trading Academy with Cheeky Investor - Aussie Day Trader
1 × $13.00 -
×
 Calendar Spreads with Todd Mitchell
1 × $31.00
Calendar Spreads with Todd Mitchell
1 × $31.00 -
×
 SQX Mentorship with Tip Toe Hippo
1 × $23.00
SQX Mentorship with Tip Toe Hippo
1 × $23.00 -
×
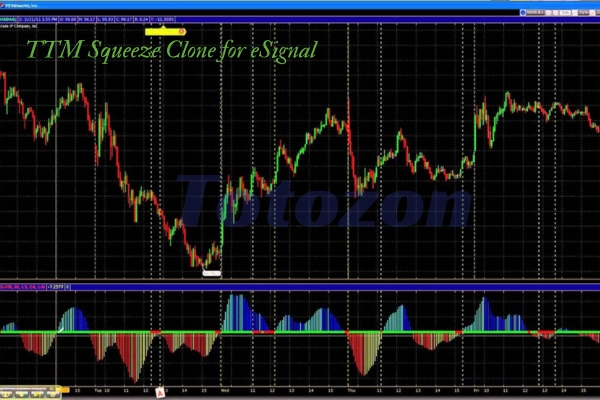 TTM Squeeze Clone for eSignal
1 × $6.00
TTM Squeeze Clone for eSignal
1 × $6.00 -
×
 0 DTE Options Trading Workshop with Aeromir Corporation
1 × $15.00
0 DTE Options Trading Workshop with Aeromir Corporation
1 × $15.00 -
×
 Ultimate Trading Course with Dodgy's Dungeon
1 × $8.00
Ultimate Trading Course with Dodgy's Dungeon
1 × $8.00 -
×
 TOP Momentum Bundle with Top Trade Tools
1 × $62.00
TOP Momentum Bundle with Top Trade Tools
1 × $62.00 -
×
 Butterfly and Condor Workshop with Aeromir
1 × $15.00
Butterfly and Condor Workshop with Aeromir
1 × $15.00 -
×
 The A14 Weekly Option Strategy Workshop with Amy Meissner
1 × $23.00
The A14 Weekly Option Strategy Workshop with Amy Meissner
1 × $23.00 -
×
 WondaFX Signature Strategy with WondaFX
1 × $5.00
WondaFX Signature Strategy with WondaFX
1 × $5.00 -
×
 Value Investing King of Trading Methods in the Commodity Markets - Hal Masover
1 × $6.00
Value Investing King of Trading Methods in the Commodity Markets - Hal Masover
1 × $6.00 -
×
 7 Steps to Success Trading Options Online with Larry Spears
1 × $4.00
7 Steps to Success Trading Options Online with Larry Spears
1 × $4.00 -
×
 Advanced Pattern Recognition with John Cameron
1 × $23.00
Advanced Pattern Recognition with John Cameron
1 × $23.00 -
×
 How To Read The Market Professionally with TradeSmart
1 × $27.00
How To Read The Market Professionally with TradeSmart
1 × $27.00 -
×
 The Prop Trading Code with Brannigan Barrett - Axia Futures
1 × $23.00
The Prop Trading Code with Brannigan Barrett - Axia Futures
1 × $23.00 -
×
 The Orderflow Masterclass with PrimeTrading
1 × $17.00
The Orderflow Masterclass with PrimeTrading
1 × $17.00 -
×
 The Naked Eye: Raw Data Analytics with Edgar Torres - Raw Data Analytics
1 × $8.00
The Naked Eye: Raw Data Analytics with Edgar Torres - Raw Data Analytics
1 × $8.00 -
×
 Trading Short TermSame Day Trades Sep 2023 with Dan Sheridan & Mark Fenton - Sheridan Options Mentoring
1 × $31.00
Trading Short TermSame Day Trades Sep 2023 with Dan Sheridan & Mark Fenton - Sheridan Options Mentoring
1 × $31.00 -
×
 White Phoenix’s The Smart (Money) Approach to Trading with Jayson Casper
1 × $39.00
White Phoenix’s The Smart (Money) Approach to Trading with Jayson Casper
1 × $39.00 -
×
 Home Run Options Trading Course with Dave Aquino - Base Camp Trading
1 × $11.00
Home Run Options Trading Course with Dave Aquino - Base Camp Trading
1 × $11.00 -
×
 Zen8 Forex Hedging Program with Hugh Kimura - Trading Heroes
1 × $5.00
Zen8 Forex Hedging Program with Hugh Kimura - Trading Heroes
1 × $5.00 -
×
 Trading Connors VIX Reversals Tradestation Files with Laurence A. Connors & Gregory J. Che
1 × $6.00
Trading Connors VIX Reversals Tradestation Files with Laurence A. Connors & Gregory J. Che
1 × $6.00 -
×
 Activedaytrader - Workshop Options For Income
1 × $15.00
Activedaytrader - Workshop Options For Income
1 × $15.00 -
×
 10 Best Swing Trading Patterns & Strategies with Dave Landry
1 × $4.00
10 Best Swing Trading Patterns & Strategies with Dave Landry
1 × $4.00 -
×
 Video On Demand Pathway with Trade With Profile
1 × $5.00
Video On Demand Pathway with Trade With Profile
1 × $5.00 -
×
 Crystal Ball Pack PLUS bonus Live Trade By Pat Mitchell - Trick Trades
1 × $20.00
Crystal Ball Pack PLUS bonus Live Trade By Pat Mitchell - Trick Trades
1 × $20.00 -
×
 Forecast 2024 Clarification with Larry Williams
1 × $15.00
Forecast 2024 Clarification with Larry Williams
1 × $15.00 -
×
 Acclimation Course with Base Camp Trading
1 × $10.00
Acclimation Course with Base Camp Trading
1 × $10.00 -
×
 Advanced Strategy Design Techniques Bundle with NinjaTrader
1 × $20.00
Advanced Strategy Design Techniques Bundle with NinjaTrader
1 × $20.00 -
×
 Order flow self-study training program with iMFtracker
1 × $10.00
Order flow self-study training program with iMFtracker
1 × $10.00 -
×
 Trading Risk: Enhanced Profitability through Risk Control with Kenneth Grant
1 × $6.00
Trading Risk: Enhanced Profitability through Risk Control with Kenneth Grant
1 × $6.00 -
×
 WyseTrade Trading Masterclass Course
1 × $5.00
WyseTrade Trading Masterclass Course
1 × $5.00 -
×
 Advanced Course
1 × $39.00
Advanced Course
1 × $39.00 -
×
 Learn how to trade Volatility 75 Index Technical Analysis with Patrick Muke
1 × $6.00
Learn how to trade Volatility 75 Index Technical Analysis with Patrick Muke
1 × $6.00 -
×
 Advanced Symmetrics Mental Harmonics Course
1 × $15.00
Advanced Symmetrics Mental Harmonics Course
1 × $15.00 -
×
 Candlestick Trading Forum Trading Seminar with Stephen W.Bigalow
1 × $4.00
Candlestick Trading Forum Trading Seminar with Stephen W.Bigalow
1 × $4.00 -
×
 Practical Speculation with Victor Niederhoffer, Laurel Kenner
1 × $6.00
Practical Speculation with Victor Niederhoffer, Laurel Kenner
1 × $6.00 -
×
 Unlocking the Mysteries of Trend Analysis - Rick Bensignor
1 × $6.00
Unlocking the Mysteries of Trend Analysis - Rick Bensignor
1 × $6.00 -
×
 Boomer Quick Profits Day Trading Course
1 × $23.00
Boomer Quick Profits Day Trading Course
1 × $23.00 -
×
 Best of the Best: Collars with Amy Meissner & Scott Ruble
1 × $15.00
Best of the Best: Collars with Amy Meissner & Scott Ruble
1 × $15.00 -
×
 14-Day Options Trading Bootcamp (Jule 2014)
1 × $15.00
14-Day Options Trading Bootcamp (Jule 2014)
1 × $15.00 -
×
 Wave Trader Software 2004 with Bryce Gilmore
1 × $6.00
Wave Trader Software 2004 with Bryce Gilmore
1 × $6.00 -
×
 Virtual Intensive Trader Training
1 × $31.00
Virtual Intensive Trader Training
1 × $31.00 -
×
 Advanced Ichimoku Kinkō Hyō - Ichimoku Cloud Strategy with Rafał Zuchowicz - TopMasterTrader
1 × $17.00
Advanced Ichimoku Kinkō Hyō - Ichimoku Cloud Strategy with Rafał Zuchowicz - TopMasterTrader
1 × $17.00 -
×
 Trading System Building Blocks with John Hill
1 × $6.00
Trading System Building Blocks with John Hill
1 × $6.00 -
×
 TradeCraft: Your Path to Peak Performance Trading By Adam Grimes
1 × $15.00
TradeCraft: Your Path to Peak Performance Trading By Adam Grimes
1 × $15.00 -
×
 Wealth, War & Wisdom with Barton Biggs
1 × $6.00
Wealth, War & Wisdom with Barton Biggs
1 × $6.00 -
×
 BigTrends Home Study Course
1 × $6.00
BigTrends Home Study Course
1 × $6.00 -
×
 Beat the Market with Edward O.Thorp
1 × $6.00
Beat the Market with Edward O.Thorp
1 × $6.00 -
×
 Trading MasterMind Course
1 × $23.00
Trading MasterMind Course
1 × $23.00 -
×
 ETFs for the Long Run: What They Are, How They Work, and Simple Strategies for Successful Long-Term Investing - Lawrence Carrel
1 × $6.00
ETFs for the Long Run: What They Are, How They Work, and Simple Strategies for Successful Long-Term Investing - Lawrence Carrel
1 × $6.00 -
×
 The TradingKey Mastering Elliott Wave with Hubb Financial
1 × $6.00
The TradingKey Mastering Elliott Wave with Hubb Financial
1 × $6.00 -
×
 Ultimate Guide Technical Trading
1 × $23.00
Ultimate Guide Technical Trading
1 × $23.00 -
×
 Video Course with Trading Template
1 × $54.00
Video Course with Trading Template
1 × $54.00 -
×
 Bear Market Investing Strategies with Harry Schultz
1 × $6.00
Bear Market Investing Strategies with Harry Schultz
1 × $6.00 -
×
 ICT Prodigy Trading Course – $650K in Payouts with Alex Solignani
1 × $15.00
ICT Prodigy Trading Course – $650K in Payouts with Alex Solignani
1 × $15.00 -
×
 3 Day Bootcamp EXPERT LEVEL with FX Savages
1 × $6.00
3 Day Bootcamp EXPERT LEVEL with FX Savages
1 × $6.00 -
×
 AI For Traders with Trading Markets
1 × $31.00
AI For Traders with Trading Markets
1 × $31.00 -
×
 Trading Pairs: Capturing Profits and Hedging Risk with Statistical Arbitrage Strategies - Mark Whistler
1 × $6.00
Trading Pairs: Capturing Profits and Hedging Risk with Statistical Arbitrage Strategies - Mark Whistler
1 × $6.00 -
×
 The Indices Orderflow Masterclass with The Forex Scalpers
1 × $23.00
The Indices Orderflow Masterclass with The Forex Scalpers
1 × $23.00 -
×
 YTC Price Action Trader
1 × $6.00
YTC Price Action Trader
1 × $6.00 -
×
 Deep Dive Butterfly Trading Strategy Class with SJG Trades
1 × $41.00
Deep Dive Butterfly Trading Strategy Class with SJG Trades
1 × $41.00 -
×
 Amazing Day Trading Ninjatrader Indicator Perfect For Stocks, Futures And Forex
1 × $15.00
Amazing Day Trading Ninjatrader Indicator Perfect For Stocks, Futures And Forex
1 × $15.00 -
×
 Trading with Wave59 with Earik Beann
1 × $6.00
Trading with Wave59 with Earik Beann
1 × $6.00 -
×
 ZipTraderU 2023 with ZipTrader
1 × $5.00
ZipTraderU 2023 with ZipTrader
1 × $5.00 -
×
 Zap Seminar - Ablesys
1 × $6.00
Zap Seminar - Ablesys
1 × $6.00 -
×
 The Complete Guide to Multiple Time Frame Analysis & Reading Price Action with Aiman Almansoori
1 × $13.00
The Complete Guide to Multiple Time Frame Analysis & Reading Price Action with Aiman Almansoori
1 × $13.00 -
×
 Z4X Long Term Trading System
1 × $6.00
Z4X Long Term Trading System
1 × $6.00 -
×
 11 Paper with Charles Drummond
1 × $6.00
11 Paper with Charles Drummond
1 × $6.00 -
×
 Black Gold Strategies
1 × $23.00
Black Gold Strategies
1 × $23.00 -
×
 Analysis Of Entry Signals (Technicals) with Joe Marwood
1 × $15.00
Analysis Of Entry Signals (Technicals) with Joe Marwood
1 × $15.00 -
×
 Tradingriot Bootcamp + Blueprint 3.0
1 × $6.00
Tradingriot Bootcamp + Blueprint 3.0
1 × $6.00 -
×
 Trend Forecasting with Technical Analysis with Louis Mendelsohn & John Murphy
1 × $6.00
Trend Forecasting with Technical Analysis with Louis Mendelsohn & John Murphy
1 × $6.00 -
×
 Zulu Trading Method for the Soybeans with Joe Ross
1 × $6.00
Zulu Trading Method for the Soybeans with Joe Ross
1 × $6.00 -
×
 8 Successful Iron Condor Methodologies with Dan Sheridan
1 × $23.00
8 Successful Iron Condor Methodologies with Dan Sheridan
1 × $23.00 -
×
 Chicago Trading Workshop 2017 with Marketdelta
1 × $23.00
Chicago Trading Workshop 2017 with Marketdelta
1 × $23.00 -
×
 Bill Williams Package ( Discount 30% )
1 × $6.00
Bill Williams Package ( Discount 30% )
1 × $6.00 -
×
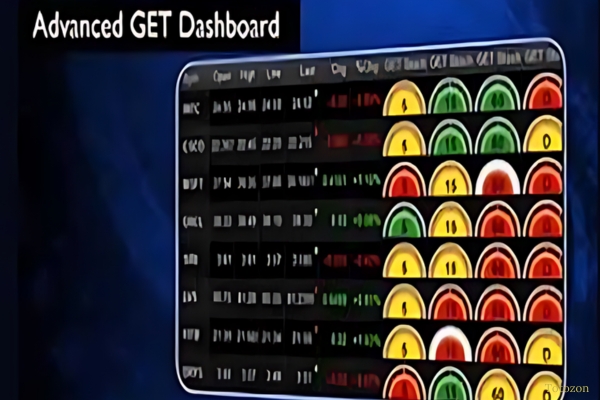 Advanced GET 8.0 EOD
1 × $6.00
Advanced GET 8.0 EOD
1 × $6.00 -
×
 Claytrader - Risk vs Reward Trading
1 × $23.00
Claytrader - Risk vs Reward Trading
1 × $23.00 -
×
 The Best Option Trading Course with David Jaffee - Best Stock Strategy
1 × $15.00
The Best Option Trading Course with David Jaffee - Best Stock Strategy
1 × $15.00 -
×
 The Orderflows Trade Opportunities Encyclopedia with Michael Valtos
1 × $8.00
The Orderflows Trade Opportunities Encyclopedia with Michael Valtos
1 × $8.00 -
×
 Winter 2016 Ignite Trading Conference (2016)
1 × $23.00
Winter 2016 Ignite Trading Conference (2016)
1 × $23.00 -
×
 Bobokus Training Program
1 × $6.00
Bobokus Training Program
1 × $6.00 -
×
 Tracking & Kalman Filtering Made Easy with Eli Brookner
1 × $6.00
Tracking & Kalman Filtering Made Easy with Eli Brookner
1 × $6.00 -
×
 Trading NQ At The US Open with TradeSmart
1 × $10.00
Trading NQ At The US Open with TradeSmart
1 × $10.00 -
×
 Best & Simple Forex day trading strategy with Forex day trading
1 × $5.00
Best & Simple Forex day trading strategy with Forex day trading
1 × $5.00 -
×
 Advanced Guide to How SimplerOptions Uses ThinkorSwim (274 Minutes) with Henry Gambell
1 × $15.00
Advanced Guide to How SimplerOptions Uses ThinkorSwim (274 Minutes) with Henry Gambell
1 × $15.00 -
×
 High Probability Trading Using Elliott Wave And Fibonacci Analysis withVic Patel - Forex Training Group
1 × $10.00
High Probability Trading Using Elliott Wave And Fibonacci Analysis withVic Patel - Forex Training Group
1 × $10.00 -
×
 60 Seconds Sure Shot Strategy with Albert E
1 × $6.00
60 Seconds Sure Shot Strategy with Albert E
1 × $6.00 -
×
 Tradacc – The Volume Profile Formula + Futures Masterclass and Rapid Setups Pack + S&P 500 Secrets Bundle - Aaron Korbs
1 × $5.00
Tradacc – The Volume Profile Formula + Futures Masterclass and Rapid Setups Pack + S&P 500 Secrets Bundle - Aaron Korbs
1 × $5.00 -
×
 Uncover Resilient Stocks in Today’s Market with Peter Worden
1 × $6.00
Uncover Resilient Stocks in Today’s Market with Peter Worden
1 × $6.00

Trading Aplications of Japanese Candlestick Charting with Gary S.Wagner & Bradley L.Matheny
$6.00
File Size: Coming soon!
Delivery Time: 1–12 hours
Media Type: Online Course
Content Proof: Watch Here!
You may check content proof of “Trading Aplications of Japanese Candlestick Charting with Gary S.Wagner & Bradley L.Matheny” below:

Trading Applications of Japanese Candlestick Charting with Gary S. Wagner & Bradley L. Matheny
Japanese candlestick charting is a powerful tool that provides traders with visual insights into market sentiment and potential price movements. Gary S. Wagner and Bradley L. Matheny are experts in this field, offering valuable techniques and strategies to maximize the benefits of candlestick charting. This article will explore the practical applications of Japanese candlestick charting and how traders can leverage these methods for successful trading.
Introduction to Japanese Candlestick Charting
What Are Japanese Candlestick Charts?
Japanese candlestick charts are a type of financial chart that graphically displays price movements over time. Each “candlestick” represents one period of trading and provides information on the opening, closing, high, and low prices.
Who Are Gary S. Wagner & Bradley L. Matheny?
Gary S. Wagner and Bradley L. Matheny are renowned technical analysts and authors known for their expertise in Japanese candlestick charting. Their insights and strategies have helped countless traders understand and utilize this powerful charting method.
Components of a Candlestick
The Body
Bullish vs. Bearish Candles
The body of a candlestick represents the range between the opening and closing prices. A bullish candle indicates that the closing price is higher than the opening price, while a bearish candle shows that the closing price is lower.
The Wicks
Upper and Lower Shadows
The wicks, or shadows, represent the highest and lowest prices during the trading period. The upper shadow extends from the top of the body to the high, and the lower shadow extends from the bottom of the body to the low.
Color and Patterns
Common Colors
Typically, a bullish candle is green or white, and a bearish candle is red or black, helping traders quickly identify market trends.
Basic Candlestick Patterns
Single Candlestick Patterns
Doji
A doji forms when the opening and closing prices are nearly the same, indicating market indecision.
Hammer
A hammer has a small body and a long lower shadow, suggesting a potential reversal from a downtrend.
Multiple Candlestick Patterns
Bullish Engulfing
A bullish engulfing pattern occurs when a small bearish candle is followed by a larger bullish candle, indicating a potential upward reversal.
Bearish Harami
A bearish harami consists of a large bullish candle followed by a smaller bearish candle within the body of the first, signaling potential market reversals.
Advanced Candlestick Patterns
Morning Star
Pattern Description
A morning star is a three-candle pattern that indicates a potential bullish reversal. It consists of a long bearish candle, a small-bodied candle (star), and a long bullish candle.
Significance
This pattern suggests that the selling pressure is diminishing, and a new buying trend may be starting.
Evening Star
Pattern Description
An evening star is the opposite of a morning star and indicates a potential bearish reversal. It consists of a long bullish candle, a small-bodied candle, and a long bearish candle.
Significance
This pattern suggests that the buying pressure is diminishing, and a new selling trend may be starting.
Practical Applications in Trading
Identifying Trends
Uptrends and Downtrends
Candlestick charts help traders identify trends. An uptrend is characterized by a series of bullish candles, while a downtrend consists of bearish candles.
Spotting Reversals
Key Reversal Patterns
Patterns like doji, hammer, and engulfing patterns can signal potential market reversals, helping traders make timely decisions.
Supporting Indicators
Moving Averages
Combining candlestick patterns with moving averages can provide more accurate trading signals.
Relative Strength Index (RSI)
Using RSI alongside candlestick charts helps confirm overbought or oversold conditions.
Developing a Trading Strategy
Step-by-Step Guide
Step 1: Analyze Candlestick Patterns
Identify key candlestick patterns on your chart to understand potential price movements.
Step 2: Confirm with Indicators
Use supporting indicators like moving averages and RSI to confirm your analysis.
Step 3: Set Entry and Exit Points
Determine your entry and exit points based on identified patterns and confirmed signals.
Risk Management
Setting Stop-Loss Orders
Implement stop-loss orders to protect your trades from significant losses.
Position Sizing
Adjust your position size according to your risk tolerance and the specific trade setup.
Common Mistakes to Avoid
Overtrading
Avoiding Excessive Trades
Overtrading can lead to higher transaction costs and reduced profitability. Focus on quality trades rather than quantity.
Ignoring Confirmation
Importance of Confirmation
Relying solely on candlestick patterns without confirmation from other indicators can lead to false signals.
Tips for Success
Continuous Learning
Educational Resources
Continuously educate yourself on candlestick patterns and technical analysis to improve your trading skills.
Regular Practice
Paper Trading
Practice your strategies through paper trading to gain confidence and refine your techniques without risking real money.
Conclusion
Japanese candlestick charting offers a wealth of information that can enhance your trading strategy. By understanding and applying the insights shared by Gary S. Wagner and Bradley L. Matheny, traders can make more informed decisions and improve their trading performance. Whether you’re a novice or an experienced trader, mastering candlestick charts can provide a significant edge in the financial markets.
FAQs
1. What are the key components of a candlestick?
A candlestick has a body, which shows the range between the opening and closing prices, and wicks or shadows, which indicate the highest and lowest prices during the trading period.
2. How can candlestick patterns help identify market trends?
Candlestick patterns, such as uptrends and downtrends, help traders identify the overall direction of the market and potential reversal points.
3. Why is it important to confirm candlestick patterns with other indicators?
Confirming candlestick patterns with other indicators like moving averages and RSI reduces the risk of false signals and enhances the accuracy of trading decisions.
4. What are some common candlestick patterns to look for?
Common patterns include the doji, hammer, bullish engulfing, and harami, which can indicate market indecision, potential reversals, and trend continuations.
5. How can I manage risk when trading with candlestick charts?
Implement risk management strategies such as setting stop-loss orders and adjusting position sizes according to your risk tolerance and trading strategy.
Be the first to review “Trading Aplications of Japanese Candlestick Charting with Gary S.Wagner & Bradley L.Matheny”
You must be logged in to post a review.
Related products
Forex Trading
Original price was: $249.00.$15.00Current price is: $15.00.
Forex Trading
Original price was: $1,898.00.$10.00Current price is: $10.00.
Forex Trading
Original price was: $2,000.00.$23.00Current price is: $23.00.
Original price was: $299.00.$8.00Current price is: $8.00.
Original price was: $895.00.$15.00Current price is: $15.00.
Forex Trading
Original price was: $500.00.$5.00Current price is: $5.00.
Forex Trading
Original price was: $550.00.$5.00Current price is: $5.00.
Original price was: $649.00.$20.00Current price is: $20.00.
Original price was: $799.00.$15.00Current price is: $15.00.
Original price was: $999.00.$5.00Current price is: $5.00.
Original price was: $1,800.00.$54.00Current price is: $54.00.
Original price was: $1,200.00.$23.00Current price is: $23.00.
Original price was: $139.00.$23.00Current price is: $23.00.
Forex Trading
Original price was: $499.00.$15.00Current price is: $15.00.
Original price was: $310.00.$23.00Current price is: $23.00.
Original price was: $695.00.$41.00Current price is: $41.00.

Forex Trading
Quantamentals – The Next Great Forefront Of Trading and Investing with Trading Markets
Original price was: $1,495.00.$8.00Current price is: $8.00.
Forex Trading
Original price was: $397.00.$31.00Current price is: $31.00.
Forex Trading
Original price was: $799.00.$15.00Current price is: $15.00.
Forex Trading
Original price was: $125.00.$17.00Current price is: $17.00.

Reviews
There are no reviews yet.