-
×
 Stochastic Calculus with Alan Bain
1 × $6.00
Stochastic Calculus with Alan Bain
1 × $6.00 -
×
 Spotting Solid Short-Term Opportunities
1 × $6.00
Spotting Solid Short-Term Opportunities
1 × $6.00 -
×
 Andy’s EMini Bar – 40 Min System with Joe Ross
1 × $6.00
Andy’s EMini Bar – 40 Min System with Joe Ross
1 × $6.00 -
×
 eASCTrend Trading Manual (not including 6 trading methods) with Ablesys
1 × $6.00
eASCTrend Trading Manual (not including 6 trading methods) with Ablesys
1 × $6.00 -
×
 Dominate Stocks 2020 with J. Bravo
1 × $6.00
Dominate Stocks 2020 with J. Bravo
1 × $6.00 -
×
 How I Trade for a Living with Gary Smith
1 × $6.00
How I Trade for a Living with Gary Smith
1 × $6.00 -
×
 Profiting In Bull Or Bear Markets with George Dagnino
1 × $6.00
Profiting In Bull Or Bear Markets with George Dagnino
1 × $6.00 -
×
 Speculating with Futures and Traditional Commodities Part II (Liverpool Group) - Noble DraKoln
1 × $6.00
Speculating with Futures and Traditional Commodities Part II (Liverpool Group) - Noble DraKoln
1 × $6.00 -
×
 The Dynamic Trading Master Course with Robert Miner
1 × $54.00
The Dynamic Trading Master Course with Robert Miner
1 × $54.00 -
×
 Technical Analysis for Short-Term Traders
1 × $6.00
Technical Analysis for Short-Term Traders
1 × $6.00 -
×
 Larry Williams Newsletters (1994-1997)
1 × $6.00
Larry Williams Newsletters (1994-1997)
1 × $6.00 -
×
 Investment Science with David G.Luenberger
1 × $6.00
Investment Science with David G.Luenberger
1 × $6.00 -
×
 Profit.ly - Bitcoin Basics
1 × $6.00
Profit.ly - Bitcoin Basics
1 × $6.00 -
×
 Come Into My Trading Room: A Complete Guide to Trading with Alexander Elder
1 × $6.00
Come Into My Trading Room: A Complete Guide to Trading with Alexander Elder
1 × $6.00 -
×
 Regression Diagnostics: Identifying Influential Data and Sources of Collinearity with David Belsey, Edwin Kuh & Roy Welsch
1 × $6.00
Regression Diagnostics: Identifying Influential Data and Sources of Collinearity with David Belsey, Edwin Kuh & Roy Welsch
1 × $6.00 -
×
 The Trap Trade Workshop with Doc Severson
1 × $6.00
The Trap Trade Workshop with Doc Severson
1 × $6.00 -
×
 Squeeze the Markets with Markay Latimer
1 × $6.00
Squeeze the Markets with Markay Latimer
1 × $6.00 -
×
 Futures Trading Secrets Home Study Course 2008 with Bill McCready
1 × $6.00
Futures Trading Secrets Home Study Course 2008 with Bill McCready
1 × $6.00 -
×
 Fundamental Analysis with CA Rachana Ranade
1 × $5.00
Fundamental Analysis with CA Rachana Ranade
1 × $5.00 -
×
 ETFs for the Long Run: What They Are, How They Work, and Simple Strategies for Successful Long-Term Investing - Lawrence Carrel
1 × $6.00
ETFs for the Long Run: What They Are, How They Work, and Simple Strategies for Successful Long-Term Investing - Lawrence Carrel
1 × $6.00 -
×
 Investment Fables with Aswath Damodaran
1 × $6.00
Investment Fables with Aswath Damodaran
1 × $6.00 -
×
 Support and Resistance Trading with Rob Booker
1 × $6.00
Support and Resistance Trading with Rob Booker
1 × $6.00 -
×
 CFA Level 2 - Sample Item Sets 2003
1 × $6.00
CFA Level 2 - Sample Item Sets 2003
1 × $6.00 -
×
 Computational Financial Mathematics with Mathematica
1 × $6.00
Computational Financial Mathematics with Mathematica
1 × $6.00 -
×
 Foundations of Forex Trading with TradeSmart University
1 × $6.00
Foundations of Forex Trading with TradeSmart University
1 × $6.00 -
×
 Price Action Trader Training
1 × $6.00
Price Action Trader Training
1 × $6.00 -
×
 Selling Options For A Living Class with Don Kaufman
1 × $6.00
Selling Options For A Living Class with Don Kaufman
1 × $6.00 -
×
 Simple Forex Profits with Rayy Bannzz
1 × $31.00
Simple Forex Profits with Rayy Bannzz
1 × $31.00 -
×
 Technical Timing Patterns
1 × $6.00
Technical Timing Patterns
1 × $6.00 -
×
 SO FX Educational Course with SO FX
1 × $5.00
SO FX Educational Course with SO FX
1 × $5.00 -
×
 Stock Market Rules (2nd Ed.) with Michael Sheimo
1 × $6.00
Stock Market Rules (2nd Ed.) with Michael Sheimo
1 × $6.00 -
×
 Profit in the Futures Markets! with Jack Bernstein
1 × $6.00
Profit in the Futures Markets! with Jack Bernstein
1 × $6.00 -
×
 Market Maker Strategy Video Course with Fractal Flow Pro
1 × $6.00
Market Maker Strategy Video Course with Fractal Flow Pro
1 × $6.00 -
×
 How To Read The Market Professionally with TradeSmart
1 × $27.00
How To Read The Market Professionally with TradeSmart
1 × $27.00 -
×
 Forex Wave Theory: A Technical Analysis for Spot and Futures Curency Traders - James Bickford
1 × $6.00
Forex Wave Theory: A Technical Analysis for Spot and Futures Curency Traders - James Bickford
1 × $6.00 -
×
 Pro Trading Blueprint with Limitless Forex Academy
1 × $5.00
Pro Trading Blueprint with Limitless Forex Academy
1 × $5.00 -
×
 A Convicted Stock Manipulators Guide to Investing with Marino Specogna
1 × $6.00
A Convicted Stock Manipulators Guide to Investing with Marino Specogna
1 × $6.00 -
×
 The Gold Standard in Trading Education with Six Figure Capital
1 × $5.00
The Gold Standard in Trading Education with Six Figure Capital
1 × $5.00 -
×
 Traders Secret Library
1 × $6.00
Traders Secret Library
1 × $6.00 -
×
 Divorcing the Dow: Using Revolutionary Market Indicators to Profit from the Stealth Boom Ahead - Jim Troup & Sharon Michalsky
1 × $6.00
Divorcing the Dow: Using Revolutionary Market Indicators to Profit from the Stealth Boom Ahead - Jim Troup & Sharon Michalsky
1 × $6.00 -
×
 Complete Short Black Scholes Options Trading Pricing Course
1 × $6.00
Complete Short Black Scholes Options Trading Pricing Course
1 × $6.00 -
×
 Pete Fader VSA Course
1 × $6.00
Pete Fader VSA Course
1 × $6.00 -
×
 Master Trader Technical Strategies with Greg Capra - Master Trader
1 × $5.00
Master Trader Technical Strategies with Greg Capra - Master Trader
1 × $5.00 -
×
 AI For Traders with Trading Markets
1 × $31.00
AI For Traders with Trading Markets
1 × $31.00 -
×
 Sacredscience - Sepharial – Your Personal Diurnal Chart
1 × $6.00
Sacredscience - Sepharial – Your Personal Diurnal Chart
1 × $6.00 -
×
 SJG Trading - Butterflies Class with Steve Ganz
1 × $31.00
SJG Trading - Butterflies Class with Steve Ganz
1 × $31.00 -
×
 Traders Edge with Steven Dux
1 × $5.00
Traders Edge with Steven Dux
1 × $5.00 -
×
 Market Neutral Strategies with Bruce I.Jacobs & Kenneth N.Levy
1 × $6.00
Market Neutral Strategies with Bruce I.Jacobs & Kenneth N.Levy
1 × $6.00 -
×
 The Bond Book (2nd Ed.) with Annette Thau
1 × $6.00
The Bond Book (2nd Ed.) with Annette Thau
1 × $6.00 -
×
 Master Trader - Advander Management Strategies
1 × $39.00
Master Trader - Advander Management Strategies
1 × $39.00 -
×
 Project Manager’s Spotlight on Risk Management with Kim Heldman
1 × $5.00
Project Manager’s Spotlight on Risk Management with Kim Heldman
1 × $5.00 -
×
 Freedom Challenge Course with Steven Dux
1 × $5.00
Freedom Challenge Course with Steven Dux
1 × $5.00 -
×
 Elite Trader Package
1 × $31.00
Elite Trader Package
1 × $31.00 -
×
 The Art And Science Of Trading with Adam Grimes
1 × $6.00
The Art And Science Of Trading with Adam Grimes
1 × $6.00 -
×
 The Best (Public) Trading Methods I’ve Found for Futures & Equities with Perry J.Kaufman
1 × $6.00
The Best (Public) Trading Methods I’ve Found for Futures & Equities with Perry J.Kaufman
1 × $6.00 -
×
 Power FX Xtreme BuySell EA
1 × $23.00
Power FX Xtreme BuySell EA
1 × $23.00 -
×
 Equity Trader 101 Course with KeyStone Trading
1 × $6.00
Equity Trader 101 Course with KeyStone Trading
1 × $6.00 -
×
 Original Curriculum with Home Options Trading Course
1 × $6.00
Original Curriculum with Home Options Trading Course
1 × $6.00 -
×
 Advanced Trading Course with DovyFX
1 × $5.00
Advanced Trading Course with DovyFX
1 × $5.00 -
×
 Trading Earnings Formula Class with Don Kaufman
1 × $6.00
Trading Earnings Formula Class with Don Kaufman
1 × $6.00 -
×
 The Bible of Options Strategies: The Definitive Guide for Practical Trading Strategies with Guy Cohen
1 × $6.00
The Bible of Options Strategies: The Definitive Guide for Practical Trading Strategies with Guy Cohen
1 × $6.00 -
×
 Mastertrader – Mastering Swing Trading
1 × $31.00
Mastertrader – Mastering Swing Trading
1 × $31.00 -
×
 Stock Trading Simplified - 3 DVD + PDF Workbook with John Person
1 × $6.00
Stock Trading Simplified - 3 DVD + PDF Workbook with John Person
1 × $6.00 -
×
 The Cycles and The Codes with Myles Wilson-Walker
1 × $15.00
The Cycles and The Codes with Myles Wilson-Walker
1 × $15.00 -
×
 Simpler Options - Insider’s Guide to Generating Income using Options Strategies Course (Oct 2014)
1 × $6.00
Simpler Options - Insider’s Guide to Generating Income using Options Strategies Course (Oct 2014)
1 × $6.00 -
×
 Confessions of a Pit Trader 2003 with Rick Burgess
1 × $6.00
Confessions of a Pit Trader 2003 with Rick Burgess
1 × $6.00 -
×
 The Practical Fractal with Bill Williams
1 × $6.00
The Practical Fractal with Bill Williams
1 × $6.00 -
×
 How Do You See Risk? A Guide to Evaluating & Applying Technical Volatility Indicators class with Jeff Bierman
1 × $6.00
How Do You See Risk? A Guide to Evaluating & Applying Technical Volatility Indicators class with Jeff Bierman
1 × $6.00 -
×
 New York Institute of Finance – Futures. A Personal Seminar
1 × $6.00
New York Institute of Finance – Futures. A Personal Seminar
1 × $6.00 -
×
 Double Calendars & Double Diagonals 2022 with Sheridan Options Mentoring
1 × $109.00
Double Calendars & Double Diagonals 2022 with Sheridan Options Mentoring
1 × $109.00 -
×
 FX Funding Mate Course
1 × $5.00
FX Funding Mate Course
1 × $5.00 -
×
 HEDGED STRATEGY SERIES IN VOLATILE MARKETS – HEDGED CREDIT SPREADS - Dan Sheridan
1 × $6.00
HEDGED STRATEGY SERIES IN VOLATILE MARKETS – HEDGED CREDIT SPREADS - Dan Sheridan
1 × $6.00 -
×
 Option Income Stream System 2004
1 × $6.00
Option Income Stream System 2004
1 × $6.00 -
×
 The Complete XAUUSD GOLD Forex Scalping System On Real Trading Account with Forex Lia
1 × $5.00
The Complete XAUUSD GOLD Forex Scalping System On Real Trading Account with Forex Lia
1 × $5.00 -
×
 Trading with Wave59 with Earik Beann
1 × $6.00
Trading with Wave59 with Earik Beann
1 × $6.00 -
×
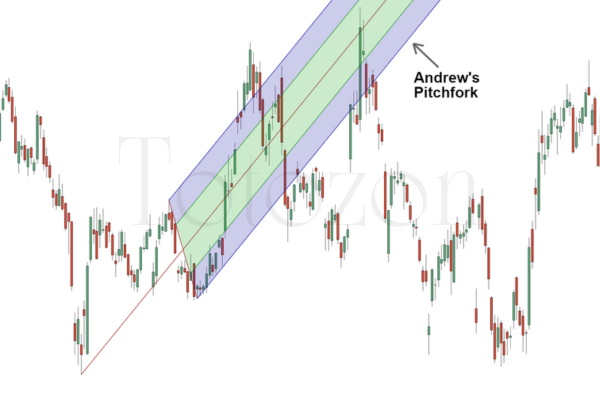 Andrews Pitchfork Basic
1 × $6.00
Andrews Pitchfork Basic
1 × $6.00 -
×
 Trading by the Book (tradingeducators.com)
1 × $6.00
Trading by the Book (tradingeducators.com)
1 × $6.00 -
×
 The 4 Horsemen CD with David Elliott
1 × $6.00
The 4 Horsemen CD with David Elliott
1 × $6.00 -
×
 The Best Option Trading Course with David Jaffee - Best Stock Strategy
1 × $15.00
The Best Option Trading Course with David Jaffee - Best Stock Strategy
1 × $15.00

Investor’s Guide to Charting By Alistair Blair
$6.00
File Size: Cooming soon!
Delivery Time: 1–12 hours
Media Type: Online Course
Content Proof: Watch Here!
You may check content proof of “Investor’s Guide to Charting By Alistair Blair” below:

Investor’s Guide to Charting By Alistair Blair
Introduction
Welcome to the ultimate guide to charting for investors, based on the insights from Alistair Blair. This article aims to provide you with a comprehensive understanding of charting, its importance in investment strategies, and practical tips to enhance your trading skills.
What is Charting?
Charting involves analyzing historical price movements of securities through various types of charts to predict future price movements. It is a fundamental aspect of technical analysis, helping investors make informed decisions.
Why Charting is Essential for Investors
Understanding chart patterns can provide valuable insights into market trends and potential future movements. This can help investors identify entry and exit points, manage risks, and maximize returns.
Types of Charts in Technical Analysis
1. Line Charts
Line charts plot closing prices over a specific period, providing a clear view of the overall trend.
2. Bar Charts
Bar charts display the opening, high, low, and closing prices for each period, giving a more detailed view of price movements.
3. Candlestick Charts
Candlestick charts also show the open, high, low, and close prices but in a more visually appealing format. They are widely used for identifying market patterns.
Key Chart Patterns Every Investor Should Know
1. Head and Shoulders
A reversal pattern that signals a change in trend direction.
2. Double Top and Double Bottom
These patterns indicate potential trend reversals, with the double top suggesting a bearish reversal and the double bottom a bullish reversal.
3. Triangles
Triangles can be ascending, descending, or symmetrical, and they signify continuation or reversal patterns depending on the breakout direction.
Using Indicators in Charting
1. Moving Averages
Moving averages smooth out price data to identify trends. The two most common types are the simple moving average (SMA) and the exponential moving average (EMA).
2. Relative Strength Index (RSI)
RSI measures the speed and change of price movements, helping to identify overbought or oversold conditions.
3. Moving Average Convergence Divergence (MACD)
MACD is a trend-following momentum indicator that shows the relationship between two moving averages.
How to Read Chart Patterns
1. Identifying Trends
Look for higher highs and higher lows for uptrends, and lower highs and lower lows for downtrends.
2. Support and Resistance Levels
Support levels indicate where a price might stop falling, while resistance levels show where a price might stop rising.
3. Volume Analysis
Volume can confirm the strength of a price movement. Higher volume during a price move suggests stronger conviction.
Charting Tools and Software
1. MetaTrader
A popular platform offering a wide range of charting tools and indicators.
2. TradingView
Known for its user-friendly interface and extensive community-driven analysis.
3. Thinkorswim
Provided by TD Ameritrade, it offers professional-level charting capabilities.
Common Mistakes in Charting
1. Overcomplicating Analysis
Stick to a few key indicators and patterns to avoid analysis paralysis.
2. Ignoring Volume
Always consider volume to validate price movements and trends.
3. Not Adjusting for Different Time Frames
Analyze multiple time frames to get a comprehensive view of the market.
Developing a Charting Strategy
1. Define Your Goals
Determine your investment goals and risk tolerance.
2. Backtesting
Test your strategy using historical data to ensure its effectiveness.
3. Stay Updated
Keep learning and adapting to new market conditions and charting techniques.
The Benefits of Using Alistair Blair’s Approach
Alistair Blair’s methodologies emphasize simplicity, clarity, and practical application. By focusing on essential patterns and indicators, investors can make more informed decisions without getting overwhelmed.
Conclusion
Charting is a powerful tool that, when used correctly, can significantly enhance your investment strategy. By following Alistair Blair’s guide, you can develop a robust understanding of charting, identify key patterns, and make informed trading decisions.

Frequently Asked Questions
1. What is the most important chart for beginners to start with?
For beginners, line charts are the easiest to understand and provide a good starting point for identifying trends.
2. How often should I analyze charts?
Regular analysis, such as daily or weekly reviews, can help you stay updated with market trends and make timely decisions.
3. Can charting predict market crashes?
While charting can indicate potential reversals and trends, it cannot predict market crashes with certainty.
4. What is the best charting software for beginners?
TradingView is highly recommended for beginners due to its user-friendly interface and extensive educational resources.
5. How do I combine multiple indicators in my analysis?
Start with a few key indicators, like moving averages and RSI, and gradually incorporate more as you become comfortable with your analysis.
Be the first to review “Investor’s Guide to Charting By Alistair Blair”
You must be logged in to post a review.
Related products

Original price was: $895.00.$15.00Current price is: $15.00.

Forex Trading
Original price was: $697.00.$5.00Current price is: $5.00.

Original price was: $649.00.$20.00Current price is: $20.00.

Original price was: $999.00.$5.00Current price is: $5.00.

Original price was: $197.00.$5.00Current price is: $5.00.

Forex Trading
Quantamentals – The Next Great Forefront Of Trading and Investing with Trading Markets
Original price was: $1,495.00.$8.00Current price is: $8.00.

Original price was: $700.00.$39.00Current price is: $39.00.
Original price was: $1,849.00.$15.00Current price is: $15.00.

Forex Trading
Original price was: $249.00.$15.00Current price is: $15.00.

Forex Trading
Original price was: $1,098.00.$39.00Current price is: $39.00.

Forex Trading
Original price was: $125.00.$17.00Current price is: $17.00.
Forex Trading
Original price was: $2,995.00.$31.00Current price is: $31.00.

Original price was: $450.00.$23.00Current price is: $23.00.

Original price was: $299.00.$8.00Current price is: $8.00.
Forex Trading
Original price was: $4,997.00.$27.00Current price is: $27.00.

Forex Trading
Original price was: $850.00.$23.00Current price is: $23.00.

Forex Trading
Original price was: $2,000.00.$23.00Current price is: $23.00.

Forex Trading
The Complete Guide to Multiple Time Frame Analysis & Reading Price Action with Aiman Almansoori
Original price was: $1,399.00.$13.00Current price is: $13.00.

Forex Trading
Original price was: $797.00.$10.00Current price is: $10.00.

Original price was: $497.00.$11.00Current price is: $11.00.

Reviews
There are no reviews yet.