-
×
 The Loyalty Effect with Frederick Reichheld
1 × $6.00
The Loyalty Effect with Frederick Reichheld
1 × $6.00 -
×
 Guide to Scanning for Potential Stock Trades class with Jeff Bierman
1 × $6.00
Guide to Scanning for Potential Stock Trades class with Jeff Bierman
1 × $6.00 -
×
 The Precision Profit Float Indicator (TS Code & Setups) with Steve Woods
1 × $6.00
The Precision Profit Float Indicator (TS Code & Setups) with Steve Woods
1 × $6.00 -
×
 Foundations of Forex Trading with TradeSmart University
1 × $6.00
Foundations of Forex Trading with TradeSmart University
1 × $6.00 -
×
 The Reducing Risk and Maximizing Returns Blueprint (Atomic Hedge Strategy) with Don Kaufman
1 × $6.00
The Reducing Risk and Maximizing Returns Blueprint (Atomic Hedge Strategy) with Don Kaufman
1 × $6.00 -
×
 FX GOAT 3.0 (ALL IN ONE) with FX GOAT FOREX TRADING ACADEMY
1 × $5.00
FX GOAT 3.0 (ALL IN ONE) with FX GOAT FOREX TRADING ACADEMY
1 × $5.00 -
×
 FasTrack Premium with Note Conference
1 × $78.00
FasTrack Premium with Note Conference
1 × $78.00 -
×
 How to Value & Sell your Business with Andrew Heslop
1 × $6.00
How to Value & Sell your Business with Andrew Heslop
1 × $6.00 -
×
 Technical Analysis for Short-Term Traders
1 × $6.00
Technical Analysis for Short-Term Traders
1 × $6.00 -
×
 Fundamental Analysis with CA Rachana Ranade
1 × $5.00
Fundamental Analysis with CA Rachana Ranade
1 × $5.00 -
×
 Smart Money Concepts with JordyBanks
1 × $6.00
Smart Money Concepts with JordyBanks
1 × $6.00 -
×
 Accelerated Learning Techniques in Action with Colin Rose, Jayne Nicholl & Malcolm Nicholl
1 × $6.00
Accelerated Learning Techniques in Action with Colin Rose, Jayne Nicholl & Malcolm Nicholl
1 × $6.00 -
×
 Fibonnacci Trader WorkShop (Video 2.38 GB) with Dennis Bolze, Thom Hartle
1 × $6.00
Fibonnacci Trader WorkShop (Video 2.38 GB) with Dennis Bolze, Thom Hartle
1 × $6.00 -
×
 Tharp Think Essentials Video Workshop with Van Tharp
1 × $5.00
Tharp Think Essentials Video Workshop with Van Tharp
1 × $5.00 -
×
 Forex Trading Course with Mike Norman
1 × $17.00
Forex Trading Course with Mike Norman
1 × $17.00 -
×
 Perfect Publishing System Elite with Johnny Andrews
1 × $6.00
Perfect Publishing System Elite with Johnny Andrews
1 × $6.00 -
×
 ICT Prodigy Trading Course – $650K in Payouts with Alex Solignani
1 × $15.00
ICT Prodigy Trading Course – $650K in Payouts with Alex Solignani
1 × $15.00 -
×
 Lee Gettess’s Package
1 × $6.00
Lee Gettess’s Package
1 × $6.00 -
×
 Trading for a Living with Alexander Elder
1 × $6.00
Trading for a Living with Alexander Elder
1 × $6.00 -
×
 Scalp Strategy and Flipping Small Accounts with Opes Trading Group
1 × $5.00
Scalp Strategy and Flipping Small Accounts with Opes Trading Group
1 × $5.00 -
×
 Sell & Sell Short with Alexander Elder
1 × $6.00
Sell & Sell Short with Alexander Elder
1 × $6.00 -
×
 Technical Analysis Entry & Exit with Andrew Baxter
1 × $6.00
Technical Analysis Entry & Exit with Andrew Baxter
1 × $6.00 -
×
 Technical Analysis & Options Strategies with K.H.Shaleen
1 × $6.00
Technical Analysis & Options Strategies with K.H.Shaleen
1 × $6.00 -
×
 Gillen Predicts with Jack Gillen
1 × $6.00
Gillen Predicts with Jack Gillen
1 × $6.00 -
×
 Options Trading & Ultimate MasterClass With Tyrone Abela - FX Evolution
1 × $54.00
Options Trading & Ultimate MasterClass With Tyrone Abela - FX Evolution
1 × $54.00 -
×
 Hedge Funds for Dummies
1 × $6.00
Hedge Funds for Dummies
1 × $6.00 -
×
 Futures 101: An Introduction to Futures Contracts Class with Don Kaufman
1 × $6.00
Futures 101: An Introduction to Futures Contracts Class with Don Kaufman
1 × $6.00 -
×
 Day Trading Insight with Al Brooks
1 × $10.00
Day Trading Insight with Al Brooks
1 × $10.00 -
×
 Equities with Peter Martin
1 × $6.00
Equities with Peter Martin
1 × $6.00 -
×
 How To Trade Forex Using Support & Resistance Levels with Vic Noble
1 × $6.00
How To Trade Forex Using Support & Resistance Levels with Vic Noble
1 × $6.00 -
×
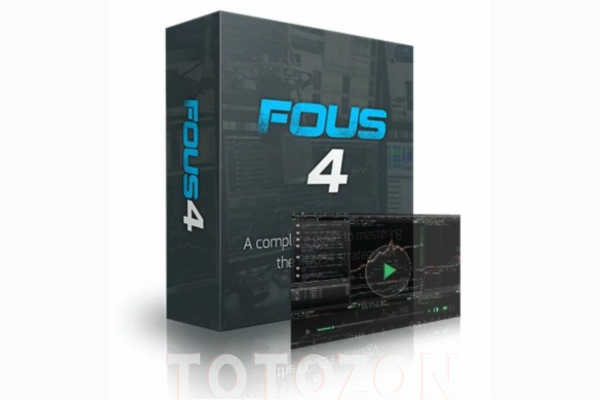 FOUS4 with Cameron Fous
1 × $5.00
FOUS4 with Cameron Fous
1 × $5.00 -
×
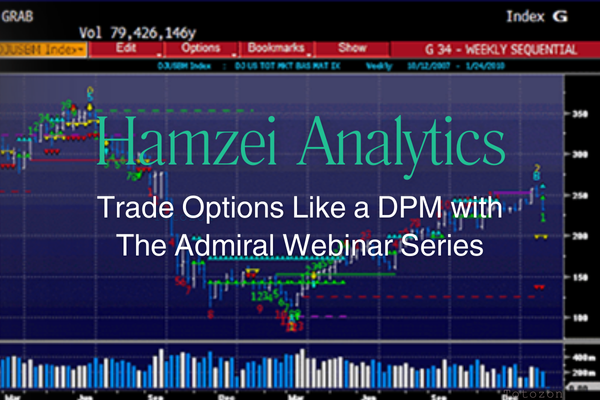 Trade Options Like a DPM with The Admiral Webinar Series with Hamzei Analytics
1 × $6.00
Trade Options Like a DPM with The Admiral Webinar Series with Hamzei Analytics
1 × $6.00 -
×
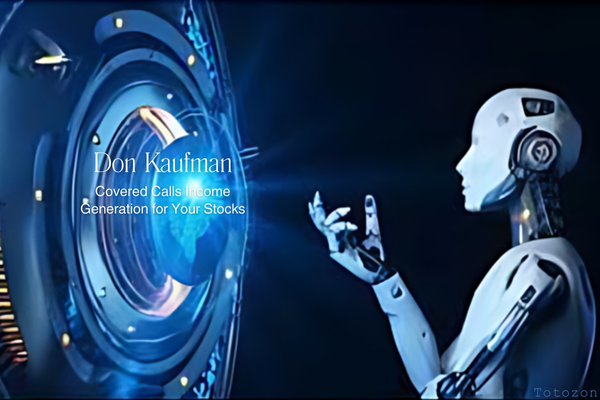 Covered Calls Income Generation for Your Stocks With Don Kaufman
1 × $6.00
Covered Calls Income Generation for Your Stocks With Don Kaufman
1 × $6.00 -
×
 The Orderflow Masterclass with PrimeTrading
1 × $17.00
The Orderflow Masterclass with PrimeTrading
1 × $17.00 -
×
 Evolution Course with Kevin Trades
1 × $15.00
Evolution Course with Kevin Trades
1 × $15.00 -
×
 The Aggressive Investor. Case Studies with Colin Nicholson
1 × $6.00
The Aggressive Investor. Case Studies with Colin Nicholson
1 × $6.00 -
×
 Day Trade Futures Online with Larry Williams
1 × $6.00
Day Trade Futures Online with Larry Williams
1 × $6.00 -
×
 Elliott Flat Waves CD with David Elliott
1 × $6.00
Elliott Flat Waves CD with David Elliott
1 × $6.00 -
×
 Signals
1 × $6.00
Signals
1 × $6.00 -
×
 How to Analyze Multifamily Investment Opportunities with Symon He & Brandon Young
1 × $6.00
How to Analyze Multifamily Investment Opportunities with Symon He & Brandon Young
1 × $6.00 -
×
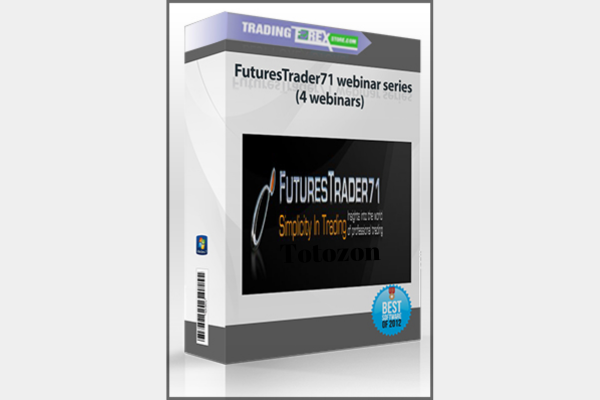 FuturesTrader71 - webinar series (4 webinars)
1 × $6.00
FuturesTrader71 - webinar series (4 webinars)
1 × $6.00 -
×
 Staying Alive in the Markets (Video & Manual) with Mark Cook
1 × $6.00
Staying Alive in the Markets (Video & Manual) with Mark Cook
1 × $6.00 -
×
 The Complete XAUUSD GOLD Forex Scalping System On Real Trading Account with Forex Lia
1 × $5.00
The Complete XAUUSD GOLD Forex Scalping System On Real Trading Account with Forex Lia
1 × $5.00 -
×
 Electronic Day Traders' Secrets: Learn From the Best of the Best DayTraders with Burton Friedfertig
1 × $6.00
Electronic Day Traders' Secrets: Learn From the Best of the Best DayTraders with Burton Friedfertig
1 × $6.00 -
×
 Spartan Renko 2.0 Workshop 2017
1 × $23.00
Spartan Renko 2.0 Workshop 2017
1 × $23.00 -
×
 Earnings Power Play with Dave Aquino
1 × $15.00
Earnings Power Play with Dave Aquino
1 × $15.00 -
×
 The Best Option Trading Course with David Jaffee - Best Stock Strategy
1 × $15.00
The Best Option Trading Course with David Jaffee - Best Stock Strategy
1 × $15.00 -
×
 The Adventures of the Cycle Hunter. The Trader with Craig Bttlc
1 × $6.00
The Adventures of the Cycle Hunter. The Trader with Craig Bttlc
1 × $6.00 -
×
 Ultimate Trading Course with Dodgy's Dungeon
1 × $8.00
Ultimate Trading Course with Dodgy's Dungeon
1 × $8.00 -
×
 Algo Trading Masterclass with Ali Casey - StatOasis
1 × $23.00
Algo Trading Masterclass with Ali Casey - StatOasis
1 × $23.00 -
×
 The Complete Guide to Multiple Time Frame Analysis & Reading Price Action with Aiman Almansoori
1 × $13.00
The Complete Guide to Multiple Time Frame Analysis & Reading Price Action with Aiman Almansoori
1 × $13.00 -
×
 The Master Indicator 2023 with Lance Ippolito
1 × $101.00
The Master Indicator 2023 with Lance Ippolito
1 × $101.00 -
×
 The Great Depression with David Burg
1 × $6.00
The Great Depression with David Burg
1 × $6.00 -
×
 The Master Trader Bundle with Gareth Soloway
1 × $39.00
The Master Trader Bundle with Gareth Soloway
1 × $39.00 -
×
 Ichimoku Cloud Trading System Class with Jeff Bierman
1 × $6.00
Ichimoku Cloud Trading System Class with Jeff Bierman
1 × $6.00 -
×
 Capital with Charles D.Ellis
1 × $6.00
Capital with Charles D.Ellis
1 × $6.00 -
×
 Day Trading and Swing Trading Futures with Price Action by Humberto Malaspina
1 × $5.00
Day Trading and Swing Trading Futures with Price Action by Humberto Malaspina
1 × $5.00 -
×
 Master Trader Technical Strategies with Greg Capra - Master Trader
1 × $5.00
Master Trader Technical Strategies with Greg Capra - Master Trader
1 × $5.00 -
×
 Masterclass 3.0 with RockzFX Academy
1 × $6.00
Masterclass 3.0 with RockzFX Academy
1 × $6.00 -
×
 Neural Networks in Trading with Dr. Ernest P. Chan
1 × $31.00
Neural Networks in Trading with Dr. Ernest P. Chan
1 × $31.00 -
×
 Seasonal Stock Market Trends: The Definitive Guide to Calendar‐Based Stock Market Trading with Jay Kaeppel
1 × $6.00
Seasonal Stock Market Trends: The Definitive Guide to Calendar‐Based Stock Market Trading with Jay Kaeppel
1 × $6.00 -
×
 Stock Trading Simplified - 3 DVD + PDF Workbook with John Person
1 × $6.00
Stock Trading Simplified - 3 DVD + PDF Workbook with John Person
1 × $6.00 -
×
 The Complete Foundation Stock Trading Course
1 × $62.00
The Complete Foundation Stock Trading Course
1 × $62.00 -
×
 The Complete Guide to Spread Trading
1 × $6.00
The Complete Guide to Spread Trading
1 × $6.00 -
×
 Team Bull Trading Academy
1 × $5.00
Team Bull Trading Academy
1 × $5.00 -
×
 Live in London (5 DVD) with Martin Pring
1 × $6.00
Live in London (5 DVD) with Martin Pring
1 × $6.00 -
×
 Frank Paul – Fibonacci Swing Trader Foundation Course 2011 (Video, Manuals, 5.1 GB) with Forexmentor
1 × $6.00
Frank Paul – Fibonacci Swing Trader Foundation Course 2011 (Video, Manuals, 5.1 GB) with Forexmentor
1 × $6.00 -
×
 FlowRider Trading Course with Boris Schlossberg and Kathy Lien - Bkforex
1 × $15.00
FlowRider Trading Course with Boris Schlossberg and Kathy Lien - Bkforex
1 × $15.00 -
×
 OFA - Intensive Boot Camp 5 Day Course
1 × $6.00
OFA - Intensive Boot Camp 5 Day Course
1 × $6.00 -
×
 Fantastic 4 Trading Strategies
1 × $15.00
Fantastic 4 Trading Strategies
1 × $15.00 -
×
 The 80% Solution S&P Systems with Bruce Babcock
1 × $6.00
The 80% Solution S&P Systems with Bruce Babcock
1 × $6.00 -
×
 How Do You See Risk? A Guide to Evaluating & Applying Technical Volatility Indicators class with Theotrade
1 × $4.00
How Do You See Risk? A Guide to Evaluating & Applying Technical Volatility Indicators class with Theotrade
1 × $4.00 -
×
 Investment Philosophies
1 × $6.00
Investment Philosophies
1 × $6.00 -
×
 EURUSD Trading System with CopperChips
1 × $6.00
EURUSD Trading System with CopperChips
1 × $6.00 -
×
 Advanced Trading Course - Footprint Charts, Market Profile & TPO with Jayson Casper
1 × $31.00
Advanced Trading Course - Footprint Charts, Market Profile & TPO with Jayson Casper
1 × $31.00 -
×
 Executive Mentoring Elliot Wave Course (Video & Manuals)
1 × $6.00
Executive Mentoring Elliot Wave Course (Video & Manuals)
1 × $6.00 -
×
 TradeCraft: Your Path to Peak Performance Trading By Adam Grimes
1 × $15.00
TradeCraft: Your Path to Peak Performance Trading By Adam Grimes
1 × $15.00 -
×
 ProfileTraders - Advanced Market Profile (May 2014)
1 × $6.00
ProfileTraders - Advanced Market Profile (May 2014)
1 × $6.00 -
×
 How To Write High Converting Copy with Tej Dosa
1 × $6.00
How To Write High Converting Copy with Tej Dosa
1 × $6.00 -
×
 Harmonic Elliott Wave: The Case for Modification of R. N. Elliott's Impulsive Wave Structure with Ian Copsey
1 × $6.00
Harmonic Elliott Wave: The Case for Modification of R. N. Elliott's Impulsive Wave Structure with Ian Copsey
1 × $6.00 -
×
 Gann’s Scientific Methods Unveiled (Vol I, II)
1 × $6.00
Gann’s Scientific Methods Unveiled (Vol I, II)
1 × $6.00 -
×
 Larry Williams Newsletters (1994-1997)
1 × $6.00
Larry Williams Newsletters (1994-1997)
1 × $6.00 -
×
 The Cycles and The Codes with Myles Wilson-Walker
1 × $15.00
The Cycles and The Codes with Myles Wilson-Walker
1 × $15.00 -
×
 Fundamentals of the Securities Industry with William A.Rini
1 × $6.00
Fundamentals of the Securities Industry with William A.Rini
1 × $6.00 -
×
 Stock Traders Almanac 2008 with Jeffrey Hirsch & Yale Hirsch
1 × $6.00
Stock Traders Almanac 2008 with Jeffrey Hirsch & Yale Hirsch
1 × $6.00 -
×
 Compass Trading System with Right Line Trading
1 × $39.00
Compass Trading System with Right Line Trading
1 × $39.00

Investor’s Guide to Charting By Alistair Blair
$6.00
File Size: Cooming soon!
Delivery Time: 1–12 hours
Media Type: Online Course
Content Proof: Watch Here!
You may check content proof of “Investor’s Guide to Charting By Alistair Blair” below:

Investor’s Guide to Charting By Alistair Blair
Introduction
Welcome to the ultimate guide to charting for investors, based on the insights from Alistair Blair. This article aims to provide you with a comprehensive understanding of charting, its importance in investment strategies, and practical tips to enhance your trading skills.
What is Charting?
Charting involves analyzing historical price movements of securities through various types of charts to predict future price movements. It is a fundamental aspect of technical analysis, helping investors make informed decisions.
Why Charting is Essential for Investors
Understanding chart patterns can provide valuable insights into market trends and potential future movements. This can help investors identify entry and exit points, manage risks, and maximize returns.
Types of Charts in Technical Analysis
1. Line Charts
Line charts plot closing prices over a specific period, providing a clear view of the overall trend.
2. Bar Charts
Bar charts display the opening, high, low, and closing prices for each period, giving a more detailed view of price movements.
3. Candlestick Charts
Candlestick charts also show the open, high, low, and close prices but in a more visually appealing format. They are widely used for identifying market patterns.
Key Chart Patterns Every Investor Should Know
1. Head and Shoulders
A reversal pattern that signals a change in trend direction.
2. Double Top and Double Bottom
These patterns indicate potential trend reversals, with the double top suggesting a bearish reversal and the double bottom a bullish reversal.
3. Triangles
Triangles can be ascending, descending, or symmetrical, and they signify continuation or reversal patterns depending on the breakout direction.
Using Indicators in Charting
1. Moving Averages
Moving averages smooth out price data to identify trends. The two most common types are the simple moving average (SMA) and the exponential moving average (EMA).
2. Relative Strength Index (RSI)
RSI measures the speed and change of price movements, helping to identify overbought or oversold conditions.
3. Moving Average Convergence Divergence (MACD)
MACD is a trend-following momentum indicator that shows the relationship between two moving averages.
How to Read Chart Patterns
1. Identifying Trends
Look for higher highs and higher lows for uptrends, and lower highs and lower lows for downtrends.
2. Support and Resistance Levels
Support levels indicate where a price might stop falling, while resistance levels show where a price might stop rising.
3. Volume Analysis
Volume can confirm the strength of a price movement. Higher volume during a price move suggests stronger conviction.
Charting Tools and Software
1. MetaTrader
A popular platform offering a wide range of charting tools and indicators.
2. TradingView
Known for its user-friendly interface and extensive community-driven analysis.
3. Thinkorswim
Provided by TD Ameritrade, it offers professional-level charting capabilities.
Common Mistakes in Charting
1. Overcomplicating Analysis
Stick to a few key indicators and patterns to avoid analysis paralysis.
2. Ignoring Volume
Always consider volume to validate price movements and trends.
3. Not Adjusting for Different Time Frames
Analyze multiple time frames to get a comprehensive view of the market.
Developing a Charting Strategy
1. Define Your Goals
Determine your investment goals and risk tolerance.
2. Backtesting
Test your strategy using historical data to ensure its effectiveness.
3. Stay Updated
Keep learning and adapting to new market conditions and charting techniques.
The Benefits of Using Alistair Blair’s Approach
Alistair Blair’s methodologies emphasize simplicity, clarity, and practical application. By focusing on essential patterns and indicators, investors can make more informed decisions without getting overwhelmed.
Conclusion
Charting is a powerful tool that, when used correctly, can significantly enhance your investment strategy. By following Alistair Blair’s guide, you can develop a robust understanding of charting, identify key patterns, and make informed trading decisions.

Frequently Asked Questions
1. What is the most important chart for beginners to start with?
For beginners, line charts are the easiest to understand and provide a good starting point for identifying trends.
2. How often should I analyze charts?
Regular analysis, such as daily or weekly reviews, can help you stay updated with market trends and make timely decisions.
3. Can charting predict market crashes?
While charting can indicate potential reversals and trends, it cannot predict market crashes with certainty.
4. What is the best charting software for beginners?
TradingView is highly recommended for beginners due to its user-friendly interface and extensive educational resources.
5. How do I combine multiple indicators in my analysis?
Start with a few key indicators, like moving averages and RSI, and gradually incorporate more as you become comfortable with your analysis.
Be the first to review “Investor’s Guide to Charting By Alistair Blair”
You must be logged in to post a review.
Related products

Forex Trading
Original price was: $799.00.$15.00Current price is: $15.00.
Forex Trading
The Complete Guide to Multiple Time Frame Analysis & Reading Price Action with Aiman Almansoori
Original price was: $1,399.00.$13.00Current price is: $13.00.

Original price was: $1,200.00.$23.00Current price is: $23.00.
Forex Trading
Original price was: $2,000.00.$23.00Current price is: $23.00.

Original price was: $197.00.$5.00Current price is: $5.00.

Forex Trading
Original price was: $4,997.00.$27.00Current price is: $27.00.

Original price was: $895.00.$15.00Current price is: $15.00.

Original price was: $997.00.$8.00Current price is: $8.00.
Forex Trading
Original price was: $125.00.$17.00Current price is: $17.00.
Original price was: $2,120.00.$15.00Current price is: $15.00.

Original price was: $649.00.$20.00Current price is: $20.00.
Forex Trading
Original price was: $239.00.$8.00Current price is: $8.00.

Forex Trading
Original price was: $697.00.$5.00Current price is: $5.00.

Original price was: $700.00.$39.00Current price is: $39.00.

Forex Trading
Original price was: $2,997.00.$23.00Current price is: $23.00.

Original price was: $497.00.$11.00Current price is: $11.00.

Original price was: $310.00.$23.00Current price is: $23.00.
Original price was: $999.00.$5.00Current price is: $5.00.

Forex Trading
Original price was: $797.00.$10.00Current price is: $10.00.

Original price was: $497.00.$31.00Current price is: $31.00.

Reviews
There are no reviews yet.