-
×
 Options University - Ron Ianieri – Options University Live Seminars
1 × $6.00
Options University - Ron Ianieri – Options University Live Seminars
1 × $6.00 -
×
 Equity Valuation for Analysts and Investors: A Unique Stock Valuation Tool for Financial Statement Analysis and Model-Building with James Kelleher
1 × $6.00
Equity Valuation for Analysts and Investors: A Unique Stock Valuation Tool for Financial Statement Analysis and Model-Building with James Kelleher
1 × $6.00 -
×
 Master Trader Technical Strategies with Greg Capra - Master Trader
1 × $5.00
Master Trader Technical Strategies with Greg Capra - Master Trader
1 × $5.00 -
×
 The Hedge Bundle - SpotGamma Academy with Imran Lakha
1 × $8.00
The Hedge Bundle - SpotGamma Academy with Imran Lakha
1 × $8.00 -
×
 David Weis Stock Market Update Nightly Report 2014-2019
1 × $20.00
David Weis Stock Market Update Nightly Report 2014-2019
1 × $20.00 -
×
 Technical Analysis for Long-Term Investors with Clay Allen
1 × $6.00
Technical Analysis for Long-Term Investors with Clay Allen
1 × $6.00 -
×
 OPTIONS FOR BEGINNERS
1 × $6.00
OPTIONS FOR BEGINNERS
1 × $6.00 -
×
 Street-Smart Chart Reading – Volume 2 – Digging Deeper with Donald G.Worden
1 × $6.00
Street-Smart Chart Reading – Volume 2 – Digging Deeper with Donald G.Worden
1 × $6.00 -
×
 The Handbook of Chaos Control with H.G.Schuster
1 × $6.00
The Handbook of Chaos Control with H.G.Schuster
1 × $6.00 -
×
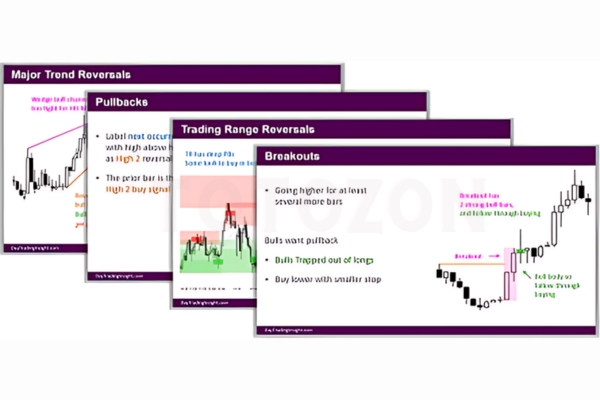 Day Trading Insight with Al Brooks
1 × $10.00
Day Trading Insight with Al Brooks
1 × $10.00 -
×
 Rich in America: Secrets to Creating and Preserving Wealth with Jeffrey Maurer
1 × $6.00
Rich in America: Secrets to Creating and Preserving Wealth with Jeffrey Maurer
1 × $6.00 -
×
 Compass Trading System with Right Line Trading
1 × $39.00
Compass Trading System with Right Line Trading
1 × $39.00 -
×
 Dynamic Trading Indicators with Mark W.Helweg, David C.Stendahl
1 × $6.00
Dynamic Trading Indicators with Mark W.Helweg, David C.Stendahl
1 × $6.00 -
×
 Trading Short TermSame Day Trades Sep 2023 with Dan Sheridan & Mark Fenton - Sheridan Options Mentoring
1 × $31.00
Trading Short TermSame Day Trades Sep 2023 with Dan Sheridan & Mark Fenton - Sheridan Options Mentoring
1 × $31.00 -
×
 Marder Videos Reports 2019-2022 with Kevin Marder
1 × $104.00
Marder Videos Reports 2019-2022 with Kevin Marder
1 × $104.00 -
×
 The Market Geometry Basic Seminar DVD with Market Geometry
1 × $31.00
The Market Geometry Basic Seminar DVD with Market Geometry
1 × $31.00 -
×
 Stonhill Forex 201 Advanced Course
1 × $5.00
Stonhill Forex 201 Advanced Course
1 × $5.00 -
×
 Detecting Trend Direction & Strength (Article) with Barbara Star
1 × $6.00
Detecting Trend Direction & Strength (Article) with Barbara Star
1 × $6.00 -
×
 Concerning The More Certain Fundamentals Of Astrology
1 × $6.00
Concerning The More Certain Fundamentals Of Astrology
1 × $6.00 -
×
 AI For Traders with Trading Markets
1 × $31.00
AI For Traders with Trading Markets
1 × $31.00 -
×
 Sure Fire Forex Trading with Mark McRae
1 × $6.00
Sure Fire Forex Trading with Mark McRae
1 × $6.00 -
×
 Sacredscience - Raphael – Book of Fate
1 × $6.00
Sacredscience - Raphael – Book of Fate
1 × $6.00 -
×
 Gold Trading Academy Video Course
1 × $23.00
Gold Trading Academy Video Course
1 × $23.00 -
×
 The Correlation Code with Jason Fielder
1 × $6.00
The Correlation Code with Jason Fielder
1 × $6.00 -
×
 Seller Specialist Program with Chris Prefontaine
1 × $62.00
Seller Specialist Program with Chris Prefontaine
1 × $62.00 -
×
 Gann Trade Real Time with Larry B.Jacobs
1 × $6.00
Gann Trade Real Time with Larry B.Jacobs
1 × $6.00 -
×
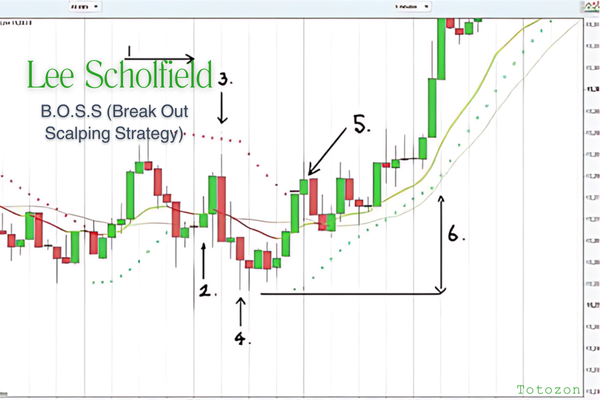 B.O.S.S (Break Out Scalping Strategy) with Lee Scholfield
1 × $6.00
B.O.S.S (Break Out Scalping Strategy) with Lee Scholfield
1 × $6.00 -
×
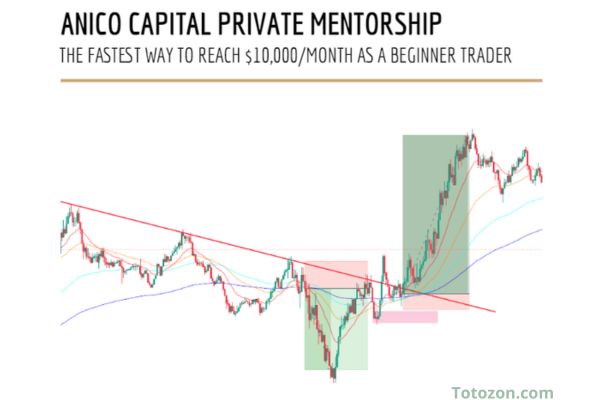 Private Mentorship with ANICO Capital
1 × $10.00
Private Mentorship with ANICO Capital
1 × $10.00 -
×
 Quantitative Business Valuation with Jay Abrams
1 × $6.00
Quantitative Business Valuation with Jay Abrams
1 × $6.00 -
×
 Star Traders Forex Intermediate Course I with Karen Foo
1 × $8.00
Star Traders Forex Intermediate Course I with Karen Foo
1 × $8.00 -
×
 Staying Alive in the Markets (Video & Manual) with Mark Cook
1 × $6.00
Staying Alive in the Markets (Video & Manual) with Mark Cook
1 × $6.00 -
×
 The Psychology of Investing with John Nofsinger
1 × $6.00
The Psychology of Investing with John Nofsinger
1 × $6.00 -
×
 Profit Power Seminar
1 × $23.00
Profit Power Seminar
1 × $23.00 -
×
 The Loyalty Effect with Frederick Reichheld
1 × $6.00
The Loyalty Effect with Frederick Reichheld
1 × $6.00 -
×
 Option Income Stream System 2004
1 × $6.00
Option Income Stream System 2004
1 × $6.00 -
×
 Capital with Charles D.Ellis
1 × $6.00
Capital with Charles D.Ellis
1 × $6.00 -
×
 Fractal Flow Strategy Video Course with Fractal Flow Pro
1 × $6.00
Fractal Flow Strategy Video Course with Fractal Flow Pro
1 × $6.00 -
×
 Stock Market Wizards Interviews with America’s Top Stock Traders - Jack Schwager
1 × $6.00
Stock Market Wizards Interviews with America’s Top Stock Traders - Jack Schwager
1 × $6.00 -
×
 Limitless FX Academy Course
1 × $5.00
Limitless FX Academy Course
1 × $5.00 -
×
 Carolyn Boroden Package
1 × $15.00
Carolyn Boroden Package
1 × $15.00 -
×
 Fundamentals of the Stock Market with B.O’Neill Wyss
1 × $6.00
Fundamentals of the Stock Market with B.O’Neill Wyss
1 × $6.00 -
×
 Home Run Options Trading Course with Dave Aquino - Base Camp Trading
1 × $11.00
Home Run Options Trading Course with Dave Aquino - Base Camp Trading
1 × $11.00 -
×
 The Complete Guide to Multiple Time Frame Analysis & Reading Price Action with Aiman Almansoori
1 × $13.00
The Complete Guide to Multiple Time Frame Analysis & Reading Price Action with Aiman Almansoori
1 × $13.00 -
×
 GANNacci Code Elite + Training Course
1 × $31.00
GANNacci Code Elite + Training Course
1 × $31.00 -
×
 Sequence Trading Course with Kevin Haggerty
1 × $4.00
Sequence Trading Course with Kevin Haggerty
1 × $4.00 -
×
 Handbook for Enviroment Risk Decision Making with C.Richard Cothern
1 × $6.00
Handbook for Enviroment Risk Decision Making with C.Richard Cothern
1 × $6.00 -
×
 The Litle Book of Bulletproof Investing
1 × $6.00
The Litle Book of Bulletproof Investing
1 × $6.00 -
×
 Short-Term Trading Course with Mark Boucher
1 × $6.00
Short-Term Trading Course with Mark Boucher
1 × $6.00 -
×
 Trading for a Living with Alexander Elder
1 × $6.00
Trading for a Living with Alexander Elder
1 × $6.00 -
×
 Crypto Trading Cyber Security for Bitcoin & Altcoin Holders with Zlatin Georgiev
1 × $5.00
Crypto Trading Cyber Security for Bitcoin & Altcoin Holders with Zlatin Georgiev
1 × $5.00 -
×
 Futures & Options for Dummies with Joe Duarte
1 × $6.00
Futures & Options for Dummies with Joe Duarte
1 × $6.00 -
×
 Futures Day Trading And Order Flow Course with Trade Pro Academy
1 × $15.00
Futures Day Trading And Order Flow Course with Trade Pro Academy
1 × $15.00 -
×
 Practical Speculation with Victor Niederhoffer, Laurel Kenner
1 × $6.00
Practical Speculation with Victor Niederhoffer, Laurel Kenner
1 × $6.00 -
×
 Earnings Engine with Sami Abusaad - T3 Live
1 × $6.00
Earnings Engine with Sami Abusaad - T3 Live
1 × $6.00 -
×
 7 Figures Forex Course
1 × $15.00
7 Figures Forex Course
1 × $15.00 -
×
 Profinacci Complete Course with Stephen A.Pierce
1 × $6.00
Profinacci Complete Course with Stephen A.Pierce
1 × $6.00 -
×
 Gold. Symmetrycs Trading Method with Joseph Rondione
1 × $6.00
Gold. Symmetrycs Trading Method with Joseph Rondione
1 × $6.00 -
×
 How Do You See Risk? A Guide to Evaluating & Applying Technical Volatility Indicators class with Theotrade
1 × $4.00
How Do You See Risk? A Guide to Evaluating & Applying Technical Volatility Indicators class with Theotrade
1 × $4.00 -
×
 B.O.S.S. SPY Sniper with Pat Mitchell – Trick Trades
1 × $39.00
B.O.S.S. SPY Sniper with Pat Mitchell – Trick Trades
1 × $39.00 -
×
 Passages To Profitability: A Comprehensive Guide To Channel Trading with Professor Jeff Bierman, CMT
1 × $6.00
Passages To Profitability: A Comprehensive Guide To Channel Trading with Professor Jeff Bierman, CMT
1 × $6.00 -
×
 Order flow self-study training program with iMFtracker
1 × $10.00
Order flow self-study training program with iMFtracker
1 × $10.00 -
×
 The Chaos Course. Cash in on Chaos with Hans Hannula
1 × $6.00
The Chaos Course. Cash in on Chaos with Hans Hannula
1 × $6.00 -
×
 Supply And Demand Zone Trading Course with Trading180
1 × $5.00
Supply And Demand Zone Trading Course with Trading180
1 × $5.00 -
×
 ETFs for the Long Run: What They Are, How They Work, and Simple Strategies for Successful Long-Term Investing - Lawrence Carrel
1 × $6.00
ETFs for the Long Run: What They Are, How They Work, and Simple Strategies for Successful Long-Term Investing - Lawrence Carrel
1 × $6.00 -
×
 The Crash of 1997 (Article) with Hans Hannula
1 × $6.00
The Crash of 1997 (Article) with Hans Hannula
1 × $6.00 -
×
 Trade Like Warren Buffett with James Altucher
1 × $6.00
Trade Like Warren Buffett with James Altucher
1 × $6.00 -
×
 The Master Indicator 2023 with Lance Ippolito
1 × $101.00
The Master Indicator 2023 with Lance Ippolito
1 × $101.00 -
×
 Understanding Spreads with Edward Dobson & Roger Reimer
1 × $6.00
Understanding Spreads with Edward Dobson & Roger Reimer
1 × $6.00 -
×
 The Bare Essentials Of Investing: Teaching The Horse To Talk with Harold Bierman
1 × $6.00
The Bare Essentials Of Investing: Teaching The Horse To Talk with Harold Bierman
1 × $6.00 -
×
 The Compleat DayTrader I & II with Jack Bernstein
1 × $6.00
The Compleat DayTrader I & II with Jack Bernstein
1 × $6.00 -
×
 Fibonacci Mastery Course: Complete Guide to Trading with Fib By Todd Gordon
1 × $62.00
Fibonacci Mastery Course: Complete Guide to Trading with Fib By Todd Gordon
1 × $62.00 -
×
 The Day Trading ES Futures Blueprint Class with Corey Rosenbloom
1 × $6.00
The Day Trading ES Futures Blueprint Class with Corey Rosenbloom
1 × $6.00 -
×
 The Taylor Trading Technique with G.Douglas Taylor
1 × $6.00
The Taylor Trading Technique with G.Douglas Taylor
1 × $6.00 -
×
 Pyrapoint with D.E.Hall
1 × $6.00
Pyrapoint with D.E.Hall
1 × $6.00 -
×
 Sun Tzu and the Art of War for Traders with Dean Lundell
1 × $6.00
Sun Tzu and the Art of War for Traders with Dean Lundell
1 × $6.00 -
×
 Generative AI for Asset Managers Workshop Recording with Ernest Chan
1 × $55.00
Generative AI for Asset Managers Workshop Recording with Ernest Chan
1 × $55.00 -
×
 Rockwell Trading - Money Management - 2 DVDs
1 × $6.00
Rockwell Trading - Money Management - 2 DVDs
1 × $6.00 -
×
 Small Account Options Trading Workshop Package with Doc Severson
1 × $6.00
Small Account Options Trading Workshop Package with Doc Severson
1 × $6.00 -
×
 Filtered Waves. Basic Theory with Arthur A.Merrill
1 × $7.00
Filtered Waves. Basic Theory with Arthur A.Merrill
1 × $7.00 -
×
 Harnessing Explosive Market Turns - 3 DVD with Jeff Greenblatt
1 × $6.00
Harnessing Explosive Market Turns - 3 DVD with Jeff Greenblatt
1 × $6.00 -
×
 Daily Market Review 2009-2012 (Video 16 GB) with David Vallieres
1 × $6.00
Daily Market Review 2009-2012 (Video 16 GB) with David Vallieres
1 × $6.00 -
×
 Investment Illusions with Martin S.Fridson
1 × $6.00
Investment Illusions with Martin S.Fridson
1 × $6.00 -
×
 How to Value & Sell your Business with Andrew Heslop
1 × $6.00
How to Value & Sell your Business with Andrew Heslop
1 × $6.00 -
×
 The Complete Guide to Market Breadth Indicators: How to Analyze and Evaluate market Direction and Strength - Greg Morris
1 × $6.00
The Complete Guide to Market Breadth Indicators: How to Analyze and Evaluate market Direction and Strength - Greg Morris
1 × $6.00 -
×
 The Risk-Wise Investor: How to Better Understand and Manage Risk with Michael Carpenter
1 × $6.00
The Risk-Wise Investor: How to Better Understand and Manage Risk with Michael Carpenter
1 × $6.00 -
×
 Confidence Game. How a Hadge Fund Manager Called Wall Street’s Bluff with Christine Richard
1 × $6.00
Confidence Game. How a Hadge Fund Manager Called Wall Street’s Bluff with Christine Richard
1 × $6.00 -
×
 HandBook of Parametric and Nonparametric Statistical Procedures with David J.Sheskin
1 × $6.00
HandBook of Parametric and Nonparametric Statistical Procedures with David J.Sheskin
1 × $6.00 -
×
 Portfolio Management in Practice with Christine Brentani
1 × $6.00
Portfolio Management in Practice with Christine Brentani
1 × $6.00 -
×
 Dynamic Time and Price Analysis of Market Trends with Bruce Gilmore
1 × $6.00
Dynamic Time and Price Analysis of Market Trends with Bruce Gilmore
1 × $6.00 -
×
 The Decision-Making Process and Forward with Peter Steidlmayer
1 × $4.00
The Decision-Making Process and Forward with Peter Steidlmayer
1 × $4.00 -
×
 FOUS4 with Cameron Fous
1 × $5.00
FOUS4 with Cameron Fous
1 × $5.00 -
×
 Price Analysis Webinar with Carolyn Boroden
1 × $6.00
Price Analysis Webinar with Carolyn Boroden
1 × $6.00 -
×
 Forex in Five Full Time Strategies for Part Time Traders (fxstreet.com) - Raghee Horner
1 × $6.00
Forex in Five Full Time Strategies for Part Time Traders (fxstreet.com) - Raghee Horner
1 × $6.00 -
×
 Stochastic Calculus with Alan Bain
1 × $6.00
Stochastic Calculus with Alan Bain
1 × $6.00 -
×
 White Phoenix’s The Smart (Money) Approach to Trading with Jayson Casper
1 × $39.00
White Phoenix’s The Smart (Money) Approach to Trading with Jayson Casper
1 × $39.00 -
×
 RSI Unleashed: Building a Comprehensive Trading Framework By Doc Severson
1 × $6.00
RSI Unleashed: Building a Comprehensive Trading Framework By Doc Severson
1 × $6.00 -
×
 Butterfly and Condor Workshop with Aeromir
1 × $15.00
Butterfly and Condor Workshop with Aeromir
1 × $15.00

Investor’s Guide to Charting By Alistair Blair
$6.00
File Size: Cooming soon!
Delivery Time: 1–12 hours
Media Type: Online Course
Content Proof: Watch Here!
You may check content proof of “Investor’s Guide to Charting By Alistair Blair” below:

Investor’s Guide to Charting By Alistair Blair
Introduction
Welcome to the ultimate guide to charting for investors, based on the insights from Alistair Blair. This article aims to provide you with a comprehensive understanding of charting, its importance in investment strategies, and practical tips to enhance your trading skills.
What is Charting?
Charting involves analyzing historical price movements of securities through various types of charts to predict future price movements. It is a fundamental aspect of technical analysis, helping investors make informed decisions.
Why Charting is Essential for Investors
Understanding chart patterns can provide valuable insights into market trends and potential future movements. This can help investors identify entry and exit points, manage risks, and maximize returns.
Types of Charts in Technical Analysis
1. Line Charts
Line charts plot closing prices over a specific period, providing a clear view of the overall trend.
2. Bar Charts
Bar charts display the opening, high, low, and closing prices for each period, giving a more detailed view of price movements.
3. Candlestick Charts
Candlestick charts also show the open, high, low, and close prices but in a more visually appealing format. They are widely used for identifying market patterns.
Key Chart Patterns Every Investor Should Know
1. Head and Shoulders
A reversal pattern that signals a change in trend direction.
2. Double Top and Double Bottom
These patterns indicate potential trend reversals, with the double top suggesting a bearish reversal and the double bottom a bullish reversal.
3. Triangles
Triangles can be ascending, descending, or symmetrical, and they signify continuation or reversal patterns depending on the breakout direction.
Using Indicators in Charting
1. Moving Averages
Moving averages smooth out price data to identify trends. The two most common types are the simple moving average (SMA) and the exponential moving average (EMA).
2. Relative Strength Index (RSI)
RSI measures the speed and change of price movements, helping to identify overbought or oversold conditions.
3. Moving Average Convergence Divergence (MACD)
MACD is a trend-following momentum indicator that shows the relationship between two moving averages.
How to Read Chart Patterns
1. Identifying Trends
Look for higher highs and higher lows for uptrends, and lower highs and lower lows for downtrends.
2. Support and Resistance Levels
Support levels indicate where a price might stop falling, while resistance levels show where a price might stop rising.
3. Volume Analysis
Volume can confirm the strength of a price movement. Higher volume during a price move suggests stronger conviction.
Charting Tools and Software
1. MetaTrader
A popular platform offering a wide range of charting tools and indicators.
2. TradingView
Known for its user-friendly interface and extensive community-driven analysis.
3. Thinkorswim
Provided by TD Ameritrade, it offers professional-level charting capabilities.
Common Mistakes in Charting
1. Overcomplicating Analysis
Stick to a few key indicators and patterns to avoid analysis paralysis.
2. Ignoring Volume
Always consider volume to validate price movements and trends.
3. Not Adjusting for Different Time Frames
Analyze multiple time frames to get a comprehensive view of the market.
Developing a Charting Strategy
1. Define Your Goals
Determine your investment goals and risk tolerance.
2. Backtesting
Test your strategy using historical data to ensure its effectiveness.
3. Stay Updated
Keep learning and adapting to new market conditions and charting techniques.
The Benefits of Using Alistair Blair’s Approach
Alistair Blair’s methodologies emphasize simplicity, clarity, and practical application. By focusing on essential patterns and indicators, investors can make more informed decisions without getting overwhelmed.
Conclusion
Charting is a powerful tool that, when used correctly, can significantly enhance your investment strategy. By following Alistair Blair’s guide, you can develop a robust understanding of charting, identify key patterns, and make informed trading decisions.

Frequently Asked Questions
1. What is the most important chart for beginners to start with?
For beginners, line charts are the easiest to understand and provide a good starting point for identifying trends.
2. How often should I analyze charts?
Regular analysis, such as daily or weekly reviews, can help you stay updated with market trends and make timely decisions.
3. Can charting predict market crashes?
While charting can indicate potential reversals and trends, it cannot predict market crashes with certainty.
4. What is the best charting software for beginners?
TradingView is highly recommended for beginners due to its user-friendly interface and extensive educational resources.
5. How do I combine multiple indicators in my analysis?
Start with a few key indicators, like moving averages and RSI, and gradually incorporate more as you become comfortable with your analysis.
Be the first to review “Investor’s Guide to Charting By Alistair Blair”
You must be logged in to post a review.
Related products
Forex Trading
Original price was: $1,898.00.$10.00Current price is: $10.00.

Original price was: $997.00.$8.00Current price is: $8.00.

Forex Trading
Original price was: $2,000.00.$23.00Current price is: $23.00.

Forex Trading
Original price was: $499.00.$15.00Current price is: $15.00.

Original price was: $799.00.$15.00Current price is: $15.00.

Forex Trading
Original price was: $239.00.$8.00Current price is: $8.00.
Forex Trading
Original price was: $799.00.$15.00Current price is: $15.00.

Original price was: $197.00.$5.00Current price is: $5.00.
Forex Trading
Original price was: $2,995.00.$31.00Current price is: $31.00.
Forex Trading
Original price was: $397.00.$31.00Current price is: $31.00.

Original price was: $997.00.$13.00Current price is: $13.00.

Forex Trading
Original price was: $2,997.00.$23.00Current price is: $23.00.

Forex Trading
Original price was: $4,997.00.$27.00Current price is: $27.00.

Forex Trading
Original price was: $797.00.$10.00Current price is: $10.00.

Original price was: $139.00.$23.00Current price is: $23.00.

Forex Trading
Original price was: $999.00.$15.00Current price is: $15.00.

Original price was: $1,849.00.$15.00Current price is: $15.00.

Original price was: $2,120.00.$15.00Current price is: $15.00.

Forex Trading
Quantamentals – The Next Great Forefront Of Trading and Investing with Trading Markets
Original price was: $1,495.00.$8.00Current price is: $8.00.

Original price was: $649.00.$20.00Current price is: $20.00.

Reviews
There are no reviews yet.