-
×
 Simpler Options - Ultimate Guide to Debit Spreads – Nov 2014
1 × $6.00
Simpler Options - Ultimate Guide to Debit Spreads – Nov 2014
1 × $6.00 -
×
 E75 Forex System with James de Wet
1 × $6.00
E75 Forex System with James de Wet
1 × $6.00 -
×
 Foundations of Forex Trading with TradeSmart University
1 × $6.00
Foundations of Forex Trading with TradeSmart University
1 × $6.00 -
×
 Investment Fables with Aswath Damodaran
1 × $6.00
Investment Fables with Aswath Damodaran
1 × $6.00 -
×
 Future DayTrading (German)
1 × $6.00
Future DayTrading (German)
1 × $6.00 -
×
 Day Trading and Swing Trading Futures with Price Action by Humberto Malaspina
1 × $5.00
Day Trading and Swing Trading Futures with Price Action by Humberto Malaspina
1 × $5.00 -
×
 Forex Strategy Course with Angel Traders
1 × $6.00
Forex Strategy Course with Angel Traders
1 × $6.00 -
×
 How to Analyze Multifamily Investment Opportunities with Symon He & Brandon Young
1 × $6.00
How to Analyze Multifamily Investment Opportunities with Symon He & Brandon Young
1 × $6.00 -
×
 Stock Market Rules (2nd Ed.) with Michael Sheimo
1 × $6.00
Stock Market Rules (2nd Ed.) with Michael Sheimo
1 × $6.00 -
×
 Tracking & Kalman Filtering Made Easy with Eli Brookner
1 × $6.00
Tracking & Kalman Filtering Made Easy with Eli Brookner
1 × $6.00 -
×
 Get 95% Win Rate With The Triple Candy Method - Eden
1 × $5.00
Get 95% Win Rate With The Triple Candy Method - Eden
1 × $5.00 -
×
 Forex Candlestick System. High Profit Forex Trading with B.M.Davis
1 × $6.00
Forex Candlestick System. High Profit Forex Trading with B.M.Davis
1 × $6.00 -
×
 Systems Trading for Spread Betting: An end-to-end guide for developing spread betting systems with Gary Ford
1 × $6.00
Systems Trading for Spread Betting: An end-to-end guide for developing spread betting systems with Gary Ford
1 × $6.00 -
×
 Profiletraders - Market Profile Day Trading
1 × $15.00
Profiletraders - Market Profile Day Trading
1 × $15.00 -
×
 The Aggressive Investor. Case Studies with Colin Nicholson
1 × $6.00
The Aggressive Investor. Case Studies with Colin Nicholson
1 × $6.00 -
×
 Swing Trading Systems Video Home Study, Presented with Ken Long - Van Tharp Institute
1 × $5.00
Swing Trading Systems Video Home Study, Presented with Ken Long - Van Tharp Institute
1 × $5.00 -
×
 Investment Madness with John Nofsinger
1 × $6.00
Investment Madness with John Nofsinger
1 × $6.00 -
×
 Handbook of Integral Equations with Andrei D.Polyanin, Alexander V.Manzhirov
1 × $6.00
Handbook of Integral Equations with Andrei D.Polyanin, Alexander V.Manzhirov
1 × $6.00 -
×
 Floor Traders Edge Mentorship Program with Market Geeks
1 × $6.00
Floor Traders Edge Mentorship Program with Market Geeks
1 × $6.00 -
×
 Swing Trading Futures & Commodities with the COT
1 × $93.00
Swing Trading Futures & Commodities with the COT
1 × $93.00 -
×
 AllStreet Investing - Master the Market LEVEL 2 - DAYTRADING
1 × $23.00
AllStreet Investing - Master the Market LEVEL 2 - DAYTRADING
1 × $23.00 -
×
 How to Avoid Tax on Your Stock Market Profits with Lee Hadnum
1 × $6.00
How to Avoid Tax on Your Stock Market Profits with Lee Hadnum
1 × $6.00 -
×
 Butterfly and Condor Workshop with Aeromir
1 × $15.00
Butterfly and Condor Workshop with Aeromir
1 × $15.00 -
×
 Practical Approach to Ninjatrader 8 Platform with Rajandran R
1 × $6.00
Practical Approach to Ninjatrader 8 Platform with Rajandran R
1 × $6.00 -
×
 Master Forex Fundamentals
1 × $15.00
Master Forex Fundamentals
1 × $15.00 -
×
 Day Trading For 50 Years PDF with Michael Jenkins
1 × $6.00
Day Trading For 50 Years PDF with Michael Jenkins
1 × $6.00 -
×
 Neural Networks in the Capital Markets with Apostolos Paul Refenes
1 × $6.00
Neural Networks in the Capital Markets with Apostolos Paul Refenes
1 × $6.00 -
×
 Psycho-Paper 96 with Charles Drummond
1 × $6.00
Psycho-Paper 96 with Charles Drummond
1 × $6.00 -
×
 Create Your Own ETF Hedge Fund: A Do-It-Yourself ETF Strategy for Private Wealth Management with David Fry
1 × $6.00
Create Your Own ETF Hedge Fund: A Do-It-Yourself ETF Strategy for Private Wealth Management with David Fry
1 × $6.00 -
×
 ProfileTraders - Swing and Price Analysis (May 2014)
1 × $6.00
ProfileTraders - Swing and Price Analysis (May 2014)
1 × $6.00 -
×
 How to Build Fortune. Trading Stock Index Futures with Dennis Minogue
1 × $6.00
How to Build Fortune. Trading Stock Index Futures with Dennis Minogue
1 × $6.00 -
×
 EFT – The Art of Delivery with Gary Craig
1 × $5.00
EFT – The Art of Delivery with Gary Craig
1 × $5.00 -
×
 P.A.T Trading Course (Low Video Quality) with Martin Cole
1 × $6.00
P.A.T Trading Course (Low Video Quality) with Martin Cole
1 × $6.00 -
×
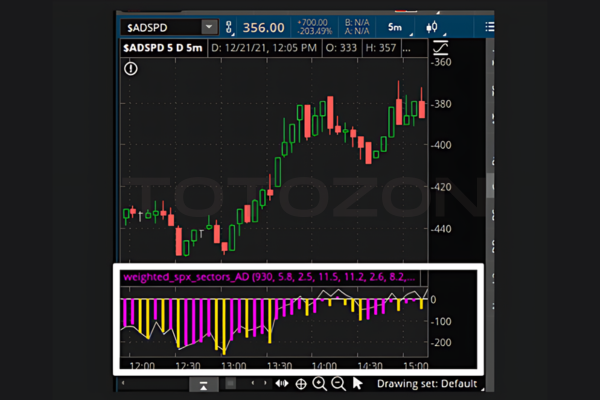 ShadowTrader Weighted S&P Advance Decline Line thinkScript with Peter Reznicek - ShadowTrader
1 × $23.00
ShadowTrader Weighted S&P Advance Decline Line thinkScript with Peter Reznicek - ShadowTrader
1 × $23.00 -
×
 Path to Profits By Scott Redler - T3 Live
1 × $6.00
Path to Profits By Scott Redler - T3 Live
1 × $6.00 -
×
 The Candlestick Training Series with Timon Weller
1 × $6.00
The Candlestick Training Series with Timon Weller
1 × $6.00 -
×
 ICT Prodigy Trading Course – $650K in Payouts with Alex Solignani
1 × $15.00
ICT Prodigy Trading Course – $650K in Payouts with Alex Solignani
1 × $15.00 -
×
 Simulating Continuous Fuzzy Systems with James Buckley & Leonard Jowers
1 × $6.00
Simulating Continuous Fuzzy Systems with James Buckley & Leonard Jowers
1 × $6.00 -
×
 Planetary Harmonics of Speculative Markets with Larry Pesavento
1 × $6.00
Planetary Harmonics of Speculative Markets with Larry Pesavento
1 × $6.00 -
×
 Stock Market Investing for Financial Independence & Retiring Early with Amon & Christina
1 × $15.00
Stock Market Investing for Financial Independence & Retiring Early with Amon & Christina
1 × $15.00 -
×
 Setups of a Winning Trader with Gareth Soloway
1 × $521.00
Setups of a Winning Trader with Gareth Soloway
1 × $521.00 -
×
 Traders Edge with Steven Dux
1 × $5.00
Traders Edge with Steven Dux
1 × $5.00 -
×
 Earnings Reaction Gaps Workshop with John Pocorobba
1 × $27.00
Earnings Reaction Gaps Workshop with John Pocorobba
1 × $27.00 -
×
 Forex Courses Collection
1 × $55.00
Forex Courses Collection
1 × $55.00 -
×
 TradeCraft: Your Path to Peak Performance Trading By Adam Grimes
1 × $15.00
TradeCraft: Your Path to Peak Performance Trading By Adam Grimes
1 × $15.00

Investor’s Guide to Charting By Alistair Blair
$6.00
File Size: Cooming soon!
Delivery Time: 1–12 hours
Media Type: Online Course
Content Proof: Watch Here!
You may check content proof of “Investor’s Guide to Charting By Alistair Blair” below:

Investor’s Guide to Charting By Alistair Blair
Introduction
Welcome to the ultimate guide to charting for investors, based on the insights from Alistair Blair. This article aims to provide you with a comprehensive understanding of charting, its importance in investment strategies, and practical tips to enhance your trading skills.
What is Charting?
Charting involves analyzing historical price movements of securities through various types of charts to predict future price movements. It is a fundamental aspect of technical analysis, helping investors make informed decisions.
Why Charting is Essential for Investors
Understanding chart patterns can provide valuable insights into market trends and potential future movements. This can help investors identify entry and exit points, manage risks, and maximize returns.
Types of Charts in Technical Analysis
1. Line Charts
Line charts plot closing prices over a specific period, providing a clear view of the overall trend.
2. Bar Charts
Bar charts display the opening, high, low, and closing prices for each period, giving a more detailed view of price movements.
3. Candlestick Charts
Candlestick charts also show the open, high, low, and close prices but in a more visually appealing format. They are widely used for identifying market patterns.
Key Chart Patterns Every Investor Should Know
1. Head and Shoulders
A reversal pattern that signals a change in trend direction.
2. Double Top and Double Bottom
These patterns indicate potential trend reversals, with the double top suggesting a bearish reversal and the double bottom a bullish reversal.
3. Triangles
Triangles can be ascending, descending, or symmetrical, and they signify continuation or reversal patterns depending on the breakout direction.
Using Indicators in Charting
1. Moving Averages
Moving averages smooth out price data to identify trends. The two most common types are the simple moving average (SMA) and the exponential moving average (EMA).
2. Relative Strength Index (RSI)
RSI measures the speed and change of price movements, helping to identify overbought or oversold conditions.
3. Moving Average Convergence Divergence (MACD)
MACD is a trend-following momentum indicator that shows the relationship between two moving averages.
How to Read Chart Patterns
1. Identifying Trends
Look for higher highs and higher lows for uptrends, and lower highs and lower lows for downtrends.
2. Support and Resistance Levels
Support levels indicate where a price might stop falling, while resistance levels show where a price might stop rising.
3. Volume Analysis
Volume can confirm the strength of a price movement. Higher volume during a price move suggests stronger conviction.
Charting Tools and Software
1. MetaTrader
A popular platform offering a wide range of charting tools and indicators.
2. TradingView
Known for its user-friendly interface and extensive community-driven analysis.
3. Thinkorswim
Provided by TD Ameritrade, it offers professional-level charting capabilities.
Common Mistakes in Charting
1. Overcomplicating Analysis
Stick to a few key indicators and patterns to avoid analysis paralysis.
2. Ignoring Volume
Always consider volume to validate price movements and trends.
3. Not Adjusting for Different Time Frames
Analyze multiple time frames to get a comprehensive view of the market.
Developing a Charting Strategy
1. Define Your Goals
Determine your investment goals and risk tolerance.
2. Backtesting
Test your strategy using historical data to ensure its effectiveness.
3. Stay Updated
Keep learning and adapting to new market conditions and charting techniques.
The Benefits of Using Alistair Blair’s Approach
Alistair Blair’s methodologies emphasize simplicity, clarity, and practical application. By focusing on essential patterns and indicators, investors can make more informed decisions without getting overwhelmed.
Conclusion
Charting is a powerful tool that, when used correctly, can significantly enhance your investment strategy. By following Alistair Blair’s guide, you can develop a robust understanding of charting, identify key patterns, and make informed trading decisions.

Frequently Asked Questions
1. What is the most important chart for beginners to start with?
For beginners, line charts are the easiest to understand and provide a good starting point for identifying trends.
2. How often should I analyze charts?
Regular analysis, such as daily or weekly reviews, can help you stay updated with market trends and make timely decisions.
3. Can charting predict market crashes?
While charting can indicate potential reversals and trends, it cannot predict market crashes with certainty.
4. What is the best charting software for beginners?
TradingView is highly recommended for beginners due to its user-friendly interface and extensive educational resources.
5. How do I combine multiple indicators in my analysis?
Start with a few key indicators, like moving averages and RSI, and gradually incorporate more as you become comfortable with your analysis.
Be the first to review “Investor’s Guide to Charting By Alistair Blair”
You must be logged in to post a review.
Related products

Original price was: $1,849.00.$15.00Current price is: $15.00.
Forex Trading
Original price was: $1,898.00.$10.00Current price is: $10.00.

Original price was: $799.00.$15.00Current price is: $15.00.

Original price was: $299.00.$8.00Current price is: $8.00.

Original price was: $1,800.00.$54.00Current price is: $54.00.
Original price was: $2,120.00.$15.00Current price is: $15.00.

Original price was: $649.00.$20.00Current price is: $20.00.

Original price was: $450.00.$23.00Current price is: $23.00.

Original price was: $997.00.$8.00Current price is: $8.00.

Forex Trading
Original price was: $2,997.00.$23.00Current price is: $23.00.

Forex Trading
Original price was: $499.00.$15.00Current price is: $15.00.

Original price was: $497.00.$11.00Current price is: $11.00.

Original price was: $197.00.$5.00Current price is: $5.00.

Original price was: $700.00.$39.00Current price is: $39.00.

Forex Trading
Original price was: $1,098.00.$39.00Current price is: $39.00.

Original price was: $999.00.$5.00Current price is: $5.00.

Forex Trading
The Complete Guide to Multiple Time Frame Analysis & Reading Price Action with Aiman Almansoori
Original price was: $1,399.00.$13.00Current price is: $13.00.
Original price was: $4,995.00.$15.00Current price is: $15.00.

Forex Trading
Original price was: $850.00.$23.00Current price is: $23.00.

Original price was: $895.00.$15.00Current price is: $15.00.

Reviews
There are no reviews yet.