-
×
 TradeCraft: Your Path to Peak Performance Trading By Adam Grimes
1 × $15.00
TradeCraft: Your Path to Peak Performance Trading By Adam Grimes
1 × $15.00 -
×
 0 DTE Options Trading Workshop with Aeromir Corporation
1 × $15.00
0 DTE Options Trading Workshop with Aeromir Corporation
1 × $15.00 -
×
 The Trading Blueprint with Brad Goh - The Trading Geek
1 × $5.00
The Trading Blueprint with Brad Goh - The Trading Geek
1 × $5.00 -
×
 The A14 Weekly Option Strategy Workshop with Amy Meissner
1 × $23.00
The A14 Weekly Option Strategy Workshop with Amy Meissner
1 × $23.00 -
×
 The Best Option Trading Course with David Jaffee - Best Stock Strategy
1 × $15.00
The Best Option Trading Course with David Jaffee - Best Stock Strategy
1 × $15.00 -
×
 The Naked Eye: Raw Data Analytics with Edgar Torres - Raw Data Analytics
1 × $8.00
The Naked Eye: Raw Data Analytics with Edgar Torres - Raw Data Analytics
1 × $8.00 -
×
 Jeffrey Kennedy’s Package ( Discount 25% )
1 × $31.00
Jeffrey Kennedy’s Package ( Discount 25% )
1 × $31.00 -
×
 How To Read The Market Professionally with TradeSmart
1 × $27.00
How To Read The Market Professionally with TradeSmart
1 × $27.00 -
×
 Analysis Of Entry Signals (Technicals) with Joe Marwood
1 × $15.00
Analysis Of Entry Signals (Technicals) with Joe Marwood
1 × $15.00 -
×
 Trading Short TermSame Day Trades Sep 2023 with Dan Sheridan & Mark Fenton - Sheridan Options Mentoring
1 × $31.00
Trading Short TermSame Day Trades Sep 2023 with Dan Sheridan & Mark Fenton - Sheridan Options Mentoring
1 × $31.00 -
×
 The Orderflow Masterclass with PrimeTrading
1 × $17.00
The Orderflow Masterclass with PrimeTrading
1 × $17.00 -
×
 Essentials in Quantitative Trading QT01 By HangukQuant's
1 × $23.00
Essentials in Quantitative Trading QT01 By HangukQuant's
1 × $23.00 -
×
 Fractal Markets FX (SMC)
1 × $5.00
Fractal Markets FX (SMC)
1 × $5.00 -
×
 Best of the Best: Collars with Amy Meissner & Scott Ruble
1 × $15.00
Best of the Best: Collars with Amy Meissner & Scott Ruble
1 × $15.00 -
×
 Trading for a Living with Alexander Elder
1 × $6.00
Trading for a Living with Alexander Elder
1 × $6.00 -
×
 AI For Traders with Trading Markets
1 × $31.00
AI For Traders with Trading Markets
1 × $31.00 -
×
 $20 – 52k 20 pips a day challange with Rafał Zuchowicz - TopMasterTrader
1 × $5.00
$20 – 52k 20 pips a day challange with Rafał Zuchowicz - TopMasterTrader
1 × $5.00 -
×
 Cheatcode Trend System with Dominique Woodson
1 × $15.00
Cheatcode Trend System with Dominique Woodson
1 × $15.00 -
×
 Options Trading & Ultimate MasterClass With Tyrone Abela - FX Evolution
1 × $54.00
Options Trading & Ultimate MasterClass With Tyrone Abela - FX Evolution
1 × $54.00 -
×
 The Orderflows Trade Opportunities Encyclopedia with Michael Valtos
1 × $8.00
The Orderflows Trade Opportunities Encyclopedia with Michael Valtos
1 × $8.00 -
×
 Arjoio’s MMT - Essential Package
1 × $5.00
Arjoio’s MMT - Essential Package
1 × $5.00 -
×
 Adx Mastery Complete Course
1 × $6.00
Adx Mastery Complete Course
1 × $6.00 -
×
 The Prop Trading Code with Brannigan Barrett - Axia Futures
1 × $23.00
The Prop Trading Code with Brannigan Barrett - Axia Futures
1 × $23.00 -
×
 Quantamentals - The Next Great Forefront Of Trading and Investing with Trading Markets
1 × $8.00
Quantamentals - The Next Great Forefront Of Trading and Investing with Trading Markets
1 × $8.00 -
×
 Matrix Spread Options Trading Course with Base Camp Trading
1 × $31.00
Matrix Spread Options Trading Course with Base Camp Trading
1 × $31.00 -
×
 Crypto Trading Academy with Cheeky Investor - Aussie Day Trader
1 × $13.00
Crypto Trading Academy with Cheeky Investor - Aussie Day Trader
1 × $13.00 -
×
 Forecast 2024 Clarification with Larry Williams
1 × $15.00
Forecast 2024 Clarification with Larry Williams
1 × $15.00 -
×
 Squeeze Pro Indicator + Buy/Sell Signals (PREMIUM)
1 × $85.00
Squeeze Pro Indicator + Buy/Sell Signals (PREMIUM)
1 × $85.00 -
×
 High Probability Trading Using Elliott Wave And Fibonacci Analysis withVic Patel - Forex Training Group
1 × $10.00
High Probability Trading Using Elliott Wave And Fibonacci Analysis withVic Patel - Forex Training Group
1 × $10.00 -
×
 The Complete Guide to Multiple Time Frame Analysis & Reading Price Action with Aiman Almansoori
1 × $13.00
The Complete Guide to Multiple Time Frame Analysis & Reading Price Action with Aiman Almansoori
1 × $13.00 -
×
 Butterfly and Condor Workshop with Aeromir
1 × $15.00
Butterfly and Condor Workshop with Aeromir
1 × $15.00 -
×
 Candlestick Trading for Maximum Profitsn with B.M.Davis
1 × $6.00
Candlestick Trading for Maximum Profitsn with B.M.Davis
1 × $6.00 -
×
 Foolproof Forex Trading with Louise Woof
1 × $6.00
Foolproof Forex Trading with Louise Woof
1 × $6.00 -
×
 Forecasting Profits Using Price & Time with Ed Gately
1 × $6.00
Forecasting Profits Using Price & Time with Ed Gately
1 × $6.00 -
×
 Power Price Action Trading - 8 Weeks Online Training
1 × $6.00
Power Price Action Trading - 8 Weeks Online Training
1 × $6.00 -
×
 Sharp Edge Institutional Ultimate Trade Program – CompassFX
1 × $101.00
Sharp Edge Institutional Ultimate Trade Program – CompassFX
1 × $101.00 -
×
 Futures Day Trading And Order Flow Course with Trade Pro Academy
1 × $15.00
Futures Day Trading And Order Flow Course with Trade Pro Academy
1 × $15.00 -
×
 Quantitative Technical Analysis: An integrated approach to trading system development and trading management
1 × $6.00
Quantitative Technical Analysis: An integrated approach to trading system development and trading management
1 × $6.00 -
×
 Futures Trading Mastery 2022 | FREE Top 45 Trading Signals!
1 × $5.00
Futures Trading Mastery 2022 | FREE Top 45 Trading Signals!
1 × $5.00 -
×
 Sharp Edge Institutional Trading Program 2022 (No indicators) with CompassFX
1 × $139.00
Sharp Edge Institutional Trading Program 2022 (No indicators) with CompassFX
1 × $139.00 -
×
 Forex & Fibonacci Day Trading Seminar - $695
1 × $6.00
Forex & Fibonacci Day Trading Seminar - $695
1 × $6.00 -
×
 TECHNICAL ANALYSIS MODULE
1 × $6.00
TECHNICAL ANALYSIS MODULE
1 × $6.00 -
×
 Investments (6th Ed.)
1 × $6.00
Investments (6th Ed.)
1 × $6.00 -
×
 Advanced Spread Trading with Guy Bower - MasterClass Trader
1 × $15.00
Advanced Spread Trading with Guy Bower - MasterClass Trader
1 × $15.00 -
×
 TRADING NFX Course with Andrew NFX
1 × $5.00
TRADING NFX Course with Andrew NFX
1 × $5.00 -
×
 Ultimate Trading Course with Dodgy's Dungeon
1 × $8.00
Ultimate Trading Course with Dodgy's Dungeon
1 × $8.00 -
×
 Bond Market Course with The Macro Compass
1 × $15.00
Bond Market Course with The Macro Compass
1 × $15.00 -
×
 The Indices Orderflow Masterclass with The Forex Scalpers
1 × $23.00
The Indices Orderflow Masterclass with The Forex Scalpers
1 × $23.00 -
×
 Algo Trading Masterclass with Ali Casey - StatOasis
1 × $23.00
Algo Trading Masterclass with Ali Casey - StatOasis
1 × $23.00 -
×
 E-mini Weekly Options Income with Peter Titus
1 × $15.00
E-mini Weekly Options Income with Peter Titus
1 × $15.00 -
×
 Order flow self-study training program with iMFtracker
1 × $10.00
Order flow self-study training program with iMFtracker
1 × $10.00 -
×
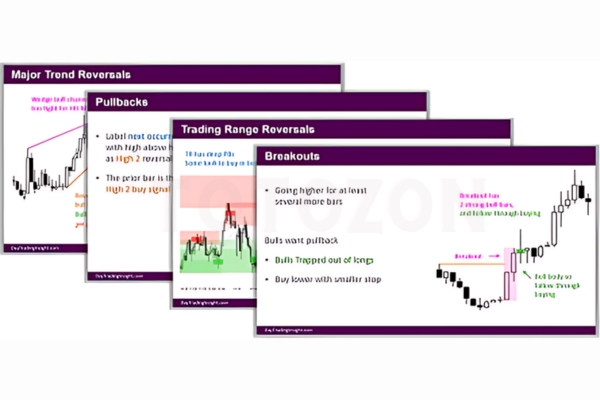 Day Trading Insight with Al Brooks
1 × $10.00
Day Trading Insight with Al Brooks
1 × $10.00 -
×
 Tenkei Trading Techniques Programme with Wilson P.Williams
1 × $6.00
Tenkei Trading Techniques Programme with Wilson P.Williams
1 × $6.00 -
×
 Compass Trading System with Right Line Trading
1 × $39.00
Compass Trading System with Right Line Trading
1 × $39.00 -
×
 Spike 35 Traders Manual with J.D.Hamon
1 × $6.00
Spike 35 Traders Manual with J.D.Hamon
1 × $6.00 -
×
 WondaFX Signature Strategy with WondaFX
1 × $5.00
WondaFX Signature Strategy with WondaFX
1 × $5.00 -
×
 Scalp Strategy and Flipping Small Accounts with Opes Trading Group
1 × $5.00
Scalp Strategy and Flipping Small Accounts with Opes Trading Group
1 × $5.00 -
×
 Pentagonal Time Cycle Theory
1 × $6.00
Pentagonal Time Cycle Theory
1 × $6.00 -
×
 White Phoenix’s The Smart (Money) Approach to Trading with Jayson Casper
1 × $39.00
White Phoenix’s The Smart (Money) Approach to Trading with Jayson Casper
1 × $39.00 -
×
 Pring on Price Patterns with Martin Pring
1 × $6.00
Pring on Price Patterns with Martin Pring
1 × $6.00 -
×
 Investment Mathematics with Andrew Adams
1 × $6.00
Investment Mathematics with Andrew Adams
1 × $6.00 -
×
 Complete Trading Course with Sean Dekmar
1 × $5.00
Complete Trading Course with Sean Dekmar
1 × $5.00 -
×
 Investing Online with Benton E.Gup
1 × $6.00
Investing Online with Benton E.Gup
1 × $6.00 -
×
 Seven Trading Systems for The S&P Futures with David Bean
1 × $6.00
Seven Trading Systems for The S&P Futures with David Bean
1 × $6.00 -
×
 Marder Videos Reports 2019 with Kevin Marder
1 × $34.00
Marder Videos Reports 2019 with Kevin Marder
1 × $34.00 -
×
 Get Rich with Dividends
1 × $6.00
Get Rich with Dividends
1 × $6.00 -
×
 The Greatest Trade Ever with Gregory Zuckerman
1 × $6.00
The Greatest Trade Ever with Gregory Zuckerman
1 × $6.00 -
×
 W. D Gann 's Square Of 9 Applied To Modern Markets with Sean Avidar - Hexatrade350
1 × $23.00
W. D Gann 's Square Of 9 Applied To Modern Markets with Sean Avidar - Hexatrade350
1 × $23.00 -
×
 Master The Markets 2.0 with French Trader
1 × $6.00
Master The Markets 2.0 with French Trader
1 × $6.00 -
×
 SQX Mentorship with Tip Toe Hippo
1 × $23.00
SQX Mentorship with Tip Toe Hippo
1 × $23.00

Investor’s Guide to Charting By Alistair Blair
$6.00
File Size: Cooming soon!
Delivery Time: 1–12 hours
Media Type: Online Course
Content Proof: Watch Here!
You may check content proof of “Investor’s Guide to Charting By Alistair Blair” below:

Investor’s Guide to Charting By Alistair Blair
Introduction
Welcome to the ultimate guide to charting for investors, based on the insights from Alistair Blair. This article aims to provide you with a comprehensive understanding of charting, its importance in investment strategies, and practical tips to enhance your trading skills.
What is Charting?
Charting involves analyzing historical price movements of securities through various types of charts to predict future price movements. It is a fundamental aspect of technical analysis, helping investors make informed decisions.
Why Charting is Essential for Investors
Understanding chart patterns can provide valuable insights into market trends and potential future movements. This can help investors identify entry and exit points, manage risks, and maximize returns.
Types of Charts in Technical Analysis
1. Line Charts
Line charts plot closing prices over a specific period, providing a clear view of the overall trend.
2. Bar Charts
Bar charts display the opening, high, low, and closing prices for each period, giving a more detailed view of price movements.
3. Candlestick Charts
Candlestick charts also show the open, high, low, and close prices but in a more visually appealing format. They are widely used for identifying market patterns.
Key Chart Patterns Every Investor Should Know
1. Head and Shoulders
A reversal pattern that signals a change in trend direction.
2. Double Top and Double Bottom
These patterns indicate potential trend reversals, with the double top suggesting a bearish reversal and the double bottom a bullish reversal.
3. Triangles
Triangles can be ascending, descending, or symmetrical, and they signify continuation or reversal patterns depending on the breakout direction.
Using Indicators in Charting
1. Moving Averages
Moving averages smooth out price data to identify trends. The two most common types are the simple moving average (SMA) and the exponential moving average (EMA).
2. Relative Strength Index (RSI)
RSI measures the speed and change of price movements, helping to identify overbought or oversold conditions.
3. Moving Average Convergence Divergence (MACD)
MACD is a trend-following momentum indicator that shows the relationship between two moving averages.
How to Read Chart Patterns
1. Identifying Trends
Look for higher highs and higher lows for uptrends, and lower highs and lower lows for downtrends.
2. Support and Resistance Levels
Support levels indicate where a price might stop falling, while resistance levels show where a price might stop rising.
3. Volume Analysis
Volume can confirm the strength of a price movement. Higher volume during a price move suggests stronger conviction.
Charting Tools and Software
1. MetaTrader
A popular platform offering a wide range of charting tools and indicators.
2. TradingView
Known for its user-friendly interface and extensive community-driven analysis.
3. Thinkorswim
Provided by TD Ameritrade, it offers professional-level charting capabilities.
Common Mistakes in Charting
1. Overcomplicating Analysis
Stick to a few key indicators and patterns to avoid analysis paralysis.
2. Ignoring Volume
Always consider volume to validate price movements and trends.
3. Not Adjusting for Different Time Frames
Analyze multiple time frames to get a comprehensive view of the market.
Developing a Charting Strategy
1. Define Your Goals
Determine your investment goals and risk tolerance.
2. Backtesting
Test your strategy using historical data to ensure its effectiveness.
3. Stay Updated
Keep learning and adapting to new market conditions and charting techniques.
The Benefits of Using Alistair Blair’s Approach
Alistair Blair’s methodologies emphasize simplicity, clarity, and practical application. By focusing on essential patterns and indicators, investors can make more informed decisions without getting overwhelmed.
Conclusion
Charting is a powerful tool that, when used correctly, can significantly enhance your investment strategy. By following Alistair Blair’s guide, you can develop a robust understanding of charting, identify key patterns, and make informed trading decisions.

Frequently Asked Questions
1. What is the most important chart for beginners to start with?
For beginners, line charts are the easiest to understand and provide a good starting point for identifying trends.
2. How often should I analyze charts?
Regular analysis, such as daily or weekly reviews, can help you stay updated with market trends and make timely decisions.
3. Can charting predict market crashes?
While charting can indicate potential reversals and trends, it cannot predict market crashes with certainty.
4. What is the best charting software for beginners?
TradingView is highly recommended for beginners due to its user-friendly interface and extensive educational resources.
5. How do I combine multiple indicators in my analysis?
Start with a few key indicators, like moving averages and RSI, and gradually incorporate more as you become comfortable with your analysis.
Be the first to review “Investor’s Guide to Charting By Alistair Blair”
You must be logged in to post a review.
Related products
Original price was: $1,849.00.$15.00Current price is: $15.00.
Forex Trading
Original price was: $249.00.$15.00Current price is: $15.00.
Original price was: $1,800.00.$54.00Current price is: $54.00.
Original price was: $197.00.$5.00Current price is: $5.00.

Original price was: $497.00.$11.00Current price is: $11.00.
Original price was: $450.00.$23.00Current price is: $23.00.

Original price was: $695.00.$41.00Current price is: $41.00.
Forex Trading
Original price was: $1,098.00.$39.00Current price is: $39.00.
Forex Trading
Quantamentals – The Next Great Forefront Of Trading and Investing with Trading Markets
Original price was: $1,495.00.$8.00Current price is: $8.00.
Forex Trading
Original price was: $999.00.$15.00Current price is: $15.00.

Original price was: $2,120.00.$15.00Current price is: $15.00.
Forex Trading
Original price was: $799.00.$15.00Current price is: $15.00.
Forex Trading
Original price was: $550.00.$5.00Current price is: $5.00.
Forex Trading
Original price was: $239.00.$8.00Current price is: $8.00.
Original price was: $1,200.00.$23.00Current price is: $23.00.
Forex Trading
Original price was: $4,997.00.$27.00Current price is: $27.00.
Original price was: $299.00.$8.00Current price is: $8.00.
Original price was: $497.00.$31.00Current price is: $31.00.
Original price was: $997.00.$8.00Current price is: $8.00.
Original price was: $895.00.$15.00Current price is: $15.00.

Reviews
There are no reviews yet.