-
×
 The Beginners Guide to Commodities Investing with Brian & Gayle Rice
1 × $6.00
The Beginners Guide to Commodities Investing with Brian & Gayle Rice
1 × $6.00 -
×
 Simpler Options - Weekly Butterflies for Income
1 × $6.00
Simpler Options - Weekly Butterflies for Income
1 × $6.00 -
×
 Forecasting Profits Using Price & Time with Ed Gately
1 × $6.00
Forecasting Profits Using Price & Time with Ed Gately
1 × $6.00 -
×
 How to Profit in Gold with Jonathan Spall
1 × $6.00
How to Profit in Gold with Jonathan Spall
1 × $6.00 -
×
 Financial Freedom Mastery Course with Freedom Team Trading
1 × $31.00
Financial Freedom Mastery Course with Freedom Team Trading
1 × $31.00 -
×
 Investment Science with David G.Luenberger
1 × $6.00
Investment Science with David G.Luenberger
1 × $6.00 -
×
 NASDAQ Level II Trading Strategies
1 × $6.00
NASDAQ Level II Trading Strategies
1 × $6.00 -
×
 SQX Mentorship with Tip Toe Hippo
1 × $23.00
SQX Mentorship with Tip Toe Hippo
1 × $23.00 -
×
 Super CD Companion for Metastock with Martin Pring
1 × $6.00
Super CD Companion for Metastock with Martin Pring
1 × $6.00 -
×
 How To Successfully Trade The Haggerty Slim Jim Strategy for Explosive Gains with Kevin Haggerty
1 × $6.00
How To Successfully Trade The Haggerty Slim Jim Strategy for Explosive Gains with Kevin Haggerty
1 × $6.00 -
×
 Mutual Funds: Fifty Years of Research Findings by Seth C. Anderson
1 × $6.00
Mutual Funds: Fifty Years of Research Findings by Seth C. Anderson
1 × $6.00 -
×
 Online Investing Hacks with Bonnie Biafore
1 × $6.00
Online Investing Hacks with Bonnie Biafore
1 × $6.00 -
×
 How To Backtest Bootcamp
1 × $17.00
How To Backtest Bootcamp
1 × $17.00 -
×
 Investor’s Guide to Charting By Alistair Blair
1 × $6.00
Investor’s Guide to Charting By Alistair Blair
1 × $6.00 -
×
 Intra-day Solar Trader with George Harrison
1 × $17.00
Intra-day Solar Trader with George Harrison
1 × $17.00 -
×
 Private Mentorship with ANICO Capital
1 × $10.00
Private Mentorship with ANICO Capital
1 × $10.00 -
×
 A Working Man's Forex Position Trading System 2010 with Alan Benefield
1 × $6.00
A Working Man's Forex Position Trading System 2010 with Alan Benefield
1 × $6.00 -
×
 Stock Market Crash of 1929 with Aron Abrams
1 × $6.00
Stock Market Crash of 1929 with Aron Abrams
1 × $6.00 -
×
 Master Forex Fundamentals
1 × $15.00
Master Forex Fundamentals
1 × $15.00 -
×
 Volume Profile 2023 (Elite Pack) with Trader Dale
1 × $5.00
Volume Profile 2023 (Elite Pack) with Trader Dale
1 × $5.00 -
×
 RSI Basic with Andrew Cardwell
1 × $54.00
RSI Basic with Andrew Cardwell
1 × $54.00 -
×
 Yin Yang Forex Training Program
1 × $85.00
Yin Yang Forex Training Program
1 × $85.00 -
×
 Pattern Recognition: A Fundamental Introduction to Japanese Candlestick Charting Techniques Class with Jeff Bierman
1 × $6.00
Pattern Recognition: A Fundamental Introduction to Japanese Candlestick Charting Techniques Class with Jeff Bierman
1 × $6.00 -
×
 The Compleat DayTrader I & II with Jack Bernstein
1 × $6.00
The Compleat DayTrader I & II with Jack Bernstein
1 × $6.00 -
×
 How to Spot a Trade Before it Happens (marketsmastered.com) with Markets Mastered
1 × $6.00
How to Spot a Trade Before it Happens (marketsmastered.com) with Markets Mastered
1 × $6.00 -
×
 The 10%ers with Trader Mike
1 × $5.00
The 10%ers with Trader Mike
1 × $5.00 -
×
 The 3 Dimensional Trading Breakthrough with Brian Schad
1 × $6.00
The 3 Dimensional Trading Breakthrough with Brian Schad
1 × $6.00 -
×
 60 Seconds Sure Shot Strategy with Albert E
1 × $6.00
60 Seconds Sure Shot Strategy with Albert E
1 × $6.00 -
×
 Forex Wave Theory: A Technical Analysis for Spot and Futures Curency Traders - James Bickford
1 × $6.00
Forex Wave Theory: A Technical Analysis for Spot and Futures Curency Traders - James Bickford
1 × $6.00 -
×
 Advanced Calculus with Applications in Statistics
1 × $6.00
Advanced Calculus with Applications in Statistics
1 × $6.00 -
×
 ETFs for the Long Run: What They Are, How They Work, and Simple Strategies for Successful Long-Term Investing - Lawrence Carrel
1 × $6.00
ETFs for the Long Run: What They Are, How They Work, and Simple Strategies for Successful Long-Term Investing - Lawrence Carrel
1 × $6.00 -
×
 501 Stock Market Tips & Guidelines with Arshad Khan
1 × $6.00
501 Stock Market Tips & Guidelines with Arshad Khan
1 × $6.00 -
×
 A Mathematician Plays The Stock Market with John Allen Paulos
1 × $6.00
A Mathematician Plays The Stock Market with John Allen Paulos
1 × $6.00 -
×
 Profits in the Stock Market with Harold Gartley
1 × $6.00
Profits in the Stock Market with Harold Gartley
1 × $6.00 -
×
 The Orderflows Trade Opportunities Encyclopedia with Michael Valtos
1 × $8.00
The Orderflows Trade Opportunities Encyclopedia with Michael Valtos
1 × $8.00 -
×
 Fundamentals Trading
1 × $6.00
Fundamentals Trading
1 × $6.00 -
×
 How to Value & Sell your Business with Andrew Heslop
1 × $6.00
How to Value & Sell your Business with Andrew Heslop
1 × $6.00 -
×
 The Raptor 10 Momentum Methodology Course
1 × $6.00
The Raptor 10 Momentum Methodology Course
1 × $6.00 -
×
 Essentials in Quantitative Trading QT01 By HangukQuant's
1 × $23.00
Essentials in Quantitative Trading QT01 By HangukQuant's
1 × $23.00 -
×
 Advanced Forex Mastery Course with Alpha Forex Global
1 × $5.00
Advanced Forex Mastery Course with Alpha Forex Global
1 × $5.00 -
×
 Simpler Options - Ultimate Guide to Debit Spreads – Nov 2014
1 × $6.00
Simpler Options - Ultimate Guide to Debit Spreads – Nov 2014
1 × $6.00 -
×
 The Prop Trading Code with Brannigan Barrett - Axia Futures
1 × $23.00
The Prop Trading Code with Brannigan Barrett - Axia Futures
1 × $23.00 -
×
 Risk Management with Aswath Damodaran
1 × $6.00
Risk Management with Aswath Damodaran
1 × $6.00 -
×
 Rule Based Price Action with Trader Divergent
1 × $5.00
Rule Based Price Action with Trader Divergent
1 × $5.00 -
×
 Cycle Hunter Support with Brian James Sklenka
1 × $6.00
Cycle Hunter Support with Brian James Sklenka
1 × $6.00 -
×
 Developing Mindfulness: The Observer of Thought with Traders State Of Mind
1 × $6.00
Developing Mindfulness: The Observer of Thought with Traders State Of Mind
1 × $6.00 -
×
 EFT for Prevention and Treatment of Serious Diseases with Kari Dawson
1 × $6.00
EFT for Prevention and Treatment of Serious Diseases with Kari Dawson
1 × $6.00 -
×
 Trading MoneyTides & Chaos in the Stock Market with Hans Hannula
1 × $6.00
Trading MoneyTides & Chaos in the Stock Market with Hans Hannula
1 × $6.00 -
×
 MAP. Moving Average Patterns CD with David Elliott
1 × $6.00
MAP. Moving Average Patterns CD with David Elliott
1 × $6.00 -
×
 How to Pick Hot Reverse Merger Penny Stocks with John Lux
1 × $5.00
How to Pick Hot Reverse Merger Penny Stocks with John Lux
1 × $5.00 -
×
 Professional Swing Trading College with Steven Primo
1 × $15.00
Professional Swing Trading College with Steven Primo
1 × $15.00 -
×
 Market Stalkers Level 3 - Intraday Trading University
1 × $8.00
Market Stalkers Level 3 - Intraday Trading University
1 × $8.00 -
×
 SRC (Smart Raja Concepts) with Forex 101
1 × $5.00
SRC (Smart Raja Concepts) with Forex 101
1 × $5.00 -
×
 EFT – The Art of Delivery with Gary Craig
1 × $5.00
EFT – The Art of Delivery with Gary Craig
1 × $5.00 -
×
 Swing Trader Pro with Top Trade Tools
1 × $54.00
Swing Trader Pro with Top Trade Tools
1 × $54.00 -
×
 How To Read The Market Professionally with TradeSmart
1 × $27.00
How To Read The Market Professionally with TradeSmart
1 × $27.00 -
×
 Sang Lucci Master Course 2021 with Sang Lucci
1 × $6.00
Sang Lucci Master Course 2021 with Sang Lucci
1 × $6.00 -
×
 The Delphi Scalper 4 - Video + Metatrader Indicators with Jason Fielder
1 × $6.00
The Delphi Scalper 4 - Video + Metatrader Indicators with Jason Fielder
1 × $6.00 -
×
 Crystal Ball Pack PLUS bonus Live Trade By Pat Mitchell - Trick Trades
1 × $20.00
Crystal Ball Pack PLUS bonus Live Trade By Pat Mitchell - Trick Trades
1 × $20.00
Investor’s Guide to Charting By Alistair Blair
$6.00
File Size: Cooming soon!
Delivery Time: 1–12 hours
Media Type: Online Course
Content Proof: Watch Here!
You may check content proof of “Investor’s Guide to Charting By Alistair Blair” below:

Investor’s Guide to Charting By Alistair Blair
Introduction
Welcome to the ultimate guide to charting for investors, based on the insights from Alistair Blair. This article aims to provide you with a comprehensive understanding of charting, its importance in investment strategies, and practical tips to enhance your trading skills.
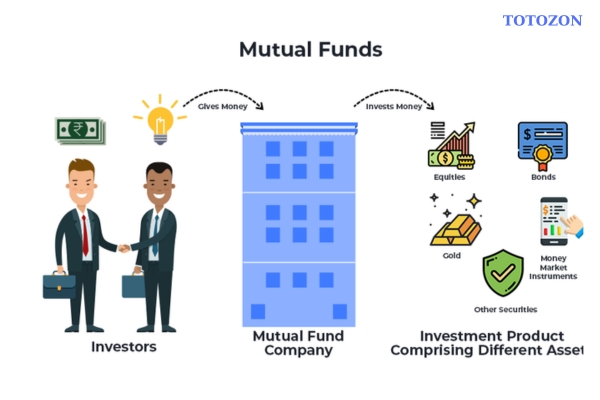
What is Charting?
Charting involves analyzing historical price movements of securities through various types of charts to predict future price movements. It is a fundamental aspect of technical analysis, helping investors make informed decisions.
Why Charting is Essential for Investors
Understanding chart patterns can provide valuable insights into market trends and potential future movements. This can help investors identify entry and exit points, manage risks, and maximize returns.
Types of Charts in Technical Analysis
1. Line Charts
Line charts plot closing prices over a specific period, providing a clear view of the overall trend.
2. Bar Charts
Bar charts display the opening, high, low, and closing prices for each period, giving a more detailed view of price movements.
3. Candlestick Charts
Candlestick charts also show the open, high, low, and close prices but in a more visually appealing format. They are widely used for identifying market patterns.
Key Chart Patterns Every Investor Should Know
1. Head and Shoulders
A reversal pattern that signals a change in trend direction.
2. Double Top and Double Bottom
These patterns indicate potential trend reversals, with the double top suggesting a bearish reversal and the double bottom a bullish reversal.
3. Triangles
Triangles can be ascending, descending, or symmetrical, and they signify continuation or reversal patterns depending on the breakout direction.
Using Indicators in Charting
1. Moving Averages
Moving averages smooth out price data to identify trends. The two most common types are the simple moving average (SMA) and the exponential moving average (EMA).
2. Relative Strength Index (RSI)
RSI measures the speed and change of price movements, helping to identify overbought or oversold conditions.
3. Moving Average Convergence Divergence (MACD)
MACD is a trend-following momentum indicator that shows the relationship between two moving averages.
How to Read Chart Patterns
1. Identifying Trends
Look for higher highs and higher lows for uptrends, and lower highs and lower lows for downtrends.
2. Support and Resistance Levels
Support levels indicate where a price might stop falling, while resistance levels show where a price might stop rising.
3. Volume Analysis
Volume can confirm the strength of a price movement. Higher volume during a price move suggests stronger conviction.
Charting Tools and Software
1. MetaTrader
A popular platform offering a wide range of charting tools and indicators.
2. TradingView
Known for its user-friendly interface and extensive community-driven analysis.
3. Thinkorswim
Provided by TD Ameritrade, it offers professional-level charting capabilities.
Common Mistakes in Charting
1. Overcomplicating Analysis
Stick to a few key indicators and patterns to avoid analysis paralysis.
2. Ignoring Volume
Always consider volume to validate price movements and trends.
3. Not Adjusting for Different Time Frames
Analyze multiple time frames to get a comprehensive view of the market.
Developing a Charting Strategy
1. Define Your Goals
Determine your investment goals and risk tolerance.
2. Backtesting
Test your strategy using historical data to ensure its effectiveness.
3. Stay Updated
Keep learning and adapting to new market conditions and charting techniques.
The Benefits of Using Alistair Blair’s Approach
Alistair Blair’s methodologies emphasize simplicity, clarity, and practical application. By focusing on essential patterns and indicators, investors can make more informed decisions without getting overwhelmed.
Conclusion
Charting is a powerful tool that, when used correctly, can significantly enhance your investment strategy. By following Alistair Blair’s guide, you can develop a robust understanding of charting, identify key patterns, and make informed trading decisions.

Frequently Asked Questions
1. What is the most important chart for beginners to start with?
For beginners, line charts are the easiest to understand and provide a good starting point for identifying trends.
2. How often should I analyze charts?
Regular analysis, such as daily or weekly reviews, can help you stay updated with market trends and make timely decisions.
3. Can charting predict market crashes?
While charting can indicate potential reversals and trends, it cannot predict market crashes with certainty.
4. What is the best charting software for beginners?
TradingView is highly recommended for beginners due to its user-friendly interface and extensive educational resources.
5. How do I combine multiple indicators in my analysis?
Start with a few key indicators, like moving averages and RSI, and gradually incorporate more as you become comfortable with your analysis.
Be the first to review “Investor’s Guide to Charting By Alistair Blair”
You must be logged in to post a review.
Related products

Forex Trading
Original price was: $500.00.$5.00Current price is: $5.00.

Forex Trading
Original price was: $239.00.$8.00Current price is: $8.00.

Original price was: $197.00.$5.00Current price is: $5.00.
Forex Trading
Original price was: $850.00.$23.00Current price is: $23.00.

Original price was: $895.00.$15.00Current price is: $15.00.

Original price was: $497.00.$31.00Current price is: $31.00.

Forex Trading
Original price was: $550.00.$5.00Current price is: $5.00.

Forex Trading
Original price was: $249.00.$15.00Current price is: $15.00.

Original price was: $999.00.$5.00Current price is: $5.00.

Forex Trading
Original price was: $697.00.$5.00Current price is: $5.00.

Original price was: $695.00.$41.00Current price is: $41.00.

Original price was: $700.00.$39.00Current price is: $39.00.
Original price was: $1,200.00.$23.00Current price is: $23.00.
Forex Trading
Original price was: $1,898.00.$10.00Current price is: $10.00.

Forex Trading
Original price was: $125.00.$17.00Current price is: $17.00.

Forex Trading
Original price was: $2,000.00.$23.00Current price is: $23.00.

Original price was: $310.00.$23.00Current price is: $23.00.

Forex Trading
The Complete Guide to Multiple Time Frame Analysis & Reading Price Action with Aiman Almansoori
Original price was: $1,399.00.$13.00Current price is: $13.00.

Forex Trading
Original price was: $397.00.$31.00Current price is: $31.00.

Forex Trading
Original price was: $797.00.$10.00Current price is: $10.00.

Reviews
There are no reviews yet.