-
×
 TenfoldFX Academy Course with Kenneth John
1 × $17.00
TenfoldFX Academy Course with Kenneth John
1 × $17.00 -
×
 Introduction to the Elliot Wave Principle Seminar - Robert Prechter
1 × $6.00
Introduction to the Elliot Wave Principle Seminar - Robert Prechter
1 × $6.00 -
×
 Boomer Quick Profits Day Trading Course
1 × $23.00
Boomer Quick Profits Day Trading Course
1 × $23.00 -
×
 Trading a Living Thing (Article) with David Bowden
1 × $6.00
Trading a Living Thing (Article) with David Bowden
1 × $6.00 -
×
 Principles of Artificial Neural Networks (2nd Ed.) with Daniel Graupe
1 × $6.00
Principles of Artificial Neural Networks (2nd Ed.) with Daniel Graupe
1 × $6.00 -
×
 TradeCraft: Your Path to Peak Performance Trading By Adam Grimes
1 × $15.00
TradeCraft: Your Path to Peak Performance Trading By Adam Grimes
1 × $15.00 -
×
 Foundation of Successful Trading - 2 DVDs and Bonus Gann Time Factor 2 DVDs
1 × $31.00
Foundation of Successful Trading - 2 DVDs and Bonus Gann Time Factor 2 DVDs
1 × $31.00 -
×
 Consistent Small Account Growth Formula with Matt Williamson
1 × $6.00
Consistent Small Account Growth Formula with Matt Williamson
1 × $6.00 -
×
 Ez-Forex Trading System 4.2 with Beau Diamond
1 × $6.00
Ez-Forex Trading System 4.2 with Beau Diamond
1 × $6.00 -
×
 6 Live Sentiment Analysis Trading Bots using Python with The A.I. Whisperer
1 × $5.00
6 Live Sentiment Analysis Trading Bots using Python with The A.I. Whisperer
1 × $5.00 -
×
 Oportunities in Forex Calendar Trading Patterns with Anduril Analytics
1 × $6.00
Oportunities in Forex Calendar Trading Patterns with Anduril Analytics
1 × $6.00 -
×
 Fire Your Stock Analyst: Analyzing Stocks on Your Own with Harry Domash
1 × $6.00
Fire Your Stock Analyst: Analyzing Stocks on Your Own with Harry Domash
1 × $6.00 -
×
 Technical Analysis Applications in the Global Currency Markets (2nd Ed.) with Cornelius Luca
1 × $6.00
Technical Analysis Applications in the Global Currency Markets (2nd Ed.) with Cornelius Luca
1 × $6.00 -
×
 Pristine - Tom Willard – Creating The Ultimate Trading Psychology Using 3 Key Concepts
1 × $6.00
Pristine - Tom Willard – Creating The Ultimate Trading Psychology Using 3 Key Concepts
1 × $6.00 -
×
 Elliott Wave Swing High Low Indicator for ThinkorSwim with Fibonacci
1 × $6.00
Elliott Wave Swing High Low Indicator for ThinkorSwim with Fibonacci
1 × $6.00 -
×
 Dumb Money: Adventures of a Day Trader with Joey Anuff
1 × $6.00
Dumb Money: Adventures of a Day Trader with Joey Anuff
1 × $6.00 -
×
 Financial Fortress with TradeSmart University
1 × $6.00
Financial Fortress with TradeSmart University
1 × $6.00 -
×
 The 30-Day Cash Flow Blueprint with Andy Tanner
1 × $31.00
The 30-Day Cash Flow Blueprint with Andy Tanner
1 × $31.00 -
×
 Forex Mentor Seminar with Peter Bain
1 × $6.00
Forex Mentor Seminar with Peter Bain
1 × $6.00 -
×
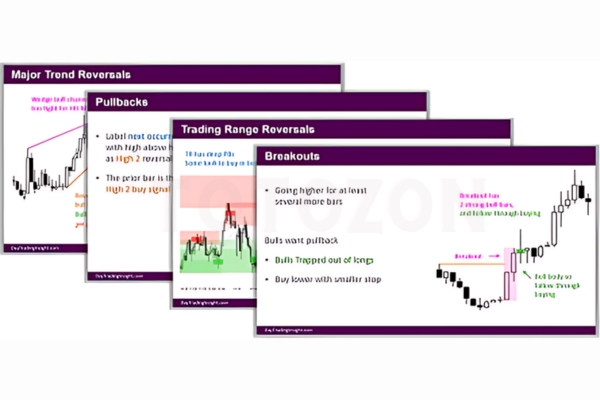 Day Trading Insight with Al Brooks
1 × $10.00
Day Trading Insight with Al Brooks
1 × $10.00 -
×
 Forex Fury
1 × $23.00
Forex Fury
1 × $23.00 -
×
 Power Cycle Trading - Boot Camp for Swing Trading
1 × $6.00
Power Cycle Trading - Boot Camp for Swing Trading
1 × $6.00 -
×
 Increase Your Net Worth In 2 Hours A Week with Jerremy Newsome - Real Life Trading
1 × $17.00
Increase Your Net Worth In 2 Hours A Week with Jerremy Newsome - Real Life Trading
1 × $17.00 -
×
 E-mini Weekly Options Income with Peter Titus
1 × $15.00
E-mini Weekly Options Income with Peter Titus
1 × $15.00 -
×
 Handbook on the Knowledge Economy with David Rooney
1 × $6.00
Handbook on the Knowledge Economy with David Rooney
1 × $6.00 -
×
 Price Action Trading Volume 1 with Fractal Flow Pro
1 × $6.00
Price Action Trading Volume 1 with Fractal Flow Pro
1 × $6.00 -
×
 The Kiloby Inquiries Online with Scott Kiloby
1 × $39.00
The Kiloby Inquiries Online with Scott Kiloby
1 × $39.00 -
×
 Swing Trader Pro with Top Trade Tools
1 × $54.00
Swing Trader Pro with Top Trade Tools
1 × $54.00 -
×
 E75 Forex System with James de Wet
1 × $6.00
E75 Forex System with James de Wet
1 × $6.00 -
×
 Mentfx Paid Mentoship (2021)
1 × $5.00
Mentfx Paid Mentoship (2021)
1 × $5.00 -
×
 Pete Fader VSA Course
1 × $6.00
Pete Fader VSA Course
1 × $6.00 -
×
 Intro To Short Selling with Madaz Money
1 × $31.00
Intro To Short Selling with Madaz Money
1 × $31.00 -
×
 Forex Trading for Newbies Complete Course with Chuck Low
1 × $6.00
Forex Trading for Newbies Complete Course with Chuck Low
1 × $6.00 -
×
 Psycho-Paper 96 with Charles Drummond
1 × $6.00
Psycho-Paper 96 with Charles Drummond
1 × $6.00 -
×
 The Box Strategy with Blue Capital Academy
1 × $23.00
The Box Strategy with Blue Capital Academy
1 × $23.00 -
×
 Module III - Peak Formation Trades with FX MindShift
1 × $6.00
Module III - Peak Formation Trades with FX MindShift
1 × $6.00 -
×
 INVESTOPEDIA - BECOME A DAY TRADER
1 × $15.00
INVESTOPEDIA - BECOME A DAY TRADER
1 × $15.00 -
×
 Edge Trading Group with Edge Elite
1 × $6.00
Edge Trading Group with Edge Elite
1 × $6.00 -
×
 Profit Trading VIX Options Course with Don Kaufman
1 × $6.00
Profit Trading VIX Options Course with Don Kaufman
1 × $6.00 -
×
 The Deadly 7 Sins of Investing with Maury Fertig
1 × $6.00
The Deadly 7 Sins of Investing with Maury Fertig
1 × $6.00 -
×
 Selling Options For A Living Class with Don Kaufman
1 × $6.00
Selling Options For A Living Class with Don Kaufman
1 × $6.00 -
×
 Behavior and Performance of Investment Newsletter Analysts (Article) with Alok Kumar
1 × $6.00
Behavior and Performance of Investment Newsletter Analysts (Article) with Alok Kumar
1 × $6.00 -
×
 How To Invest By Instinct: Instinctively Self Guided Investments with Lin Eldridge
1 × $6.00
How To Invest By Instinct: Instinctively Self Guided Investments with Lin Eldridge
1 × $6.00 -
×
 Forex Meets the Market Profile with John Keppler
1 × $23.00
Forex Meets the Market Profile with John Keppler
1 × $23.00 -
×
 Directional Option Strategies for Swing and Day Trading with Dan Gibby - Master Trader
1 × $54.00
Directional Option Strategies for Swing and Day Trading with Dan Gibby - Master Trader
1 × $54.00 -
×
 Module II - Signature Trades with FX MindShift
1 × $6.00
Module II - Signature Trades with FX MindShift
1 × $6.00 -
×
 ETF Trading Strategies Revealed with David Vomund
1 × $6.00
ETF Trading Strategies Revealed with David Vomund
1 × $6.00 -
×
 Fibonacci Mastery Course: Complete Guide to Trading with Fib By Todd Gordon
1 × $62.00
Fibonacci Mastery Course: Complete Guide to Trading with Fib By Todd Gordon
1 × $62.00 -
×
 Romeo’s University of Turtle Soup with Romeo
1 × $6.00
Romeo’s University of Turtle Soup with Romeo
1 × $6.00 -
×
 Forecast 2012 Report with Larry Williams
1 × $6.00
Forecast 2012 Report with Larry Williams
1 × $6.00 -
×
 From Wall Street to the Great Wall with Jonathan Worrall
1 × $6.00
From Wall Street to the Great Wall with Jonathan Worrall
1 × $6.00 -
×
 MTA - Technically Speaking Newsletters
1 × $6.00
MTA - Technically Speaking Newsletters
1 × $6.00 -
×
 Filtered Waves. Basic Theory with Arthur A.Merrill
1 × $7.00
Filtered Waves. Basic Theory with Arthur A.Merrill
1 × $7.00 -
×
 The Blockchain Bootcamp 2.0 with Gregory (Dapp University)
1 × $15.00
The Blockchain Bootcamp 2.0 with Gregory (Dapp University)
1 × $15.00 -
×
 Credit Spreads Deep Dive with Jay Bailey - Sheridan Options Mentoring
1 × $31.00
Credit Spreads Deep Dive with Jay Bailey - Sheridan Options Mentoring
1 × $31.00 -
×
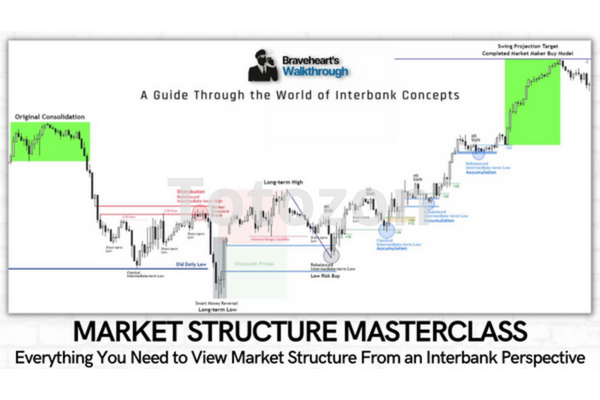 Market Structure Masterclass with Braveheart Trading
1 × $5.00
Market Structure Masterclass with Braveheart Trading
1 × $5.00 -
×
 Put Option Strategies for Smarter Trading with Michael Thomsett
1 × $6.00
Put Option Strategies for Smarter Trading with Michael Thomsett
1 × $6.00 -
×
 Create Your Trade Plan with Yuri Shramenko
1 × $6.00
Create Your Trade Plan with Yuri Shramenko
1 × $6.00 -
×
 Introduction To The STRAT Course with Rob Smith
1 × $8.00
Introduction To The STRAT Course with Rob Smith
1 × $8.00 -
×
 Manage By The Greeks 2016 with Sheridan
1 × $6.00
Manage By The Greeks 2016 with Sheridan
1 × $6.00 -
×
 Dhia’s Journal 2022
1 × $6.00
Dhia’s Journal 2022
1 × $6.00 -
×
 Investment Titans: Investment Insights from the Minds that Move Wall Street with Jonathan Burton
1 × $6.00
Investment Titans: Investment Insights from the Minds that Move Wall Street with Jonathan Burton
1 × $6.00 -
×
 Complete Day Trading Course with The Trading Floor
1 × $13.00
Complete Day Trading Course with The Trading Floor
1 × $13.00 -
×
 The Ticker Investment Digest Articles
1 × $6.00
The Ticker Investment Digest Articles
1 × $6.00 -
×
 Simpler Options - Double Diagonals Class
1 × $6.00
Simpler Options - Double Diagonals Class
1 × $6.00 -
×
 Cheatcode Trend System with Dominique Woodson
1 × $15.00
Cheatcode Trend System with Dominique Woodson
1 × $15.00 -
×
 Harnessing Explosive Market Turns - 3 DVD with Jeff Greenblatt
1 × $6.00
Harnessing Explosive Market Turns - 3 DVD with Jeff Greenblatt
1 × $6.00 -
×
 Hedge Fund Alpha with John Longo - World Scientific
1 × $6.00
Hedge Fund Alpha with John Longo - World Scientific
1 × $6.00 -
×
 Forex Trading Secrets. Trading Strategies for the Forex Market
1 × $6.00
Forex Trading Secrets. Trading Strategies for the Forex Market
1 × $6.00 -
×
 PRO COURSE Order Flow Strategy with Gova Trading Academy
1 × $5.00
PRO COURSE Order Flow Strategy with Gova Trading Academy
1 × $5.00 -
×
 The A14 Weekly Option Strategy Workshop with Amy Meissner
1 × $23.00
The A14 Weekly Option Strategy Workshop with Amy Meissner
1 × $23.00 -
×
 Measuring & Controlling Interest Rate & Credit Risk (2nd Ed.) with Frank Fabozzi, Steven Mann & Moorad Choudhry
1 × $6.00
Measuring & Controlling Interest Rate & Credit Risk (2nd Ed.) with Frank Fabozzi, Steven Mann & Moorad Choudhry
1 × $6.00 -
×
 Quantitative Trading: How to Build Your Own Algorithmic Trading Business (1st Edition) with Ernest Chan
1 × $6.00
Quantitative Trading: How to Build Your Own Algorithmic Trading Business (1st Edition) with Ernest Chan
1 × $6.00 -
×
 All Time High Trading Course with TRADEVERSITY
1 × $5.00
All Time High Trading Course with TRADEVERSITY
1 × $5.00 -
×
 Four Books with J.L.Lord
1 × $23.00
Four Books with J.L.Lord
1 × $23.00 -
×
 Prasna Tantra. Horary Astrology with Bangalore Venkata Raman
1 × $6.00
Prasna Tantra. Horary Astrology with Bangalore Venkata Raman
1 × $6.00 -
×
 Diary of an Internet Trader with Alpesh Patel
1 × $6.00
Diary of an Internet Trader with Alpesh Patel
1 × $6.00 -
×
 Forex Profit Formula System with Jason Fielder
1 × $6.00
Forex Profit Formula System with Jason Fielder
1 × $6.00 -
×
 The Practical Handbook of Genetic Algorithms with Lance Chambers
1 × $6.00
The Practical Handbook of Genetic Algorithms with Lance Chambers
1 × $6.00 -
×
 Developing Profitable Systems from Discretionary to Mechanical with Fred Shutzman
1 × $6.00
Developing Profitable Systems from Discretionary to Mechanical with Fred Shutzman
1 × $6.00 -
×
 Trade Australian Share CFDs with Brian Griffin
1 × $6.00
Trade Australian Share CFDs with Brian Griffin
1 × $6.00 -
×
 Programming in Python For Traders with Trading Markets
1 × $15.00
Programming in Python For Traders with Trading Markets
1 × $15.00 -
×
 Swing Trading (Italian) with Guiuseppe Migliorino
1 × $6.00
Swing Trading (Italian) with Guiuseppe Migliorino
1 × $6.00 -
×
 ProfileTraders - Swing and Price Analysis (May 2014)
1 × $6.00
ProfileTraders - Swing and Price Analysis (May 2014)
1 × $6.00 -
×
 MAP. Moving Average Patterns CD with David Elliott
1 × $6.00
MAP. Moving Average Patterns CD with David Elliott
1 × $6.00 -
×
 The Q’s (2nd Ed.) with Darlene Nelson
1 × $6.00
The Q’s (2nd Ed.) with Darlene Nelson
1 × $6.00 -
×
 The Ones That know
1 × $41.00
The Ones That know
1 × $41.00 -
×
 Detecting Trend Direction & Strength (Article) with Barbara Star
1 × $6.00
Detecting Trend Direction & Strength (Article) with Barbara Star
1 × $6.00 -
×
 Swing Trading for a Living (7 Video Cds & WorkBook 2.1 GB)
1 × $6.00
Swing Trading for a Living (7 Video Cds & WorkBook 2.1 GB)
1 × $6.00 -
×
 Professional Approaches to Directional Option Trading with Option Pit
1 × $23.00
Professional Approaches to Directional Option Trading with Option Pit
1 × $23.00 -
×
 $20 – 52k 20 pips a day challange with Rafał Zuchowicz - TopMasterTrader
1 × $5.00
$20 – 52k 20 pips a day challange with Rafał Zuchowicz - TopMasterTrader
1 × $5.00

Investor’s Guide to Charting By Alistair Blair
$6.00
File Size: Cooming soon!
Delivery Time: 1–12 hours
Media Type: Online Course
Content Proof: Watch Here!
You may check content proof of “Investor’s Guide to Charting By Alistair Blair” below:

Investor’s Guide to Charting By Alistair Blair
Introduction
Welcome to the ultimate guide to charting for investors, based on the insights from Alistair Blair. This article aims to provide you with a comprehensive understanding of charting, its importance in investment strategies, and practical tips to enhance your trading skills.
What is Charting?
Charting involves analyzing historical price movements of securities through various types of charts to predict future price movements. It is a fundamental aspect of technical analysis, helping investors make informed decisions.
Why Charting is Essential for Investors
Understanding chart patterns can provide valuable insights into market trends and potential future movements. This can help investors identify entry and exit points, manage risks, and maximize returns.
Types of Charts in Technical Analysis
1. Line Charts
Line charts plot closing prices over a specific period, providing a clear view of the overall trend.
2. Bar Charts
Bar charts display the opening, high, low, and closing prices for each period, giving a more detailed view of price movements.
3. Candlestick Charts
Candlestick charts also show the open, high, low, and close prices but in a more visually appealing format. They are widely used for identifying market patterns.
Key Chart Patterns Every Investor Should Know
1. Head and Shoulders
A reversal pattern that signals a change in trend direction.
2. Double Top and Double Bottom
These patterns indicate potential trend reversals, with the double top suggesting a bearish reversal and the double bottom a bullish reversal.
3. Triangles
Triangles can be ascending, descending, or symmetrical, and they signify continuation or reversal patterns depending on the breakout direction.
Using Indicators in Charting
1. Moving Averages
Moving averages smooth out price data to identify trends. The two most common types are the simple moving average (SMA) and the exponential moving average (EMA).
2. Relative Strength Index (RSI)
RSI measures the speed and change of price movements, helping to identify overbought or oversold conditions.
3. Moving Average Convergence Divergence (MACD)
MACD is a trend-following momentum indicator that shows the relationship between two moving averages.
How to Read Chart Patterns
1. Identifying Trends
Look for higher highs and higher lows for uptrends, and lower highs and lower lows for downtrends.
2. Support and Resistance Levels
Support levels indicate where a price might stop falling, while resistance levels show where a price might stop rising.
3. Volume Analysis
Volume can confirm the strength of a price movement. Higher volume during a price move suggests stronger conviction.
Charting Tools and Software
1. MetaTrader
A popular platform offering a wide range of charting tools and indicators.
2. TradingView
Known for its user-friendly interface and extensive community-driven analysis.
3. Thinkorswim
Provided by TD Ameritrade, it offers professional-level charting capabilities.
Common Mistakes in Charting
1. Overcomplicating Analysis
Stick to a few key indicators and patterns to avoid analysis paralysis.
2. Ignoring Volume
Always consider volume to validate price movements and trends.
3. Not Adjusting for Different Time Frames
Analyze multiple time frames to get a comprehensive view of the market.
Developing a Charting Strategy
1. Define Your Goals
Determine your investment goals and risk tolerance.
2. Backtesting
Test your strategy using historical data to ensure its effectiveness.
3. Stay Updated
Keep learning and adapting to new market conditions and charting techniques.
The Benefits of Using Alistair Blair’s Approach
Alistair Blair’s methodologies emphasize simplicity, clarity, and practical application. By focusing on essential patterns and indicators, investors can make more informed decisions without getting overwhelmed.
Conclusion
Charting is a powerful tool that, when used correctly, can significantly enhance your investment strategy. By following Alistair Blair’s guide, you can develop a robust understanding of charting, identify key patterns, and make informed trading decisions.

Frequently Asked Questions
1. What is the most important chart for beginners to start with?
For beginners, line charts are the easiest to understand and provide a good starting point for identifying trends.
2. How often should I analyze charts?
Regular analysis, such as daily or weekly reviews, can help you stay updated with market trends and make timely decisions.
3. Can charting predict market crashes?
While charting can indicate potential reversals and trends, it cannot predict market crashes with certainty.
4. What is the best charting software for beginners?
TradingView is highly recommended for beginners due to its user-friendly interface and extensive educational resources.
5. How do I combine multiple indicators in my analysis?
Start with a few key indicators, like moving averages and RSI, and gradually incorporate more as you become comfortable with your analysis.
Be the first to review “Investor’s Guide to Charting By Alistair Blair”
You must be logged in to post a review.
Related products

Forex Trading
Original price was: $1,098.00.$39.00Current price is: $39.00.

Original price was: $895.00.$15.00Current price is: $15.00.

Forex Trading
Original price was: $999.00.$15.00Current price is: $15.00.

Forex Trading
Original price was: $697.00.$5.00Current price is: $5.00.

Forex Trading
Original price was: $500.00.$5.00Current price is: $5.00.

Forex Trading
Original price was: $397.00.$31.00Current price is: $31.00.

Forex Trading
Original price was: $799.00.$15.00Current price is: $15.00.

Original price was: $1,800.00.$54.00Current price is: $54.00.

Forex Trading
Original price was: $797.00.$10.00Current price is: $10.00.

Original price was: $497.00.$31.00Current price is: $31.00.

Original price was: $997.00.$8.00Current price is: $8.00.

Forex Trading
Original price was: $499.00.$15.00Current price is: $15.00.

Original price was: $999.00.$5.00Current price is: $5.00.
Original price was: $197.00.$5.00Current price is: $5.00.

Forex Trading
The Complete Guide to Multiple Time Frame Analysis & Reading Price Action with Aiman Almansoori
Original price was: $1,399.00.$13.00Current price is: $13.00.

Original price was: $649.00.$20.00Current price is: $20.00.

Original price was: $299.00.$8.00Current price is: $8.00.

Original price was: $2,120.00.$15.00Current price is: $15.00.

Forex Trading
Original price was: $125.00.$17.00Current price is: $17.00.

Forex Trading
Original price was: $249.00.$15.00Current price is: $15.00.

Reviews
There are no reviews yet.