-
×
 Forex Strategy Master with Russ Horn
1 × $6.00
Forex Strategy Master with Russ Horn
1 × $6.00 -
×
 Fierce 10 with Mandi Rafsendjani
1 × $5.00
Fierce 10 with Mandi Rafsendjani
1 × $5.00 -
×
 Dynamite TNT Forex System with Clarence Chee
1 × $6.00
Dynamite TNT Forex System with Clarence Chee
1 × $6.00 -
×
 5-Step-Trading Stocks II - Avoid Common Trading Mistakes - Online Course (April 2014)
1 × $23.00
5-Step-Trading Stocks II - Avoid Common Trading Mistakes - Online Course (April 2014)
1 × $23.00 -
×
 Connors on Advanced Trading Strategies with Larry Connors
1 × $6.00
Connors on Advanced Trading Strategies with Larry Connors
1 × $6.00 -
×
 Sacredscience - Raphael – Book of Fate
1 × $6.00
Sacredscience - Raphael – Book of Fate
1 × $6.00 -
×
 MMfx Course August 2011 + MT4 Ind. Jan 2012
1 × $15.00
MMfx Course August 2011 + MT4 Ind. Jan 2012
1 × $15.00 -
×
 Pyrapoint with D.E.Hall
1 × $6.00
Pyrapoint with D.E.Hall
1 × $6.00 -
×
 Trading with Wave59 with Earik Beann
1 × $6.00
Trading with Wave59 with Earik Beann
1 × $6.00 -
×
 WYCKOFF TRADING COURSE (WTC) PART I – ANALYSIS (Fall 2021) with Roman Bogomazov
1 × $209.00
WYCKOFF TRADING COURSE (WTC) PART I – ANALYSIS (Fall 2021) with Roman Bogomazov
1 × $209.00 -
×
 6 (The Proper BackGround)
1 × $6.00
6 (The Proper BackGround)
1 × $6.00 -
×
 Market Forecasting. Stocks and Grain
1 × $6.00
Market Forecasting. Stocks and Grain
1 × $6.00 -
×
 Harmonic Elliott Wave: The Case for Modification of R. N. Elliott's Impulsive Wave Structure with Ian Copsey
1 × $6.00
Harmonic Elliott Wave: The Case for Modification of R. N. Elliott's Impulsive Wave Structure with Ian Copsey
1 × $6.00 -
×
 Pentagonal Time Cycle Theory
1 × $6.00
Pentagonal Time Cycle Theory
1 × $6.00 -
×
 Mastering the Complex Sale: How to Compete and Win When the Stakes are High! with Jeff Thull
1 × $6.00
Mastering the Complex Sale: How to Compete and Win When the Stakes are High! with Jeff Thull
1 × $6.00 -
×
 The Kiloby Inquiries Online with Scott Kiloby
1 × $39.00
The Kiloby Inquiries Online with Scott Kiloby
1 × $39.00 -
×
 TradingMind Course with Jack Bernstein
1 × $6.00
TradingMind Course with Jack Bernstein
1 × $6.00 -
×
 A Comparison of Twelve Technical Trading Systems with Louis Lukac
1 × $6.00
A Comparison of Twelve Technical Trading Systems with Louis Lukac
1 × $6.00 -
×
 Golden Pips Generator - DMA HACK with Hooman
1 × $62.00
Golden Pips Generator - DMA HACK with Hooman
1 × $62.00 -
×
 Pro Indicator Pack with Trade Confident
1 × $15.00
Pro Indicator Pack with Trade Confident
1 × $15.00 -
×
 Fisher Investments on Telecom with Dan Sinton, Andrew S.Teufel
1 × $6.00
Fisher Investments on Telecom with Dan Sinton, Andrew S.Teufel
1 × $6.00 -
×
 Market Maps. High Probability Trading Techniques with Timothy Morge
1 × $6.00
Market Maps. High Probability Trading Techniques with Timothy Morge
1 × $6.00 -
×
 Divorcing the Dow: Using Revolutionary Market Indicators to Profit from the Stealth Boom Ahead - Jim Troup & Sharon Michalsky
1 × $6.00
Divorcing the Dow: Using Revolutionary Market Indicators to Profit from the Stealth Boom Ahead - Jim Troup & Sharon Michalsky
1 × $6.00 -
×
 Sell Premium & Minimize Risk Class with Don Kaufman
1 × $6.00
Sell Premium & Minimize Risk Class with Don Kaufman
1 × $6.00 -
×
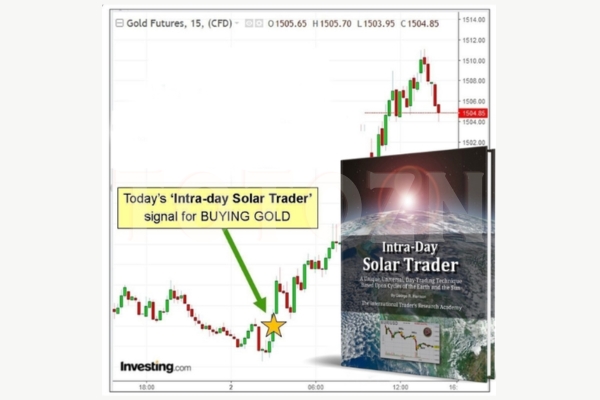 Intra-day Solar Trader with George Harrison
1 × $17.00
Intra-day Solar Trader with George Harrison
1 × $17.00 -
×
 Get 95% Win Rate With The Triple Candy Method - Eden
1 × $5.00
Get 95% Win Rate With The Triple Candy Method - Eden
1 × $5.00 -
×
 Advanced Spread Trading with Guy Bower - MasterClass Trader
1 × $15.00
Advanced Spread Trading with Guy Bower - MasterClass Trader
1 × $15.00 -
×
 Day Trading 101 How To Day Trade Stocks for Passive Income
1 × $6.00
Day Trading 101 How To Day Trade Stocks for Passive Income
1 × $6.00 -
×
 RROP Course 2023
1 × $5.00
RROP Course 2023
1 × $5.00 -
×
 Forex Mentor Seminar with Peter Bain
1 × $6.00
Forex Mentor Seminar with Peter Bain
1 × $6.00 -
×
 The A14 Weekly Option Strategy Workshop with Amy Meissner
1 × $23.00
The A14 Weekly Option Strategy Workshop with Amy Meissner
1 × $23.00 -
×
 Bird Watch in Lion Country 2010 Ed with Dirk Du Toit
1 × $6.00
Bird Watch in Lion Country 2010 Ed with Dirk Du Toit
1 × $6.00 -
×
 Matrix Spread Options Trading Course with Base Camp Trading
1 × $31.00
Matrix Spread Options Trading Course with Base Camp Trading
1 × $31.00 -
×
 Butterfly and Condor Workshop with Aeromir
1 × $15.00
Butterfly and Condor Workshop with Aeromir
1 × $15.00 -
×
 Game-Maker Forex Trading System
1 × $6.00
Game-Maker Forex Trading System
1 × $6.00 -
×
 Hedge Fund of Funds Investing with Joseph Nicholas
1 × $6.00
Hedge Fund of Funds Investing with Joseph Nicholas
1 × $6.00 -
×
 Investment Fables with Aswath Damodaran
1 × $6.00
Investment Fables with Aswath Damodaran
1 × $6.00 -
×
 A Comparison of Popular Trading Systems (2nd Ed.) with Lars Kestner
1 × $6.00
A Comparison of Popular Trading Systems (2nd Ed.) with Lars Kestner
1 × $6.00 -
×
 Trading With DiNapoli Levels
1 × $6.00
Trading With DiNapoli Levels
1 × $6.00 -
×
 Inside Strategies for Profiting with Options with Max Ansbacher
1 × $6.00
Inside Strategies for Profiting with Options with Max Ansbacher
1 × $6.00 -
×
 How to be a Sector Investor with Larry Hungerford & Steve Hungerford
1 × $4.00
How to be a Sector Investor with Larry Hungerford & Steve Hungerford
1 × $4.00 -
×
 Crypto Trading Academy with Cheeky Investor - Aussie Day Trader
1 × $13.00
Crypto Trading Academy with Cheeky Investor - Aussie Day Trader
1 × $13.00 -
×
 Swing Trading College IX 2010 with Larry Connors
1 × $15.00
Swing Trading College IX 2010 with Larry Connors
1 × $15.00 -
×
 Commodity Options: Trading and Hedging Volatility in the World’s Most Lucrative Market with Carley Garner & Paul Brittain
1 × $6.00
Commodity Options: Trading and Hedging Volatility in the World’s Most Lucrative Market with Carley Garner & Paul Brittain
1 × $6.00 -
×
 Planting Landmines for Explosive Profits with Dave Slingshot
1 × $6.00
Planting Landmines for Explosive Profits with Dave Slingshot
1 × $6.00 -
×
 An Empirical Ananlysis of Stock Market Sentiment (Article) with Andrea Terzi
1 × $6.00
An Empirical Ananlysis of Stock Market Sentiment (Article) with Andrea Terzi
1 × $6.00 -
×
 Path to Profits By Scott Redler - T3 Live
1 × $6.00
Path to Profits By Scott Redler - T3 Live
1 × $6.00 -
×
 Limitless Trading Academy with Lorenzo Corrado
1 × $10.00
Limitless Trading Academy with Lorenzo Corrado
1 × $10.00 -
×
 Prometheus Course with QuantProgram
1 × $13.00
Prometheus Course with QuantProgram
1 × $13.00 -
×
 Selling Options For A Living Class with Don Kaufman
1 × $6.00
Selling Options For A Living Class with Don Kaufman
1 × $6.00 -
×
 You can be a Stock Market Genious with Joel Greenblaat
1 × $6.00
You can be a Stock Market Genious with Joel Greenblaat
1 × $6.00 -
×
 Advanced Trading System - How To 10x Your Trading Skillsets & Results with The Trade Academy
1 × $6.00
Advanced Trading System - How To 10x Your Trading Skillsets & Results with The Trade Academy
1 × $6.00 -
×
 HST Mobile
1 × $31.00
HST Mobile
1 × $31.00 -
×
 The Orderflow Masterclass with PrimeTrading
1 × $17.00
The Orderflow Masterclass with PrimeTrading
1 × $17.00 -
×
 The Handbook of Pairs Trading with Douglas Ehrman
1 × $6.00
The Handbook of Pairs Trading with Douglas Ehrman
1 × $6.00 -
×
 F.A.M.E. Home Study Course with Doug Sutton
1 × $6.00
F.A.M.E. Home Study Course with Doug Sutton
1 × $6.00 -
×
 Hedge Funds for Dummies
1 × $6.00
Hedge Funds for Dummies
1 × $6.00 -
×
 Crypto Trading Cyber Security for Bitcoin & Altcoin Holders with Zlatin Georgiev
1 × $5.00
Crypto Trading Cyber Security for Bitcoin & Altcoin Holders with Zlatin Georgiev
1 × $5.00 -
×
 Forex Trading with Ed Ponsi
1 × $6.00
Forex Trading with Ed Ponsi
1 × $6.00 -
×
 Elite Gap Trading with Nick Santiago - InTheMoneyStocks
1 × $93.00
Elite Gap Trading with Nick Santiago - InTheMoneyStocks
1 × $93.00 -
×
 Getting Started in Forex Trading Strategies with Michael Duane Archer
1 × $6.00
Getting Started in Forex Trading Strategies with Michael Duane Archer
1 × $6.00 -
×
 The 30-Day Cash Flow Blueprint with Andy Tanner
1 × $31.00
The 30-Day Cash Flow Blueprint with Andy Tanner
1 × $31.00 -
×
 Advanced Fibonacci Trading with Neal Hughes
1 × $6.00
Advanced Fibonacci Trading with Neal Hughes
1 × $6.00 -
×
 Speculating with Futures and Traditional Commodities Part II (Liverpool Group) - Noble DraKoln
1 × $6.00
Speculating with Futures and Traditional Commodities Part II (Liverpool Group) - Noble DraKoln
1 × $6.00 -
×
 AG Trading Journal with Ace Gazette
1 × $6.00
AG Trading Journal with Ace Gazette
1 × $6.00 -
×
 Option Strategies with Courtney Smith
1 × $6.00
Option Strategies with Courtney Smith
1 × $6.00 -
×
 Campaign Trading with John Sweeney
1 × $6.00
Campaign Trading with John Sweeney
1 × $6.00 -
×
 The Complete Guide to Multiple Time Frame Analysis & Reading Price Action with Aiman Almansoori
1 × $13.00
The Complete Guide to Multiple Time Frame Analysis & Reading Price Action with Aiman Almansoori
1 × $13.00

Investor’s Guide to Charting By Alistair Blair
$6.00
File Size: Cooming soon!
Delivery Time: 1–12 hours
Media Type: Online Course
Content Proof: Watch Here!
You may check content proof of “Investor’s Guide to Charting By Alistair Blair” below:

Investor’s Guide to Charting By Alistair Blair
Introduction
Welcome to the ultimate guide to charting for investors, based on the insights from Alistair Blair. This article aims to provide you with a comprehensive understanding of charting, its importance in investment strategies, and practical tips to enhance your trading skills.
What is Charting?
Charting involves analyzing historical price movements of securities through various types of charts to predict future price movements. It is a fundamental aspect of technical analysis, helping investors make informed decisions.
Why Charting is Essential for Investors
Understanding chart patterns can provide valuable insights into market trends and potential future movements. This can help investors identify entry and exit points, manage risks, and maximize returns.
Types of Charts in Technical Analysis
1. Line Charts
Line charts plot closing prices over a specific period, providing a clear view of the overall trend.
2. Bar Charts
Bar charts display the opening, high, low, and closing prices for each period, giving a more detailed view of price movements.
3. Candlestick Charts
Candlestick charts also show the open, high, low, and close prices but in a more visually appealing format. They are widely used for identifying market patterns.
Key Chart Patterns Every Investor Should Know
1. Head and Shoulders
A reversal pattern that signals a change in trend direction.
2. Double Top and Double Bottom
These patterns indicate potential trend reversals, with the double top suggesting a bearish reversal and the double bottom a bullish reversal.
3. Triangles
Triangles can be ascending, descending, or symmetrical, and they signify continuation or reversal patterns depending on the breakout direction.
Using Indicators in Charting
1. Moving Averages
Moving averages smooth out price data to identify trends. The two most common types are the simple moving average (SMA) and the exponential moving average (EMA).
2. Relative Strength Index (RSI)
RSI measures the speed and change of price movements, helping to identify overbought or oversold conditions.
3. Moving Average Convergence Divergence (MACD)
MACD is a trend-following momentum indicator that shows the relationship between two moving averages.
How to Read Chart Patterns
1. Identifying Trends
Look for higher highs and higher lows for uptrends, and lower highs and lower lows for downtrends.
2. Support and Resistance Levels
Support levels indicate where a price might stop falling, while resistance levels show where a price might stop rising.
3. Volume Analysis
Volume can confirm the strength of a price movement. Higher volume during a price move suggests stronger conviction.
Charting Tools and Software
1. MetaTrader
A popular platform offering a wide range of charting tools and indicators.
2. TradingView
Known for its user-friendly interface and extensive community-driven analysis.
3. Thinkorswim
Provided by TD Ameritrade, it offers professional-level charting capabilities.
Common Mistakes in Charting
1. Overcomplicating Analysis
Stick to a few key indicators and patterns to avoid analysis paralysis.
2. Ignoring Volume
Always consider volume to validate price movements and trends.
3. Not Adjusting for Different Time Frames
Analyze multiple time frames to get a comprehensive view of the market.
Developing a Charting Strategy
1. Define Your Goals
Determine your investment goals and risk tolerance.
2. Backtesting
Test your strategy using historical data to ensure its effectiveness.
3. Stay Updated
Keep learning and adapting to new market conditions and charting techniques.
The Benefits of Using Alistair Blair’s Approach
Alistair Blair’s methodologies emphasize simplicity, clarity, and practical application. By focusing on essential patterns and indicators, investors can make more informed decisions without getting overwhelmed.
Conclusion
Charting is a powerful tool that, when used correctly, can significantly enhance your investment strategy. By following Alistair Blair’s guide, you can develop a robust understanding of charting, identify key patterns, and make informed trading decisions.

Frequently Asked Questions
1. What is the most important chart for beginners to start with?
For beginners, line charts are the easiest to understand and provide a good starting point for identifying trends.
2. How often should I analyze charts?
Regular analysis, such as daily or weekly reviews, can help you stay updated with market trends and make timely decisions.
3. Can charting predict market crashes?
While charting can indicate potential reversals and trends, it cannot predict market crashes with certainty.
4. What is the best charting software for beginners?
TradingView is highly recommended for beginners due to its user-friendly interface and extensive educational resources.
5. How do I combine multiple indicators in my analysis?
Start with a few key indicators, like moving averages and RSI, and gradually incorporate more as you become comfortable with your analysis.
Be the first to review “Investor’s Guide to Charting By Alistair Blair”
You must be logged in to post a review.
Related products
Forex Trading
Original price was: $125.00.$17.00Current price is: $17.00.
Original price was: $497.00.$31.00Current price is: $31.00.

Forex Trading
Original price was: $499.00.$15.00Current price is: $15.00.

Forex Trading
Original price was: $697.00.$5.00Current price is: $5.00.

Forex Trading
Original price was: $2,000.00.$23.00Current price is: $23.00.
Original price was: $997.00.$13.00Current price is: $13.00.

Forex Trading
Original price was: $249.00.$15.00Current price is: $15.00.

Forex Trading
Original price was: $4,997.00.$27.00Current price is: $27.00.

Original price was: $999.00.$5.00Current price is: $5.00.

Forex Trading
Original price was: $2,995.00.$31.00Current price is: $31.00.

Original price was: $2,120.00.$15.00Current price is: $15.00.

Original price was: $497.00.$11.00Current price is: $11.00.

Original price was: $997.00.$8.00Current price is: $8.00.

Original price was: $4,995.00.$15.00Current price is: $15.00.

Forex Trading
Original price was: $2,997.00.$23.00Current price is: $23.00.

Forex Trading
Original price was: $239.00.$8.00Current price is: $8.00.

Forex Trading
Original price was: $397.00.$31.00Current price is: $31.00.

Forex Trading
Original price was: $999.00.$15.00Current price is: $15.00.

Original price was: $695.00.$41.00Current price is: $41.00.

Forex Trading
Original price was: $550.00.$5.00Current price is: $5.00.

Reviews
There are no reviews yet.