-
×
 Pete Fader VSA Course
1 × $6.00
Pete Fader VSA Course
1 × $6.00 -
×
 Swing Trading (Italian) with Guiuseppe Migliorino
1 × $6.00
Swing Trading (Italian) with Guiuseppe Migliorino
1 × $6.00 -
×
 Stocks and Bonds with Elaine Scott
1 × $6.00
Stocks and Bonds with Elaine Scott
1 × $6.00 -
×
 Advanced Risk Reversals and Rolling Thunder with Stratagem Trade
1 × $54.00
Advanced Risk Reversals and Rolling Thunder with Stratagem Trade
1 × $54.00 -
×
 TradeSafe Mechanical Trading System, Course, and Coaching
1 × $85.00
TradeSafe Mechanical Trading System, Course, and Coaching
1 × $85.00 -
×
 How To Invest Better
1 × $6.00
How To Invest Better
1 × $6.00 -
×
 Best of the Best: Collars with Amy Meissner & Scott Ruble
1 × $15.00
Best of the Best: Collars with Amy Meissner & Scott Ruble
1 × $15.00 -
×
 The Best (Public) Trading Methods I’ve Found for Futures & Equities with Perry J.Kaufman
1 × $6.00
The Best (Public) Trading Methods I’ve Found for Futures & Equities with Perry J.Kaufman
1 × $6.00 -
×
 Creating the Optimal Trade for Explosive Profits with George A.Fontanills
1 × $6.00
Creating the Optimal Trade for Explosive Profits with George A.Fontanills
1 × $6.00 -
×
 Butterfly and Condor Workshop with Aeromir
1 × $15.00
Butterfly and Condor Workshop with Aeromir
1 × $15.00 -
×
 Power FX Xtreme BuySell EA
1 × $23.00
Power FX Xtreme BuySell EA
1 × $23.00 -
×
 Long-Term Secrets to Short-Term Trading (Ebook) with Larry Williams
1 × $6.00
Long-Term Secrets to Short-Term Trading (Ebook) with Larry Williams
1 × $6.00 -
×
 Practical Approach to Ninjatrader 8 Platform with Rajandran R
1 × $6.00
Practical Approach to Ninjatrader 8 Platform with Rajandran R
1 × $6.00 -
×
 Option Insanity Strategy with PDS Trader
1 × $69.00
Option Insanity Strategy with PDS Trader
1 × $69.00 -
×
 Tradingriot Bootcamp + Blueprint 3.0
1 × $6.00
Tradingriot Bootcamp + Blueprint 3.0
1 × $6.00 -
×
 Trading 3SMA System with Hector DeVille
1 × $6.00
Trading 3SMA System with Hector DeVille
1 × $6.00 -
×
 The Internet Trading Course with Alpesh Patel
1 × $6.00
The Internet Trading Course with Alpesh Patel
1 × $6.00 -
×
 Star Traders Forex Intermediate Course I with Karen Foo
1 × $8.00
Star Traders Forex Intermediate Course I with Karen Foo
1 × $8.00 -
×
 Scalp Strategy and Flipping Small Accounts with Opes Trading Group
1 × $5.00
Scalp Strategy and Flipping Small Accounts with Opes Trading Group
1 × $5.00 -
×
 A Really Friendly Guide to Wavelets with C.Vallens
1 × $6.00
A Really Friendly Guide to Wavelets with C.Vallens
1 × $6.00 -
×
 FMG Online Course with FMG Traders
1 × $6.00
FMG Online Course with FMG Traders
1 × $6.00 -
×
 Bill Williams Package ( Discount 30% )
1 × $6.00
Bill Williams Package ( Discount 30% )
1 × $6.00 -
×
 Fed Balance Sheet 201 with Joseph Wang - Central Banking 101
1 × $10.00
Fed Balance Sheet 201 with Joseph Wang - Central Banking 101
1 × $10.00 -
×
 Bond Market Course with The Macro Compass
1 × $15.00
Bond Market Course with The Macro Compass
1 × $15.00 -
×
 Insider Signal Exclusive Forex Course - 9 CD with Andy X
1 × $6.00
Insider Signal Exclusive Forex Course - 9 CD with Andy X
1 × $6.00 -
×
 Futures & Options Course with Talkin Options
1 × $15.00
Futures & Options Course with Talkin Options
1 × $15.00 -
×
 Oportunities in Forex Calendar Trading Patterns with Anduril Analytics
1 × $6.00
Oportunities in Forex Calendar Trading Patterns with Anduril Analytics
1 × $6.00 -
×
 FuturesTrader71 - webinar series (4 webinars)
1 × $6.00
FuturesTrader71 - webinar series (4 webinars)
1 × $6.00 -
×
 Portfolio Management using Machine Learning: Hierarchical Risk Parity
1 × $39.00
Portfolio Management using Machine Learning: Hierarchical Risk Parity
1 × $39.00 -
×
 Boomer Quick Profits Day Trading Course
1 × $23.00
Boomer Quick Profits Day Trading Course
1 × $23.00 -
×
 Options Trading & Ultimate MasterClass With Tyrone Abela - FX Evolution
1 × $54.00
Options Trading & Ultimate MasterClass With Tyrone Abela - FX Evolution
1 × $54.00 -
×
 Investment Psychology. Explained Classic Strategies to Beat the Markets with Martin Pring
1 × $6.00
Investment Psychology. Explained Classic Strategies to Beat the Markets with Martin Pring
1 × $6.00 -
×
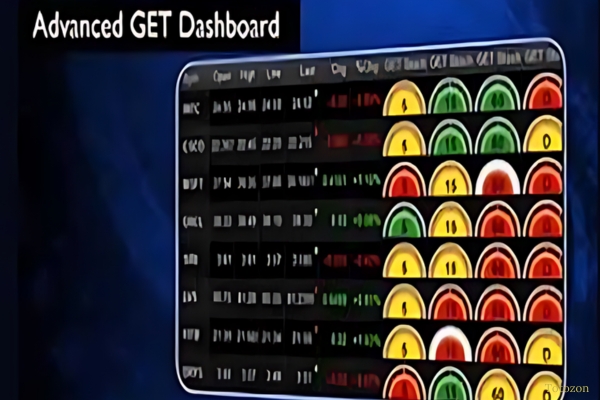 Advanced GET 8.0 EOD
1 × $6.00
Advanced GET 8.0 EOD
1 × $6.00 -
×
 Fibonacci Mastery Course: Complete Guide to Trading with Fib By Todd Gordon
1 × $62.00
Fibonacci Mastery Course: Complete Guide to Trading with Fib By Todd Gordon
1 × $62.00 -
×
 TradeCraft: Your Path to Peak Performance Trading By Adam Grimes
1 × $15.00
TradeCraft: Your Path to Peak Performance Trading By Adam Grimes
1 × $15.00 -
×
 Traders Secret Library
1 × $6.00
Traders Secret Library
1 × $6.00 -
×
 Finding Astrocycles with an Ephemeris - Hans Hannula
1 × $6.00
Finding Astrocycles with an Ephemeris - Hans Hannula
1 × $6.00 -
×
 Forex Robotron (Unlocked)
1 × $6.00
Forex Robotron (Unlocked)
1 × $6.00 -
×
 Stock Selection Course with Dave Landry
1 × $6.00
Stock Selection Course with Dave Landry
1 × $6.00 -
×
 The Binary Trigger (Video, Books) with John Piper
1 × $6.00
The Binary Trigger (Video, Books) with John Piper
1 × $6.00 -
×
 The All Put Flat Butterfly with Dan Sheridan - Sheridan Options Mentoring
1 × $6.00
The All Put Flat Butterfly with Dan Sheridan - Sheridan Options Mentoring
1 × $6.00 -
×
 Equities with Peter Martin
1 × $6.00
Equities with Peter Martin
1 × $6.00 -
×
 The Loyalty Effect with Frederick Reichheld
1 × $6.00
The Loyalty Effect with Frederick Reichheld
1 × $6.00 -
×
 Deep Dive Butterfly Trading Strategy Class with SJG Trades
1 × $41.00
Deep Dive Butterfly Trading Strategy Class with SJG Trades
1 × $41.00 -
×
 FX GOAT 3.0 (ALL IN ONE) with FX GOAT FOREX TRADING ACADEMY
1 × $5.00
FX GOAT 3.0 (ALL IN ONE) with FX GOAT FOREX TRADING ACADEMY
1 × $5.00 -
×
 Investment Strategies for the 21th Century with Frank Amstrong
1 × $6.00
Investment Strategies for the 21th Century with Frank Amstrong
1 × $6.00 -
×
 Day Trading and Swing Trading Futures with Price Action by Humberto Malaspina
1 × $5.00
Day Trading and Swing Trading Futures with Price Action by Humberto Malaspina
1 × $5.00 -
×
 Forex Trading Plan - Learn How To Set SMART Trading Goals! with Anas Abba & FXMindTrix Academy
1 × $6.00
Forex Trading Plan - Learn How To Set SMART Trading Goals! with Anas Abba & FXMindTrix Academy
1 × $6.00 -
×
 The Complete XAUUSD GOLD Forex Scalping System On Real Trading Account with Forex Lia
1 × $5.00
The Complete XAUUSD GOLD Forex Scalping System On Real Trading Account with Forex Lia
1 × $5.00 -
×
 Computational Financial Mathematics with Mathematica
1 × $6.00
Computational Financial Mathematics with Mathematica
1 × $6.00 -
×
 Protecting your Retirement Account in a Correction with Dan Sheridan - Sheridan Options Mentoring
1 × $31.00
Protecting your Retirement Account in a Correction with Dan Sheridan - Sheridan Options Mentoring
1 × $31.00 -
×
 Self-Mastery Course with Steven Cruz
1 × $62.00
Self-Mastery Course with Steven Cruz
1 × $62.00 -
×
 Covered Calls Income Generation for Your Stocks With Don Kaufman
1 × $6.00
Covered Calls Income Generation for Your Stocks With Don Kaufman
1 × $6.00 -
×
 Advanced Spread Trading with Guy Bower - MasterClass Trader
1 × $15.00
Advanced Spread Trading with Guy Bower - MasterClass Trader
1 × $15.00 -
×
 Precision Pattern Trading Workbook with Daryl Guppy
1 × $6.00
Precision Pattern Trading Workbook with Daryl Guppy
1 × $6.00 -
×
 The Aggressive Conservative Investor with Martin Whitman & Martin Shubik
1 × $6.00
The Aggressive Conservative Investor with Martin Whitman & Martin Shubik
1 × $6.00 -
×
 Kicker Signals with Stephen W.Bigalow
1 × $6.00
Kicker Signals with Stephen W.Bigalow
1 × $6.00 -
×
 How To Read The Market Professionally with TradeSmart
1 × $27.00
How To Read The Market Professionally with TradeSmart
1 × $27.00 -
×
 Day Trading Options Guide PDF with Matt Diamond
1 × $23.00
Day Trading Options Guide PDF with Matt Diamond
1 × $23.00 -
×
 Andy’s EMini Bar – 60 Min System
1 × $6.00
Andy’s EMini Bar – 60 Min System
1 × $6.00 -
×
 The Complete Guide to Option Selling, 2nd 2009 with James Cordier & Michael Gross
1 × $6.00
The Complete Guide to Option Selling, 2nd 2009 with James Cordier & Michael Gross
1 × $6.00 -
×
 Dynamic Time and Price Analysis of Market Trends with Bruce Gilmore
1 × $6.00
Dynamic Time and Price Analysis of Market Trends with Bruce Gilmore
1 × $6.00 -
×
 Trading Options at Expiration: Strategies and Models for Winning the Endgame with Jeff Augen
1 × $6.00
Trading Options at Expiration: Strategies and Models for Winning the Endgame with Jeff Augen
1 × $6.00 -
×
 Sea Lanes & Pipelines with Bernard D.Cole
1 × $6.00
Sea Lanes & Pipelines with Bernard D.Cole
1 × $6.00 -
×
 Equity Trader 101 Course with KeyStone Trading
1 × $6.00
Equity Trader 101 Course with KeyStone Trading
1 × $6.00 -
×
 Trading with Wave59 with Earik Beann
1 × $6.00
Trading with Wave59 with Earik Beann
1 × $6.00 -
×
 The Compleat Day Trader with Jake Bernstein
1 × $6.00
The Compleat Day Trader with Jake Bernstein
1 × $6.00 -
×
 Forex and Stocks Trading Course - Set and Forget with Alfonso Moreno
1 × $6.00
Forex and Stocks Trading Course - Set and Forget with Alfonso Moreno
1 × $6.00 -
×
 Profitable Strategies with Gemify Academy
1 × $10.00
Profitable Strategies with Gemify Academy
1 × $10.00 -
×
 The Complete Guide to Multiple Time Frame Analysis & Reading Price Action with Aiman Almansoori
1 × $13.00
The Complete Guide to Multiple Time Frame Analysis & Reading Price Action with Aiman Almansoori
1 × $13.00 -
×
 Humbled Trader Academy
1 × $5.00
Humbled Trader Academy
1 × $5.00 -
×
 Rockwell Day Trading - Starter Package
1 × $6.00
Rockwell Day Trading - Starter Package
1 × $6.00 -
×
 The Prop Trading Code with Brannigan Barrett - Axia Futures
1 × $23.00
The Prop Trading Code with Brannigan Barrett - Axia Futures
1 × $23.00

Investor’s Guide to Charting By Alistair Blair
$6.00
File Size: Cooming soon!
Delivery Time: 1–12 hours
Media Type: Online Course
Content Proof: Watch Here!
You may check content proof of “Investor’s Guide to Charting By Alistair Blair” below:

Investor’s Guide to Charting By Alistair Blair
Introduction
Welcome to the ultimate guide to charting for investors, based on the insights from Alistair Blair. This article aims to provide you with a comprehensive understanding of charting, its importance in investment strategies, and practical tips to enhance your trading skills.
What is Charting?
Charting involves analyzing historical price movements of securities through various types of charts to predict future price movements. It is a fundamental aspect of technical analysis, helping investors make informed decisions.
Why Charting is Essential for Investors
Understanding chart patterns can provide valuable insights into market trends and potential future movements. This can help investors identify entry and exit points, manage risks, and maximize returns.
Types of Charts in Technical Analysis
1. Line Charts
Line charts plot closing prices over a specific period, providing a clear view of the overall trend.
2. Bar Charts
Bar charts display the opening, high, low, and closing prices for each period, giving a more detailed view of price movements.
3. Candlestick Charts
Candlestick charts also show the open, high, low, and close prices but in a more visually appealing format. They are widely used for identifying market patterns.
Key Chart Patterns Every Investor Should Know
1. Head and Shoulders
A reversal pattern that signals a change in trend direction.
2. Double Top and Double Bottom
These patterns indicate potential trend reversals, with the double top suggesting a bearish reversal and the double bottom a bullish reversal.
3. Triangles
Triangles can be ascending, descending, or symmetrical, and they signify continuation or reversal patterns depending on the breakout direction.
Using Indicators in Charting
1. Moving Averages
Moving averages smooth out price data to identify trends. The two most common types are the simple moving average (SMA) and the exponential moving average (EMA).
2. Relative Strength Index (RSI)
RSI measures the speed and change of price movements, helping to identify overbought or oversold conditions.
3. Moving Average Convergence Divergence (MACD)
MACD is a trend-following momentum indicator that shows the relationship between two moving averages.
How to Read Chart Patterns
1. Identifying Trends
Look for higher highs and higher lows for uptrends, and lower highs and lower lows for downtrends.
2. Support and Resistance Levels
Support levels indicate where a price might stop falling, while resistance levels show where a price might stop rising.
3. Volume Analysis
Volume can confirm the strength of a price movement. Higher volume during a price move suggests stronger conviction.
Charting Tools and Software
1. MetaTrader
A popular platform offering a wide range of charting tools and indicators.
2. TradingView
Known for its user-friendly interface and extensive community-driven analysis.
3. Thinkorswim
Provided by TD Ameritrade, it offers professional-level charting capabilities.
Common Mistakes in Charting
1. Overcomplicating Analysis
Stick to a few key indicators and patterns to avoid analysis paralysis.
2. Ignoring Volume
Always consider volume to validate price movements and trends.
3. Not Adjusting for Different Time Frames
Analyze multiple time frames to get a comprehensive view of the market.
Developing a Charting Strategy
1. Define Your Goals
Determine your investment goals and risk tolerance.
2. Backtesting
Test your strategy using historical data to ensure its effectiveness.
3. Stay Updated
Keep learning and adapting to new market conditions and charting techniques.
The Benefits of Using Alistair Blair’s Approach
Alistair Blair’s methodologies emphasize simplicity, clarity, and practical application. By focusing on essential patterns and indicators, investors can make more informed decisions without getting overwhelmed.
Conclusion
Charting is a powerful tool that, when used correctly, can significantly enhance your investment strategy. By following Alistair Blair’s guide, you can develop a robust understanding of charting, identify key patterns, and make informed trading decisions.

Frequently Asked Questions
1. What is the most important chart for beginners to start with?
For beginners, line charts are the easiest to understand and provide a good starting point for identifying trends.
2. How often should I analyze charts?
Regular analysis, such as daily or weekly reviews, can help you stay updated with market trends and make timely decisions.
3. Can charting predict market crashes?
While charting can indicate potential reversals and trends, it cannot predict market crashes with certainty.
4. What is the best charting software for beginners?
TradingView is highly recommended for beginners due to its user-friendly interface and extensive educational resources.
5. How do I combine multiple indicators in my analysis?
Start with a few key indicators, like moving averages and RSI, and gradually incorporate more as you become comfortable with your analysis.
Be the first to review “Investor’s Guide to Charting By Alistair Blair”
You must be logged in to post a review.
Related products

Forex Trading
Original price was: $797.00.$10.00Current price is: $10.00.
Forex Trading
Original price was: $1,898.00.$10.00Current price is: $10.00.

Original price was: $497.00.$31.00Current price is: $31.00.

Forex Trading
Original price was: $500.00.$5.00Current price is: $5.00.

Forex Trading
Original price was: $2,997.00.$23.00Current price is: $23.00.

Original price was: $2,120.00.$15.00Current price is: $15.00.

Forex Trading
Original price was: $697.00.$5.00Current price is: $5.00.

Original price was: $497.00.$11.00Current price is: $11.00.

Forex Trading
Original price was: $125.00.$17.00Current price is: $17.00.
Original price was: $1,800.00.$54.00Current price is: $54.00.

Original price was: $299.00.$8.00Current price is: $8.00.

Forex Trading
Original price was: $1,098.00.$39.00Current price is: $39.00.

Original price was: $450.00.$23.00Current price is: $23.00.

Original price was: $649.00.$20.00Current price is: $20.00.
Original price was: $895.00.$15.00Current price is: $15.00.

Original price was: $997.00.$8.00Current price is: $8.00.

Forex Trading
Original price was: $249.00.$15.00Current price is: $15.00.
Original price was: $1,200.00.$23.00Current price is: $23.00.
Original price was: $799.00.$15.00Current price is: $15.00.

Forex Trading
Original price was: $2,995.00.$31.00Current price is: $31.00.

Reviews
There are no reviews yet.