-
×
 EURUSD Trading System with CopperChips
1 × $6.00
EURUSD Trading System with CopperChips
1 × $6.00 -
×
 Quantifiable Edges – Gold Subscription with Rob Hanna
1 × $54.00
Quantifiable Edges – Gold Subscription with Rob Hanna
1 × $54.00 -
×
 Hedge Fund of Funds Investing with Joseph Nicholas
1 × $6.00
Hedge Fund of Funds Investing with Joseph Nicholas
1 × $6.00 -
×
 The Next Wealth Transfer Investing in Gold and Silver
1 × $6.00
The Next Wealth Transfer Investing in Gold and Silver
1 × $6.00 -
×
 European Members - March 2023 with Stockbee
1 × $5.00
European Members - March 2023 with Stockbee
1 × $5.00 -
×
 Million Dollar Stock Market Idea with Larry Williams
1 × $6.00
Million Dollar Stock Market Idea with Larry Williams
1 × $6.00 -
×
 Master Trader - Advander Management Strategies
1 × $39.00
Master Trader - Advander Management Strategies
1 × $39.00 -
×
 Traders: Risks, Decisions, and Management in Financial Markets - Mark Fenton-O’Creevy, Nigel Nicholson, Emma Soane & Paul Willman
1 × $6.00
Traders: Risks, Decisions, and Management in Financial Markets - Mark Fenton-O’Creevy, Nigel Nicholson, Emma Soane & Paul Willman
1 × $6.00 -
×
 Oportunities in Forex Calendar Trading Patterns with Anduril Analytics
1 × $6.00
Oportunities in Forex Calendar Trading Patterns with Anduril Analytics
1 × $6.00 -
×
 Euro Error with Jean-Jacques Rosa
1 × $6.00
Euro Error with Jean-Jacques Rosa
1 × $6.00 -
×
 Successful Stock Speculation (1922) with John James
1 × $6.00
Successful Stock Speculation (1922) with John James
1 × $6.00 -
×
 The Practical Fractal with Bill Williams
1 × $6.00
The Practical Fractal with Bill Williams
1 × $6.00 -
×
 Power Index Method for Profitable Futures Trading with Harold Goldberg
1 × $6.00
Power Index Method for Profitable Futures Trading with Harold Goldberg
1 × $6.00 -
×
 How You Can Be Right While the Crowd Loses with Jack Bernstein
1 × $6.00
How You Can Be Right While the Crowd Loses with Jack Bernstein
1 × $6.00 -
×
 Blank Check Trade
1 × $31.00
Blank Check Trade
1 × $31.00 -
×
 How to Trade a Vertical Market with Armstrong Economics
1 × $155.00
How to Trade a Vertical Market with Armstrong Economics
1 × $155.00 -
×
 HunterFX Video Course with HunterFX
1 × $6.00
HunterFX Video Course with HunterFX
1 × $6.00 -
×
 Put Option Strategies for Smarter Trading with Michael Thomsett
1 × $6.00
Put Option Strategies for Smarter Trading with Michael Thomsett
1 × $6.00 -
×
 Sector Rotation & Market Timing with Frank Barbera
1 × $6.00
Sector Rotation & Market Timing with Frank Barbera
1 × $6.00 -
×
 AstroFibonacci 7.3722 magisociety
1 × $6.00
AstroFibonacci 7.3722 magisociety
1 × $6.00 -
×
 Affinity Foundation Option Course with Affinitytrading
1 × $6.00
Affinity Foundation Option Course with Affinitytrading
1 × $6.00 -
×
 Forex Strategy Master with Russ Horn
1 × $6.00
Forex Strategy Master with Russ Horn
1 × $6.00 -
×
 Greatest Trading Tools with Michael Parsons
1 × $6.00
Greatest Trading Tools with Michael Parsons
1 × $6.00 -
×
 Secret Weapon to Trading Options on ETF's Class with Don Kaufman
1 × $6.00
Secret Weapon to Trading Options on ETF's Class with Don Kaufman
1 × $6.00 -
×
 If You Are So Smart Why Aren’t You Rich with Ben Branch
1 × $6.00
If You Are So Smart Why Aren’t You Rich with Ben Branch
1 × $6.00 -
×
 Module 1 & 2 Swing Trading Forex and Financial Futures with Trader Dante
1 × $15.00
Module 1 & 2 Swing Trading Forex and Financial Futures with Trader Dante
1 × $15.00 -
×
 How to Find the Most Profitable Stocks with Mubarak Shah
1 × $6.00
How to Find the Most Profitable Stocks with Mubarak Shah
1 × $6.00 -
×
 Online Course - Why Wave Analysis Belongs in Every Trader's Toolbox with Jeffrey Kennedy - Elliott Wave
1 × $15.00
Online Course - Why Wave Analysis Belongs in Every Trader's Toolbox with Jeffrey Kennedy - Elliott Wave
1 × $15.00 -
×
 Stock Market 101 with Sabrina Peterson
1 × $4.00
Stock Market 101 with Sabrina Peterson
1 × $4.00 -
×
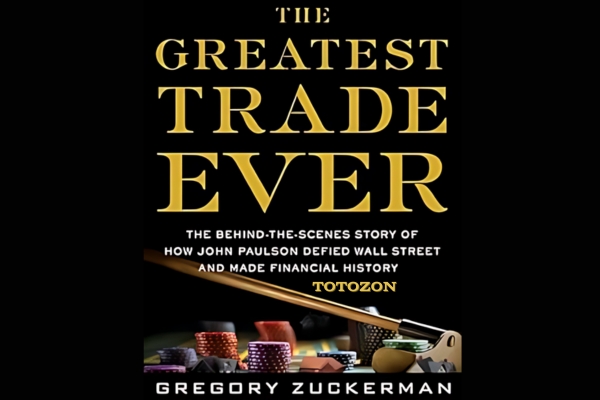 The Greatest Trade Ever with Gregory Zuckerman
1 × $6.00
The Greatest Trade Ever with Gregory Zuckerman
1 × $6.00 -
×
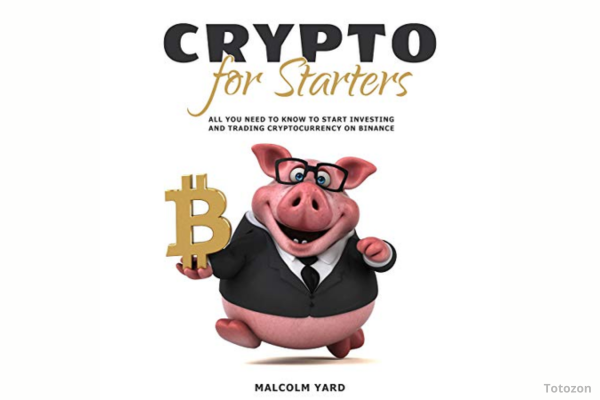 Crypto for Starters: All You Need to Know to Start Investing and Trading Cryptocurrency on Binance with Malcolm Yard
1 × $5.00
Crypto for Starters: All You Need to Know to Start Investing and Trading Cryptocurrency on Binance with Malcolm Yard
1 × $5.00 -
×
 Raghee’s Winners Circle Course
1 × $6.00
Raghee’s Winners Circle Course
1 × $6.00 -
×
 Elliott Wave Forex Course
1 × $6.00
Elliott Wave Forex Course
1 × $6.00 -
×
 Sixpart Study Guide to Market Profile
1 × $6.00
Sixpart Study Guide to Market Profile
1 × $6.00 -
×
 The Banker’s Edge Webinar & Extras
1 × $6.00
The Banker’s Edge Webinar & Extras
1 × $6.00 -
×
 DApp Mastermind (Crypto DApps) – Passive Income with DApps and SMART Contracts with Jason BTO
1 × $6.00
DApp Mastermind (Crypto DApps) – Passive Income with DApps and SMART Contracts with Jason BTO
1 × $6.00 -
×
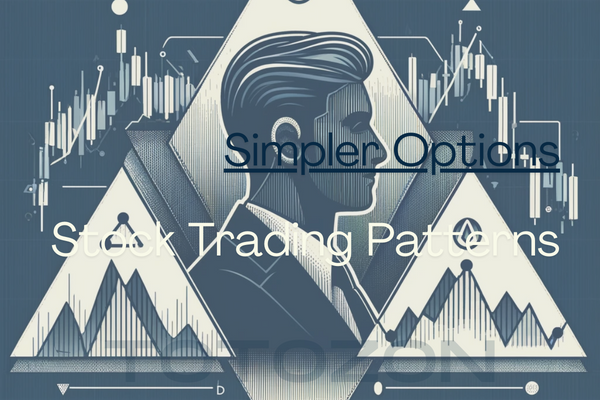 Simpler Options - Stock Trading Patterns
1 × $6.00
Simpler Options - Stock Trading Patterns
1 × $6.00 -
×
 Futures Trading (German)
1 × $6.00
Futures Trading (German)
1 × $6.00 -
×
 Complete Price Action, Volume Profile and Orderflow Trading Bundle with Price Action Volume Trader
1 × $78.00
Complete Price Action, Volume Profile and Orderflow Trading Bundle with Price Action Volume Trader
1 × $78.00 -
×
 Gap Trading for Stock and Options Traders with Damon Verial
1 × $6.00
Gap Trading for Stock and Options Traders with Damon Verial
1 × $6.00 -
×
 Golden Pips Generator - DMA HACK with Hooman
1 × $62.00
Golden Pips Generator - DMA HACK with Hooman
1 × $62.00 -
×
 Quantum Stone Capital
1 × $15.00
Quantum Stone Capital
1 × $15.00 -
×
 NetPicks - Universal Market Trader Course
1 × $6.00
NetPicks - Universal Market Trader Course
1 × $6.00 -
×
 Evidence Based Technical Analysis with David Aronson
1 × $6.00
Evidence Based Technical Analysis with David Aronson
1 × $6.00 -
×
 D.A.T.E. Unlock Your Trading DNA Worskshop with Geoff Bysshe
1 × $6.00
D.A.T.E. Unlock Your Trading DNA Worskshop with Geoff Bysshe
1 × $6.00 -
×
 Rockwell Trading - Can You Make A Living Day Trading - 2 DVD
1 × $6.00
Rockwell Trading - Can You Make A Living Day Trading - 2 DVD
1 × $6.00 -
×
 Pro Trading Blueprint with Limitless Forex Academy
1 × $5.00
Pro Trading Blueprint with Limitless Forex Academy
1 × $5.00 -
×
 Technical Analysis for Short-Term Traders
1 × $6.00
Technical Analysis for Short-Term Traders
1 × $6.00 -
×
 Design for Six Sigma with Subir Chowdhury
1 × $6.00
Design for Six Sigma with Subir Chowdhury
1 × $6.00 -
×
 Campaign Trading with John Sweeney
1 × $6.00
Campaign Trading with John Sweeney
1 × $6.00 -
×
 Super Conference 2020 - Premier Coaching Package with Vince Vora
1 × $109.00
Super Conference 2020 - Premier Coaching Package with Vince Vora
1 × $109.00 -
×
 Indicator Companion for Metastock with Martin Pring
1 × $6.00
Indicator Companion for Metastock with Martin Pring
1 × $6.00 -
×
 Complete Portfolio and Stock Comparison Spreadsheet with Joseph Hogue
1 × $6.00
Complete Portfolio and Stock Comparison Spreadsheet with Joseph Hogue
1 × $6.00 -
×
 Generative AI for Asset Managers Workshop Recording with Ernest Chan
1 × $55.00
Generative AI for Asset Managers Workshop Recording with Ernest Chan
1 × $55.00 -
×
 Lepus Proprietary Trading with Richard Jackson
1 × $6.00
Lepus Proprietary Trading with Richard Jackson
1 × $6.00 -
×
 Elliott Wave Swing High Low Indicator for ThinkorSwim with Fibonacci
1 × $6.00
Elliott Wave Swing High Low Indicator for ThinkorSwim with Fibonacci
1 × $6.00 -
×
 Equity Valuation for Analysts and Investors: A Unique Stock Valuation Tool for Financial Statement Analysis and Model-Building with James Kelleher
1 × $6.00
Equity Valuation for Analysts and Investors: A Unique Stock Valuation Tool for Financial Statement Analysis and Model-Building with James Kelleher
1 × $6.00 -
×
 Order Flow Trading Advanced Masterclass with The Forex Scalpers
1 × $24.00
Order Flow Trading Advanced Masterclass with The Forex Scalpers
1 × $24.00 -
×
 MT4 High Probability Forex Trading Method
1 × $6.00
MT4 High Probability Forex Trading Method
1 × $6.00 -
×
 Algo Trading Masterclass with Ali Casey - StatOasis
1 × $23.00
Algo Trading Masterclass with Ali Casey - StatOasis
1 × $23.00

Investor’s Guide to Charting By Alistair Blair
$6.00
File Size: Cooming soon!
Delivery Time: 1–12 hours
Media Type: Online Course
Content Proof: Watch Here!
You may check content proof of “Investor’s Guide to Charting By Alistair Blair” below:

Investor’s Guide to Charting By Alistair Blair
Introduction
Welcome to the ultimate guide to charting for investors, based on the insights from Alistair Blair. This article aims to provide you with a comprehensive understanding of charting, its importance in investment strategies, and practical tips to enhance your trading skills.
What is Charting?
Charting involves analyzing historical price movements of securities through various types of charts to predict future price movements. It is a fundamental aspect of technical analysis, helping investors make informed decisions.
Why Charting is Essential for Investors
Understanding chart patterns can provide valuable insights into market trends and potential future movements. This can help investors identify entry and exit points, manage risks, and maximize returns.
Types of Charts in Technical Analysis
1. Line Charts
Line charts plot closing prices over a specific period, providing a clear view of the overall trend.
2. Bar Charts
Bar charts display the opening, high, low, and closing prices for each period, giving a more detailed view of price movements.
3. Candlestick Charts
Candlestick charts also show the open, high, low, and close prices but in a more visually appealing format. They are widely used for identifying market patterns.
Key Chart Patterns Every Investor Should Know
1. Head and Shoulders
A reversal pattern that signals a change in trend direction.
2. Double Top and Double Bottom
These patterns indicate potential trend reversals, with the double top suggesting a bearish reversal and the double bottom a bullish reversal.
3. Triangles
Triangles can be ascending, descending, or symmetrical, and they signify continuation or reversal patterns depending on the breakout direction.
Using Indicators in Charting
1. Moving Averages
Moving averages smooth out price data to identify trends. The two most common types are the simple moving average (SMA) and the exponential moving average (EMA).
2. Relative Strength Index (RSI)
RSI measures the speed and change of price movements, helping to identify overbought or oversold conditions.
3. Moving Average Convergence Divergence (MACD)
MACD is a trend-following momentum indicator that shows the relationship between two moving averages.
How to Read Chart Patterns
1. Identifying Trends
Look for higher highs and higher lows for uptrends, and lower highs and lower lows for downtrends.
2. Support and Resistance Levels
Support levels indicate where a price might stop falling, while resistance levels show where a price might stop rising.
3. Volume Analysis
Volume can confirm the strength of a price movement. Higher volume during a price move suggests stronger conviction.
Charting Tools and Software
1. MetaTrader
A popular platform offering a wide range of charting tools and indicators.
2. TradingView
Known for its user-friendly interface and extensive community-driven analysis.
3. Thinkorswim
Provided by TD Ameritrade, it offers professional-level charting capabilities.
Common Mistakes in Charting
1. Overcomplicating Analysis
Stick to a few key indicators and patterns to avoid analysis paralysis.
2. Ignoring Volume
Always consider volume to validate price movements and trends.
3. Not Adjusting for Different Time Frames
Analyze multiple time frames to get a comprehensive view of the market.
Developing a Charting Strategy
1. Define Your Goals
Determine your investment goals and risk tolerance.
2. Backtesting
Test your strategy using historical data to ensure its effectiveness.
3. Stay Updated
Keep learning and adapting to new market conditions and charting techniques.
The Benefits of Using Alistair Blair’s Approach
Alistair Blair’s methodologies emphasize simplicity, clarity, and practical application. By focusing on essential patterns and indicators, investors can make more informed decisions without getting overwhelmed.
Conclusion
Charting is a powerful tool that, when used correctly, can significantly enhance your investment strategy. By following Alistair Blair’s guide, you can develop a robust understanding of charting, identify key patterns, and make informed trading decisions.

Frequently Asked Questions
1. What is the most important chart for beginners to start with?
For beginners, line charts are the easiest to understand and provide a good starting point for identifying trends.
2. How often should I analyze charts?
Regular analysis, such as daily or weekly reviews, can help you stay updated with market trends and make timely decisions.
3. Can charting predict market crashes?
While charting can indicate potential reversals and trends, it cannot predict market crashes with certainty.
4. What is the best charting software for beginners?
TradingView is highly recommended for beginners due to its user-friendly interface and extensive educational resources.
5. How do I combine multiple indicators in my analysis?
Start with a few key indicators, like moving averages and RSI, and gradually incorporate more as you become comfortable with your analysis.
Be the first to review “Investor’s Guide to Charting By Alistair Blair”
You must be logged in to post a review.
Related products
Forex Trading
Original price was: $1,898.00.$10.00Current price is: $10.00.

Forex Trading
Original price was: $249.00.$15.00Current price is: $15.00.

Original price was: $4,995.00.$15.00Current price is: $15.00.

Original price was: $649.00.$20.00Current price is: $20.00.

Forex Trading
Original price was: $797.00.$10.00Current price is: $10.00.

Forex Trading
Original price was: $2,995.00.$31.00Current price is: $31.00.

Forex Trading
Original price was: $125.00.$17.00Current price is: $17.00.

Forex Trading
Original price was: $4,997.00.$27.00Current price is: $27.00.

Original price was: $310.00.$23.00Current price is: $23.00.

Original price was: $999.00.$5.00Current price is: $5.00.

Original price was: $139.00.$23.00Current price is: $23.00.

Forex Trading
Original price was: $550.00.$5.00Current price is: $5.00.

Forex Trading
Original price was: $850.00.$23.00Current price is: $23.00.

Forex Trading
Original price was: $999.00.$15.00Current price is: $15.00.

Original price was: $1,800.00.$54.00Current price is: $54.00.

Forex Trading
Original price was: $499.00.$15.00Current price is: $15.00.

Forex Trading
Original price was: $500.00.$5.00Current price is: $5.00.

Original price was: $1,200.00.$23.00Current price is: $23.00.

Forex Trading
Original price was: $2,997.00.$23.00Current price is: $23.00.

Forex Trading
Original price was: $697.00.$5.00Current price is: $5.00.

Reviews
There are no reviews yet.