-
×
 Secret $100k Meeting with Russell Brunson
1 × $6.00
Secret $100k Meeting with Russell Brunson
1 × $6.00 -
×
 Generating Consistent Profits On Smaller Accounts
1 × $23.00
Generating Consistent Profits On Smaller Accounts
1 × $23.00 -
×
 Cluster Delta with Gova Trading Academy
1 × $5.00
Cluster Delta with Gova Trading Academy
1 × $5.00 -
×
 Advanced Spread Trading with Guy Bower - MasterClass Trader
1 × $15.00
Advanced Spread Trading with Guy Bower - MasterClass Trader
1 × $15.00 -
×
 Profiletraders - MARKET PROFILE TACTICAL STRATEGIES FOR DAY TRADING
1 × $23.00
Profiletraders - MARKET PROFILE TACTICAL STRATEGIES FOR DAY TRADING
1 × $23.00 -
×
 How to Create Better Trading Opportunities through Hedging with Jon Najarian
1 × $6.00
How to Create Better Trading Opportunities through Hedging with Jon Najarian
1 × $6.00 -
×
 Fibonacci Trading & Dynamic Profit Targeting with Base Camp Trading
1 × $15.00
Fibonacci Trading & Dynamic Profit Targeting with Base Camp Trading
1 × $15.00 -
×
 The MissionFX Compounding Course with Nick Shawn
1 × $5.00
The MissionFX Compounding Course with Nick Shawn
1 × $5.00 -
×
 HST Mobile
1 × $31.00
HST Mobile
1 × $31.00 -
×
 Confidence Game. How a Hadge Fund Manager Called Wall Street’s Bluff with Christine Richard
1 × $6.00
Confidence Game. How a Hadge Fund Manager Called Wall Street’s Bluff with Christine Richard
1 × $6.00 -
×
 Spartan Renko 2.0 Workshop 2017
1 × $23.00
Spartan Renko 2.0 Workshop 2017
1 × $23.00 -
×
 Scalping Strategy Webinar! recorded. BEST WEBINAR
1 × $23.00
Scalping Strategy Webinar! recorded. BEST WEBINAR
1 × $23.00 -
×
 The Sweep Show with Scott Pulcini Trader
1 × $23.00
The Sweep Show with Scott Pulcini Trader
1 × $23.00 -
×
 Fractal Flow Strategy Video Course with Fractal Flow Pro
1 × $6.00
Fractal Flow Strategy Video Course with Fractal Flow Pro
1 × $6.00 -
×
 Simple Smart Forex Renko Program with Nikos Mermigas
1 × $10.00
Simple Smart Forex Renko Program with Nikos Mermigas
1 × $10.00 -
×
 Flow Indicator Software Perfect for Futures Ninjatrader
1 × $23.00
Flow Indicator Software Perfect for Futures Ninjatrader
1 × $23.00 -
×
 The A14 Weekly Option Strategy Workshop with Amy Meissner
1 × $23.00
The A14 Weekly Option Strategy Workshop with Amy Meissner
1 × $23.00 -
×
 Learn Investing & Trading with Danny Devan
1 × $23.00
Learn Investing & Trading with Danny Devan
1 × $23.00 -
×
 Market Controller Course with Controller FX
1 × $5.00
Market Controller Course with Controller FX
1 × $5.00 -
×
 Dan Sheridan Volatility Class
1 × $6.00
Dan Sheridan Volatility Class
1 × $6.00 -
×
 Pentagonal Time Cycle Theory
1 × $6.00
Pentagonal Time Cycle Theory
1 × $6.00 -
×
 Forex Mentor Seminar with Peter Bain
1 × $6.00
Forex Mentor Seminar with Peter Bain
1 × $6.00 -
×
 Profitable Strategies with Gemify Academy
1 × $10.00
Profitable Strategies with Gemify Academy
1 × $10.00 -
×
 Sacredscience - W.T.Foster – Sunspots and Weather
1 × $6.00
Sacredscience - W.T.Foster – Sunspots and Weather
1 × $6.00 -
×
 Storehouse Tutorial Group Videos
1 × $23.00
Storehouse Tutorial Group Videos
1 × $23.00 -
×
 How To Develop A Winning Trading System That Fits You Home Study + Audio - 2020 with Van Tharp
1 × $62.00
How To Develop A Winning Trading System That Fits You Home Study + Audio - 2020 with Van Tharp
1 × $62.00 -
×
 The Kiloby Inquiries Online with Scott Kiloby
1 × $39.00
The Kiloby Inquiries Online with Scott Kiloby
1 × $39.00 -
×
 How I've Achieved Triple-Digit Returns Daytrading: 4 Hours A Day with David Floyd
1 × $6.00
How I've Achieved Triple-Digit Returns Daytrading: 4 Hours A Day with David Floyd
1 × $6.00 -
×
 Amibroker CBT Intensive Course with Matt Radtke
1 × $31.00
Amibroker CBT Intensive Course with Matt Radtke
1 × $31.00 -
×
 Emini, Forex, Stock Course COMPLETE Series Recorded Seminar 2009 - 49 Modules in 3 DVDs (SpecialistTrading.com)
1 × $78.00
Emini, Forex, Stock Course COMPLETE Series Recorded Seminar 2009 - 49 Modules in 3 DVDs (SpecialistTrading.com)
1 × $78.00 -
×
 Power Cycle Trading The Ultimate Option Guide: When & How to Use Which Option Strategy For the Best Results - Powercycletrading
1 × $69.00
Power Cycle Trading The Ultimate Option Guide: When & How to Use Which Option Strategy For the Best Results - Powercycletrading
1 × $69.00 -
×
 ICT Prodigy Trading Course – $650K in Payouts with Alex Solignani
1 × $15.00
ICT Prodigy Trading Course – $650K in Payouts with Alex Solignani
1 × $15.00 -
×
 Outsmarting Wall Street (3rd Ed) with Daniel Alan Seiver
1 × $6.00
Outsmarting Wall Street (3rd Ed) with Daniel Alan Seiver
1 × $6.00 -
×
 Investing Online with Benton E.Gup
1 × $6.00
Investing Online with Benton E.Gup
1 × $6.00 -
×
 Options Trading & Ultimate MasterClass With Tyrone Abela - FX Evolution
1 × $54.00
Options Trading & Ultimate MasterClass With Tyrone Abela - FX Evolution
1 × $54.00 -
×
 FuturesTrader71 - webinar series (4 webinars)
1 × $6.00
FuturesTrader71 - webinar series (4 webinars)
1 × $6.00 -
×
 Increase Your Net Worth In 2 Hours A Week with Jerremy Newsome - Real Life Trading
1 × $17.00
Increase Your Net Worth In 2 Hours A Week with Jerremy Newsome - Real Life Trading
1 × $17.00 -
×
 Diary of an Internet Trader with Alpesh Patel
1 × $6.00
Diary of an Internet Trader with Alpesh Patel
1 × $6.00 -
×
 George Wollsten: Expert Stock and Grain Trader with George Bayer
1 × $6.00
George Wollsten: Expert Stock and Grain Trader with George Bayer
1 × $6.00 -
×
 Edz Currency Trading Package with EDZ Trading Academy
1 × $5.00
Edz Currency Trading Package with EDZ Trading Academy
1 × $5.00 -
×
 Earnings Reaction Gaps Workshop with John Pocorobba
1 × $27.00
Earnings Reaction Gaps Workshop with John Pocorobba
1 × $27.00 -
×
 Double Your Capital In 30 Days(2016) with GFA Flips
1 × $5.00
Double Your Capital In 30 Days(2016) with GFA Flips
1 × $5.00 -
×
 TechnicalProsperity - Red Package
1 × $15.00
TechnicalProsperity - Red Package
1 × $15.00 -
×
 Master Strategies of Super Achievers By Steven Scott
1 × $23.00
Master Strategies of Super Achievers By Steven Scott
1 × $23.00 -
×
 SnD SMC Course
1 × $10.00
SnD SMC Course
1 × $10.00 -
×
 Essential Skills for Consistency in Trading Class with Don Kaufman
1 × $6.00
Essential Skills for Consistency in Trading Class with Don Kaufman
1 × $6.00 -
×
 Forecast 2024 Clarification with Larry Williams
1 × $15.00
Forecast 2024 Clarification with Larry Williams
1 × $15.00 -
×
 Art & Science of Trend Trading Class with Jeff Bierman
1 × $6.00
Art & Science of Trend Trading Class with Jeff Bierman
1 × $6.00 -
×
 High Probability Trading Using Elliott Wave And Fibonacci Analysis withVic Patel - Forex Training Group
1 × $10.00
High Probability Trading Using Elliott Wave And Fibonacci Analysis withVic Patel - Forex Training Group
1 × $10.00 -
×
 The Indices Orderflow Masterclass with The Forex Scalpers
1 × $23.00
The Indices Orderflow Masterclass with The Forex Scalpers
1 × $23.00 -
×
 Tandem Trader with Investors Underground
1 × $6.00
Tandem Trader with Investors Underground
1 × $6.00 -
×
 Royal Exchange Forex with Jan Teslar
1 × $6.00
Royal Exchange Forex with Jan Teslar
1 × $6.00 -
×
 Forex Secrets Exposed
1 × $15.00
Forex Secrets Exposed
1 × $15.00 -
×
 Executive Mentoring Elliot Wave Course (Video & Manuals)
1 × $6.00
Executive Mentoring Elliot Wave Course (Video & Manuals)
1 × $6.00 -
×
 Double Top Trader Trading System with Anthony Gibson
1 × $6.00
Double Top Trader Trading System with Anthony Gibson
1 × $6.00 -
×
 Learn Plan Profit – How To Trade Stocks
1 × $15.00
Learn Plan Profit – How To Trade Stocks
1 × $15.00 -
×
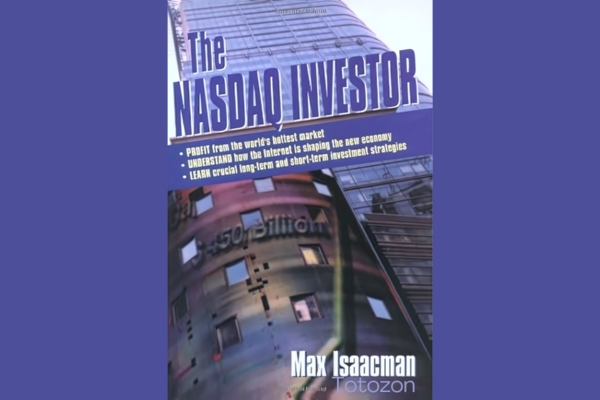 The Nasdaq Investor with Max Isaacman
1 × $6.00
The Nasdaq Investor with Max Isaacman
1 × $6.00 -
×
 Startup Trading Masterclass with Jack Gleason
1 × $93.00
Startup Trading Masterclass with Jack Gleason
1 × $93.00 -
×
 Creating the Optimal Trade for Explosive Profits with George A.Fontanills
1 × $6.00
Creating the Optimal Trade for Explosive Profits with George A.Fontanills
1 × $6.00 -
×
 Advanced Strategies for Option Trading Success with James Bittman
1 × $6.00
Advanced Strategies for Option Trading Success with James Bittman
1 × $6.00 -
×
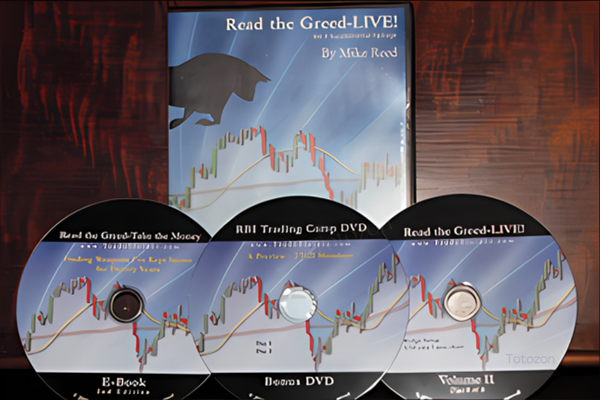 Read the Greed-Live! Course
1 × $15.00
Read the Greed-Live! Course
1 × $15.00 -
×
 F.A.M.E. Home Study Course with Doug Sutton
1 × $6.00
F.A.M.E. Home Study Course with Doug Sutton
1 × $6.00 -
×
 RSI Basic with Andrew Cardwell
1 × $54.00
RSI Basic with Andrew Cardwell
1 × $54.00 -
×
 Picking the Best Stocks & Strategies for every Option Trade with James Bittman
1 × $6.00
Picking the Best Stocks & Strategies for every Option Trade with James Bittman
1 × $6.00 -
×
 Profit Trading VIX Options Course with Don Kaufman
1 × $6.00
Profit Trading VIX Options Course with Don Kaufman
1 × $6.00 -
×
 Geometric Angles Applied To Modern Markets with Sean Avidar
1 × $39.00
Geometric Angles Applied To Modern Markets with Sean Avidar
1 × $39.00 -
×
 Options Trading with Adam Grimes - MarketLife
1 × $5.00
Options Trading with Adam Grimes - MarketLife
1 × $5.00 -
×
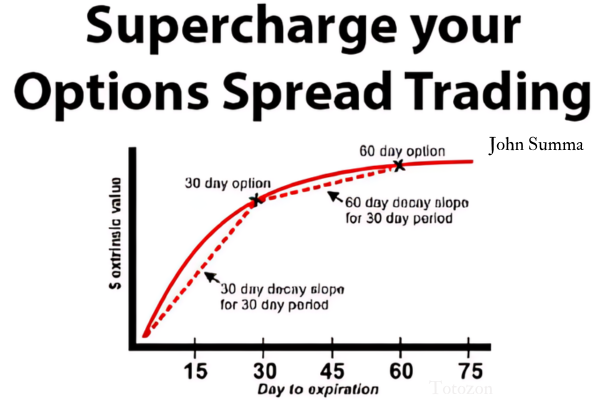 Supercharge your Options Spread Trading with John Summa
1 × $6.00
Supercharge your Options Spread Trading with John Summa
1 × $6.00 -
×
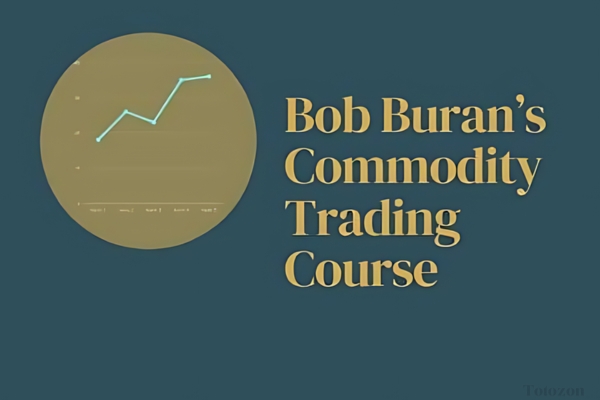 Commodity Trading Video Course with Bob Buran
1 × $6.00
Commodity Trading Video Course with Bob Buran
1 × $6.00 -
×
 Algo Trading Masterclass with Ali Casey - StatOasis
1 × $23.00
Algo Trading Masterclass with Ali Casey - StatOasis
1 × $23.00

Investor’s Guide to Charting By Alistair Blair
$6.00
File Size: Cooming soon!
Delivery Time: 1–12 hours
Media Type: Online Course
Content Proof: Watch Here!
You may check content proof of “Investor’s Guide to Charting By Alistair Blair” below:

Investor’s Guide to Charting By Alistair Blair
Introduction
Welcome to the ultimate guide to charting for investors, based on the insights from Alistair Blair. This article aims to provide you with a comprehensive understanding of charting, its importance in investment strategies, and practical tips to enhance your trading skills.
What is Charting?
Charting involves analyzing historical price movements of securities through various types of charts to predict future price movements. It is a fundamental aspect of technical analysis, helping investors make informed decisions.
Why Charting is Essential for Investors
Understanding chart patterns can provide valuable insights into market trends and potential future movements. This can help investors identify entry and exit points, manage risks, and maximize returns.
Types of Charts in Technical Analysis
1. Line Charts
Line charts plot closing prices over a specific period, providing a clear view of the overall trend.
2. Bar Charts
Bar charts display the opening, high, low, and closing prices for each period, giving a more detailed view of price movements.
3. Candlestick Charts
Candlestick charts also show the open, high, low, and close prices but in a more visually appealing format. They are widely used for identifying market patterns.
Key Chart Patterns Every Investor Should Know
1. Head and Shoulders
A reversal pattern that signals a change in trend direction.
2. Double Top and Double Bottom
These patterns indicate potential trend reversals, with the double top suggesting a bearish reversal and the double bottom a bullish reversal.
3. Triangles
Triangles can be ascending, descending, or symmetrical, and they signify continuation or reversal patterns depending on the breakout direction.
Using Indicators in Charting
1. Moving Averages
Moving averages smooth out price data to identify trends. The two most common types are the simple moving average (SMA) and the exponential moving average (EMA).
2. Relative Strength Index (RSI)
RSI measures the speed and change of price movements, helping to identify overbought or oversold conditions.
3. Moving Average Convergence Divergence (MACD)
MACD is a trend-following momentum indicator that shows the relationship between two moving averages.
How to Read Chart Patterns
1. Identifying Trends
Look for higher highs and higher lows for uptrends, and lower highs and lower lows for downtrends.
2. Support and Resistance Levels
Support levels indicate where a price might stop falling, while resistance levels show where a price might stop rising.
3. Volume Analysis
Volume can confirm the strength of a price movement. Higher volume during a price move suggests stronger conviction.
Charting Tools and Software
1. MetaTrader
A popular platform offering a wide range of charting tools and indicators.
2. TradingView
Known for its user-friendly interface and extensive community-driven analysis.
3. Thinkorswim
Provided by TD Ameritrade, it offers professional-level charting capabilities.
Common Mistakes in Charting
1. Overcomplicating Analysis
Stick to a few key indicators and patterns to avoid analysis paralysis.
2. Ignoring Volume
Always consider volume to validate price movements and trends.
3. Not Adjusting for Different Time Frames
Analyze multiple time frames to get a comprehensive view of the market.
Developing a Charting Strategy
1. Define Your Goals
Determine your investment goals and risk tolerance.
2. Backtesting
Test your strategy using historical data to ensure its effectiveness.
3. Stay Updated
Keep learning and adapting to new market conditions and charting techniques.
The Benefits of Using Alistair Blair’s Approach
Alistair Blair’s methodologies emphasize simplicity, clarity, and practical application. By focusing on essential patterns and indicators, investors can make more informed decisions without getting overwhelmed.
Conclusion
Charting is a powerful tool that, when used correctly, can significantly enhance your investment strategy. By following Alistair Blair’s guide, you can develop a robust understanding of charting, identify key patterns, and make informed trading decisions.

Frequently Asked Questions
1. What is the most important chart for beginners to start with?
For beginners, line charts are the easiest to understand and provide a good starting point for identifying trends.
2. How often should I analyze charts?
Regular analysis, such as daily or weekly reviews, can help you stay updated with market trends and make timely decisions.
3. Can charting predict market crashes?
While charting can indicate potential reversals and trends, it cannot predict market crashes with certainty.
4. What is the best charting software for beginners?
TradingView is highly recommended for beginners due to its user-friendly interface and extensive educational resources.
5. How do I combine multiple indicators in my analysis?
Start with a few key indicators, like moving averages and RSI, and gradually incorporate more as you become comfortable with your analysis.
Be the first to review “Investor’s Guide to Charting By Alistair Blair”
You must be logged in to post a review.
Related products

Forex Trading
Original price was: $550.00.$5.00Current price is: $5.00.
Forex Trading
Original price was: $797.00.$10.00Current price is: $10.00.
Forex Trading
Original price was: $249.00.$15.00Current price is: $15.00.

Forex Trading
Original price was: $4,997.00.$27.00Current price is: $27.00.

Original price was: $695.00.$41.00Current price is: $41.00.

Forex Trading
Original price was: $125.00.$17.00Current price is: $17.00.

Original price was: $799.00.$15.00Current price is: $15.00.

Original price was: $299.00.$8.00Current price is: $8.00.

Forex Trading
The Complete Guide to Multiple Time Frame Analysis & Reading Price Action with Aiman Almansoori
Original price was: $1,399.00.$13.00Current price is: $13.00.

Forex Trading
Original price was: $1,098.00.$39.00Current price is: $39.00.

Original price was: $1,200.00.$23.00Current price is: $23.00.

Original price was: $997.00.$8.00Current price is: $8.00.
Original price was: $310.00.$23.00Current price is: $23.00.

Forex Trading
Original price was: $397.00.$31.00Current price is: $31.00.

Original price was: $997.00.$13.00Current price is: $13.00.

Original price was: $1,849.00.$15.00Current price is: $15.00.

Original price was: $700.00.$39.00Current price is: $39.00.

Original price was: $4,995.00.$15.00Current price is: $15.00.

Original price was: $139.00.$23.00Current price is: $23.00.

Forex Trading
Original price was: $239.00.$8.00Current price is: $8.00.

Reviews
There are no reviews yet.