-
×
 Day Trading Options Guide PDF with Matt Diamond
1 × $23.00
Day Trading Options Guide PDF with Matt Diamond
1 × $23.00 -
×
 SO FX Educational Course with SO FX
1 × $5.00
SO FX Educational Course with SO FX
1 × $5.00 -
×
 Harnessing Explosive Market Turns - 3 DVD with Jeff Greenblatt
1 × $6.00
Harnessing Explosive Market Turns - 3 DVD with Jeff Greenblatt
1 × $6.00 -
×
 Developing Profitable Systems from Discretionary to Mechanical with Fred Shutzman
1 × $6.00
Developing Profitable Systems from Discretionary to Mechanical with Fred Shutzman
1 × $6.00 -
×
 Daytrade (Italian) with Guiuseppe Migliorino
1 × $6.00
Daytrade (Italian) with Guiuseppe Migliorino
1 × $6.00 -
×
 Hedge Fund Market Wizards: How Winning Traders Win with Jack Schwager
1 × $6.00
Hedge Fund Market Wizards: How Winning Traders Win with Jack Schwager
1 × $6.00 -
×
 HST Mobile
1 × $31.00
HST Mobile
1 × $31.00 -
×
 How to Trade a Vertical Market with Armstrong Economics
1 × $155.00
How to Trade a Vertical Market with Armstrong Economics
1 × $155.00 -
×
 Stock Market Strategies That Work with Jack Bernstein
1 × $6.00
Stock Market Strategies That Work with Jack Bernstein
1 × $6.00 -
×
 Exchange-Traded Derivatives with Erik Banks
1 × $6.00
Exchange-Traded Derivatives with Erik Banks
1 × $6.00 -
×
 SRC (Smart Raja Concepts) with Forex 101
1 × $5.00
SRC (Smart Raja Concepts) with Forex 101
1 × $5.00 -
×
 How You Can Be Right While the Crowd Loses with Jack Bernstein
1 × $6.00
How You Can Be Right While the Crowd Loses with Jack Bernstein
1 × $6.00 -
×
 Crypto Trading Academy with Cheeky Investor - Aussie Day Trader
1 × $13.00
Crypto Trading Academy with Cheeky Investor - Aussie Day Trader
1 × $13.00 -
×
 JokerSZN Course with David
1 × $20.00
JokerSZN Course with David
1 × $20.00 -
×
 Evolve MasterClass with Irek Piekarski
1 × $13.00
Evolve MasterClass with Irek Piekarski
1 × $13.00 -
×
 Electronic Day Traders' Secrets: Learn From the Best of the Best DayTraders with Burton Friedfertig
1 × $6.00
Electronic Day Traders' Secrets: Learn From the Best of the Best DayTraders with Burton Friedfertig
1 × $6.00 -
×
 The Great Depression with David Burg
1 × $6.00
The Great Depression with David Burg
1 × $6.00 -
×
 FlowRider Trading Course with Boris Schlossberg and Kathy Lien - Bkforex
1 × $15.00
FlowRider Trading Course with Boris Schlossberg and Kathy Lien - Bkforex
1 × $15.00 -
×
 How To Build An Automated Trading Robot In Excel with Peter Titus - Marwood Research
1 × $15.00
How To Build An Automated Trading Robot In Excel with Peter Titus - Marwood Research
1 × $15.00 -
×
 Order Flow Mastery (New 2024) with The Volume Traders
1 × $24.00
Order Flow Mastery (New 2024) with The Volume Traders
1 × $24.00 -
×
 The Chaos Course. Cash in on Chaos with Hans Hannula
1 × $6.00
The Chaos Course. Cash in on Chaos with Hans Hannula
1 × $6.00 -
×
 Becoming Rich with Mark Tier
1 × $6.00
Becoming Rich with Mark Tier
1 × $6.00 -
×
 Traders Workshop – Forex Full Course with Jason Stapleton
1 × $6.00
Traders Workshop – Forex Full Course with Jason Stapleton
1 × $6.00 -
×
 Risk Management with Aswath Damodaran
1 × $6.00
Risk Management with Aswath Damodaran
1 × $6.00 -
×
 Heiken Ashi 101
1 × $15.00
Heiken Ashi 101
1 × $15.00 -
×
 Investment Philosophies
1 × $6.00
Investment Philosophies
1 × $6.00 -
×
 How I Turned 500 USD to 6 Figures in 2 months Trading Options with The Money Printers
1 × $8.00
How I Turned 500 USD to 6 Figures in 2 months Trading Options with The Money Printers
1 × $8.00 -
×
 Forex Time Machine with Bill Poulos
1 × $6.00
Forex Time Machine with Bill Poulos
1 × $6.00 -
×
 Commodities for Dummies with Amine Bouchentouf
1 × $6.00
Commodities for Dummies with Amine Bouchentouf
1 × $6.00 -
×
 How to Collect Income Being Short with Don Kaufman
1 × $6.00
How to Collect Income Being Short with Don Kaufman
1 × $6.00 -
×
 Selling Options for Income, Profits & Opportunistic Hedge Trading Management with Powercycletrading
1 × $69.00
Selling Options for Income, Profits & Opportunistic Hedge Trading Management with Powercycletrading
1 × $69.00 -
×
 $20 – 52k 20 pips a day challange with Rafał Zuchowicz - TopMasterTrader
1 × $5.00
$20 – 52k 20 pips a day challange with Rafał Zuchowicz - TopMasterTrader
1 × $5.00 -
×
 OFA - Intensive Boot Camp 5 Day Course
1 × $6.00
OFA - Intensive Boot Camp 5 Day Course
1 × $6.00 -
×
 Fundamentals of Futures & Options Markets (4th Ed.)
1 × $6.00
Fundamentals of Futures & Options Markets (4th Ed.)
1 × $6.00 -
×
 Floor Traders Edge Mentorship Program with Market Geeks
1 × $6.00
Floor Traders Edge Mentorship Program with Market Geeks
1 × $6.00 -
×
 How to Build Fortune. Trading Stock Index Futures with Dennis Minogue
1 × $6.00
How to Build Fortune. Trading Stock Index Futures with Dennis Minogue
1 × $6.00 -
×
 MTI - Basics UTP
1 × $6.00
MTI - Basics UTP
1 × $6.00 -
×
 How To Be a Profitable Forex Trader with Corey Halliday
1 × $6.00
How To Be a Profitable Forex Trader with Corey Halliday
1 × $6.00 -
×
 Gillen Predicts with Jack Gillen
1 × $6.00
Gillen Predicts with Jack Gillen
1 × $6.00 -
×
 Stock Trading Course Level 2 Market Snapper™ 2019 with Piranha Profits
1 × $6.00
Stock Trading Course Level 2 Market Snapper™ 2019 with Piranha Profits
1 × $6.00 -
×
 The Blockchain Bootcamp 2.0 with Gregory (Dapp University)
1 × $15.00
The Blockchain Bootcamp 2.0 with Gregory (Dapp University)
1 × $15.00 -
×
 Algo Wizard Essentials Course with Srategy Quant
1 × $13.00
Algo Wizard Essentials Course with Srategy Quant
1 × $13.00 -
×
 Executive Mentoring Elliot Wave Course (Video & Manuals)
1 × $6.00
Executive Mentoring Elliot Wave Course (Video & Manuals)
1 × $6.00 -
×
 Lee Gettess’s Package
1 × $6.00
Lee Gettess’s Package
1 × $6.00 -
×
 How To Become StressFree Trader with Jason Starzec
1 × $4.00
How To Become StressFree Trader with Jason Starzec
1 × $4.00 -
×
 Perfect Publishing System Elite with Johnny Andrews
1 × $6.00
Perfect Publishing System Elite with Johnny Andrews
1 × $6.00 -
×
 Secrets of Investors on WallStreet (Audio) with Ken Fisher
1 × $6.00
Secrets of Investors on WallStreet (Audio) with Ken Fisher
1 × $6.00 -
×
 The Apple Way with Jeffrey Cruikshank
1 × $6.00
The Apple Way with Jeffrey Cruikshank
1 × $6.00 -
×
 Investing In Fixer-Uppers 2003 with Jay DeCima
1 × $6.00
Investing In Fixer-Uppers 2003 with Jay DeCima
1 × $6.00 -
×
 Optimize Funding Program with Solo Network
1 × $5.00
Optimize Funding Program with Solo Network
1 × $5.00 -
×
 Master The Art of Technical Analysis with Raul Gonzalez
1 × $31.00
Master The Art of Technical Analysis with Raul Gonzalez
1 × $31.00 -
×
 Volume Profile 2023 (Elite Pack) with Trader Dale
1 × $5.00
Volume Profile 2023 (Elite Pack) with Trader Dale
1 × $5.00 -
×
 Advanced Price Action Course with Chris Capre
1 × $7.00
Advanced Price Action Course with Chris Capre
1 × $7.00 -
×
 Alternative Beta Strategies & Hedge Fund Replication with Lars Jaeger & Jeffrey Pease
1 × $6.00
Alternative Beta Strategies & Hedge Fund Replication with Lars Jaeger & Jeffrey Pease
1 × $6.00 -
×
 Starting Out in Futures Trading with Mark Powers
1 × $6.00
Starting Out in Futures Trading with Mark Powers
1 × $6.00 -
×
 Forex Trader Package 2010
1 × $15.00
Forex Trader Package 2010
1 × $15.00 -
×
 How to be a Sector Investor with Larry Hungerford & Steve Hungerford
1 × $4.00
How to be a Sector Investor with Larry Hungerford & Steve Hungerford
1 × $4.00 -
×
 Foundation of Successful Trading - 2 DVDs and Bonus Gann Time Factor 2 DVDs
1 × $31.00
Foundation of Successful Trading - 2 DVDs and Bonus Gann Time Factor 2 DVDs
1 × $31.00 -
×
 Master Commodities Course
1 × $6.00
Master Commodities Course
1 × $6.00 -
×
 Day One Trader with John Sussex
1 × $6.00
Day One Trader with John Sussex
1 × $6.00 -
×
 Low Timeframe Supply & Demand with RROP
1 × $5.00
Low Timeframe Supply & Demand with RROP
1 × $5.00 -
×
 Longlived Information & Intraday Pattern (Article) with Back and Andersen
1 × $6.00
Longlived Information & Intraday Pattern (Article) with Back and Andersen
1 × $6.00 -
×
 Starter Guide to Investing Stocks, Crypto & Precious Metals with Ryan Hogue
1 × $5.00
Starter Guide to Investing Stocks, Crypto & Precious Metals with Ryan Hogue
1 × $5.00 -
×
 Plunketts Investment & Securities Industry Almanac 2010 with Jack W.Plunkett
1 × $6.00
Plunketts Investment & Securities Industry Almanac 2010 with Jack W.Plunkett
1 × $6.00 -
×
 Exploring MetaStock Basic with Martin Pring
1 × $6.00
Exploring MetaStock Basic with Martin Pring
1 × $6.00 -
×
 Synthetic and Structured Assets: A Practical Guide to Investment and Risk with Erik Banks
1 × $6.00
Synthetic and Structured Assets: A Practical Guide to Investment and Risk with Erik Banks
1 × $6.00 -
×
 Quantamentals - The Next Great Forefront Of Trading and Investing with Trading Markets
1 × $8.00
Quantamentals - The Next Great Forefront Of Trading and Investing with Trading Markets
1 × $8.00 -
×
 T3 Live - The Simple Art of Trading
1 × $31.00
T3 Live - The Simple Art of Trading
1 × $31.00 -
×
 Investors Underground - Tandem Trader
1 × $5.00
Investors Underground - Tandem Trader
1 × $5.00 -
×
 The MMXM Traders Course - The MMXM Trader
1 × $5.00
The MMXM Traders Course - The MMXM Trader
1 × $5.00 -
×
 Marder Videos Reports 2019-2022 with Kevin Marder
1 × $104.00
Marder Videos Reports 2019-2022 with Kevin Marder
1 × $104.00 -
×
 Strike Zone Strategy 2.0 Elite Package with Joe Rokop
1 × $39.00
Strike Zone Strategy 2.0 Elite Package with Joe Rokop
1 × $39.00 -
×
 Market Structure Masterclass with Braveheart Trading
1 × $5.00
Market Structure Masterclass with Braveheart Trading
1 × $5.00 -
×
 Power Charting - Robert’s Indicator Webinar
1 × $6.00
Power Charting - Robert’s Indicator Webinar
1 × $6.00 -
×
 Neural Networks in Trading with Dr. Ernest P. Chan
1 × $31.00
Neural Networks in Trading with Dr. Ernest P. Chan
1 × $31.00 -
×
 Algo Trading Masterclass with Ali Casey - StatOasis
1 × $23.00
Algo Trading Masterclass with Ali Casey - StatOasis
1 × $23.00

Investor’s Guide to Charting By Alistair Blair
$6.00
File Size: Cooming soon!
Delivery Time: 1–12 hours
Media Type: Online Course
Content Proof: Watch Here!
You may check content proof of “Investor’s Guide to Charting By Alistair Blair” below:

Investor’s Guide to Charting By Alistair Blair
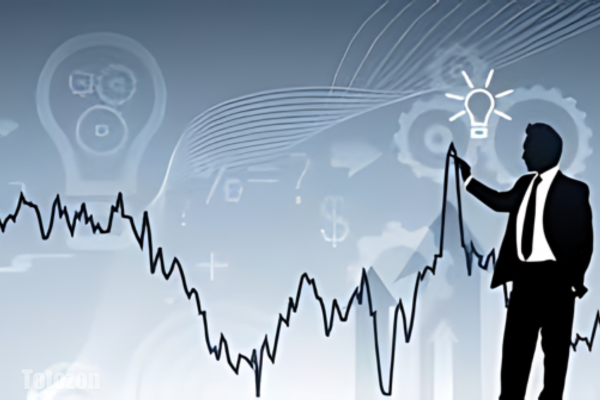
Introduction
Welcome to the ultimate guide to charting for investors, based on the insights from Alistair Blair. This article aims to provide you with a comprehensive understanding of charting, its importance in investment strategies, and practical tips to enhance your trading skills.
What is Charting?
Charting involves analyzing historical price movements of securities through various types of charts to predict future price movements. It is a fundamental aspect of technical analysis, helping investors make informed decisions.
Why Charting is Essential for Investors
Understanding chart patterns can provide valuable insights into market trends and potential future movements. This can help investors identify entry and exit points, manage risks, and maximize returns.
Types of Charts in Technical Analysis
1. Line Charts
Line charts plot closing prices over a specific period, providing a clear view of the overall trend.
2. Bar Charts
Bar charts display the opening, high, low, and closing prices for each period, giving a more detailed view of price movements.
3. Candlestick Charts
Candlestick charts also show the open, high, low, and close prices but in a more visually appealing format. They are widely used for identifying market patterns.
Key Chart Patterns Every Investor Should Know
1. Head and Shoulders
A reversal pattern that signals a change in trend direction.
2. Double Top and Double Bottom
These patterns indicate potential trend reversals, with the double top suggesting a bearish reversal and the double bottom a bullish reversal.
3. Triangles
Triangles can be ascending, descending, or symmetrical, and they signify continuation or reversal patterns depending on the breakout direction.
Using Indicators in Charting
1. Moving Averages
Moving averages smooth out price data to identify trends. The two most common types are the simple moving average (SMA) and the exponential moving average (EMA).
2. Relative Strength Index (RSI)
RSI measures the speed and change of price movements, helping to identify overbought or oversold conditions.
3. Moving Average Convergence Divergence (MACD)
MACD is a trend-following momentum indicator that shows the relationship between two moving averages.
How to Read Chart Patterns
1. Identifying Trends
Look for higher highs and higher lows for uptrends, and lower highs and lower lows for downtrends.
2. Support and Resistance Levels
Support levels indicate where a price might stop falling, while resistance levels show where a price might stop rising.
3. Volume Analysis
Volume can confirm the strength of a price movement. Higher volume during a price move suggests stronger conviction.
Charting Tools and Software
1. MetaTrader
A popular platform offering a wide range of charting tools and indicators.
2. TradingView
Known for its user-friendly interface and extensive community-driven analysis.
3. Thinkorswim
Provided by TD Ameritrade, it offers professional-level charting capabilities.
Common Mistakes in Charting
1. Overcomplicating Analysis
Stick to a few key indicators and patterns to avoid analysis paralysis.
2. Ignoring Volume
Always consider volume to validate price movements and trends.
3. Not Adjusting for Different Time Frames
Analyze multiple time frames to get a comprehensive view of the market.
Developing a Charting Strategy
1. Define Your Goals
Determine your investment goals and risk tolerance.
2. Backtesting
Test your strategy using historical data to ensure its effectiveness.
3. Stay Updated
Keep learning and adapting to new market conditions and charting techniques.
The Benefits of Using Alistair Blair’s Approach
Alistair Blair’s methodologies emphasize simplicity, clarity, and practical application. By focusing on essential patterns and indicators, investors can make more informed decisions without getting overwhelmed.
Conclusion
Charting is a powerful tool that, when used correctly, can significantly enhance your investment strategy. By following Alistair Blair’s guide, you can develop a robust understanding of charting, identify key patterns, and make informed trading decisions.

Frequently Asked Questions
1. What is the most important chart for beginners to start with?
For beginners, line charts are the easiest to understand and provide a good starting point for identifying trends.
2. How often should I analyze charts?
Regular analysis, such as daily or weekly reviews, can help you stay updated with market trends and make timely decisions.
3. Can charting predict market crashes?
While charting can indicate potential reversals and trends, it cannot predict market crashes with certainty.
4. What is the best charting software for beginners?
TradingView is highly recommended for beginners due to its user-friendly interface and extensive educational resources.
5. How do I combine multiple indicators in my analysis?
Start with a few key indicators, like moving averages and RSI, and gradually incorporate more as you become comfortable with your analysis.
Be the first to review “Investor’s Guide to Charting By Alistair Blair”
You must be logged in to post a review.
Related products

Forex Trading
Original price was: $850.00.$23.00Current price is: $23.00.

Original price was: $695.00.$41.00Current price is: $41.00.

Forex Trading
Original price was: $2,997.00.$23.00Current price is: $23.00.

Original price was: $310.00.$23.00Current price is: $23.00.

Original price was: $895.00.$15.00Current price is: $15.00.

Original price was: $997.00.$8.00Current price is: $8.00.

Forex Trading
Original price was: $550.00.$5.00Current price is: $5.00.

Original price was: $497.00.$11.00Current price is: $11.00.

Forex Trading
Original price was: $797.00.$10.00Current price is: $10.00.

Forex Trading
Original price was: $4,997.00.$27.00Current price is: $27.00.
Forex Trading
Quantamentals – The Next Great Forefront Of Trading and Investing with Trading Markets
Original price was: $1,495.00.$8.00Current price is: $8.00.

Original price was: $4,995.00.$15.00Current price is: $15.00.

Original price was: $799.00.$15.00Current price is: $15.00.

Forex Trading
Original price was: $2,995.00.$31.00Current price is: $31.00.

Forex Trading
Original price was: $999.00.$15.00Current price is: $15.00.

Forex Trading
Original price was: $239.00.$8.00Current price is: $8.00.

Forex Trading
Original price was: $499.00.$15.00Current price is: $15.00.

Original price was: $1,200.00.$23.00Current price is: $23.00.

Original price was: $450.00.$23.00Current price is: $23.00.

Forex Trading
Original price was: $1,098.00.$39.00Current price is: $39.00.

Reviews
There are no reviews yet.