-
×
 My Life as a Quant with Emanuel Derman
1 × $6.00
My Life as a Quant with Emanuel Derman
1 × $6.00 -
×
 Exploring MetaStock Advanced with Martin Pring
1 × $6.00
Exploring MetaStock Advanced with Martin Pring
1 × $6.00 -
×
 Elite Trader Package
1 × $31.00
Elite Trader Package
1 × $31.00 -
×
 Day Trading Insight with Al Brooks
1 × $10.00
Day Trading Insight with Al Brooks
1 × $10.00 -
×
 ePass Platinum
1 × $31.00
ePass Platinum
1 × $31.00 -
×
 Speculating with Futures and Traditional Commodities Part II (Liverpool Group) - Noble DraKoln
1 × $6.00
Speculating with Futures and Traditional Commodities Part II (Liverpool Group) - Noble DraKoln
1 × $6.00 -
×
 Master Strategies of Super Achievers By Steven Scott
1 × $23.00
Master Strategies of Super Achievers By Steven Scott
1 × $23.00 -
×
 Reverse Engineering Deals on Wall Street with Microsoft Excel with Keith Allman
1 × $6.00
Reverse Engineering Deals on Wall Street with Microsoft Excel with Keith Allman
1 × $6.00 -
×
 A Day In The Life Of A Forex Trader with Vic Noble & Shirley Hudson
1 × $23.00
A Day In The Life Of A Forex Trader with Vic Noble & Shirley Hudson
1 × $23.00 -
×
 Rule Based Price Action with Trader Divergent
1 × $5.00
Rule Based Price Action with Trader Divergent
1 × $5.00 -
×
 Scalp Strategy and Flipping Small Accounts with Opes Trading Group
1 × $5.00
Scalp Strategy and Flipping Small Accounts with Opes Trading Group
1 × $5.00 -
×
 The Crash of 1997 (Article) with Hans Hannula
1 × $6.00
The Crash of 1997 (Article) with Hans Hannula
1 × $6.00 -
×
 Money Attraction Bootcamp - Video + Audio + Workbook by Greg Habstritt
1 × $6.00
Money Attraction Bootcamp - Video + Audio + Workbook by Greg Habstritt
1 × $6.00 -
×
 The Complete Short Course on Ripple Cryptocurrency with Saad Hameed
1 × $5.00
The Complete Short Course on Ripple Cryptocurrency with Saad Hameed
1 × $5.00 -
×
 Investing with Exchange Traded Funds Made Easy with Marvin Appel
1 × $6.00
Investing with Exchange Traded Funds Made Easy with Marvin Appel
1 × $6.00 -
×
 Arjoio’s MMT - Essential Package
1 × $5.00
Arjoio’s MMT - Essential Package
1 × $5.00 -
×
 The Handbook of Risk with Ben Warwick
1 × $6.00
The Handbook of Risk with Ben Warwick
1 × $6.00 -
×
 Limitless Trading Academy with Lorenzo Corrado
1 × $10.00
Limitless Trading Academy with Lorenzo Corrado
1 × $10.00 -
×
 Four Dimensional Stock Market Structures & Cycles with Bradley Cowan
1 × $6.00
Four Dimensional Stock Market Structures & Cycles with Bradley Cowan
1 × $6.00 -
×
 Forex Trading Secrets. Trading Strategies for the Forex Market
1 × $6.00
Forex Trading Secrets. Trading Strategies for the Forex Market
1 × $6.00 -
×
 Profit.ly - Bitcoin Basics
1 × $6.00
Profit.ly - Bitcoin Basics
1 × $6.00 -
×
 Preview of Markets with George Bayer
1 × $6.00
Preview of Markets with George Bayer
1 × $6.00 -
×
 Momentum Signals Training Course with Fulcum Trader
1 × $5.00
Momentum Signals Training Course with Fulcum Trader
1 × $5.00 -
×
 THE BUNDLE (MAIN COURSE) with Daniel Savage - Forex Savages
1 × $6.00
THE BUNDLE (MAIN COURSE) with Daniel Savage - Forex Savages
1 × $6.00 -
×
 Evolve MasterClass with Irek Piekarski
1 × $13.00
Evolve MasterClass with Irek Piekarski
1 × $13.00 -
×
 The Best Option Trading Course with David Jaffee - Best Stock Strategy
1 × $15.00
The Best Option Trading Course with David Jaffee - Best Stock Strategy
1 × $15.00 -
×
 Perfect Publishing System Elite with Johnny Andrews
1 × $6.00
Perfect Publishing System Elite with Johnny Andrews
1 × $6.00 -
×
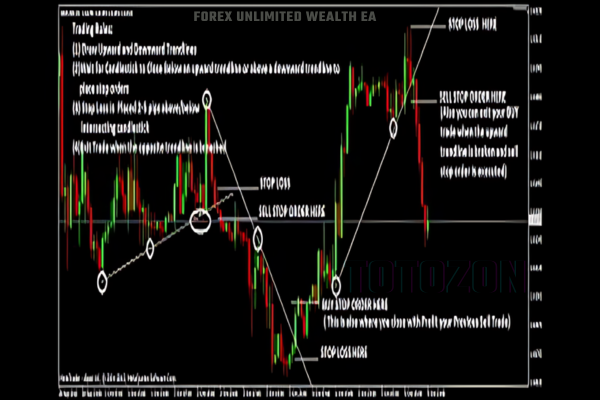 FOREX UNLIMITED WEALTH EA
1 × $6.00
FOREX UNLIMITED WEALTH EA
1 × $6.00 -
×
 Plunketts Investment & Securities Industry Almanac 2010 with Jack W.Plunkett
1 × $6.00
Plunketts Investment & Securities Industry Almanac 2010 with Jack W.Plunkett
1 × $6.00 -
×
 Sure-thing Options Trading: A Money-Making Guide to the New Listed Stock and Commodity Options Markets - George Angell
1 × $6.00
Sure-thing Options Trading: A Money-Making Guide to the New Listed Stock and Commodity Options Markets - George Angell
1 × $6.00 -
×
 My Trading Strategy with Evolved Traders
1 × $5.00
My Trading Strategy with Evolved Traders
1 × $5.00 -
×
 Trade Like Warren Buffett with James Altucher
1 × $6.00
Trade Like Warren Buffett with James Altucher
1 × $6.00 -
×
 Profit Power Seminar
1 × $23.00
Profit Power Seminar
1 × $23.00 -
×
 Swing Trading Futures & Commodities with the COT
1 × $93.00
Swing Trading Futures & Commodities with the COT
1 × $93.00 -
×
 Algo Trading Masterclass with Ali Casey - StatOasis
1 × $23.00
Algo Trading Masterclass with Ali Casey - StatOasis
1 × $23.00 -
×
 Day Trade Futures Online with Larry Williams
1 × $6.00
Day Trade Futures Online with Larry Williams
1 × $6.00 -
×
 The Better Butterfly Course with David Vallieres – Tradingology
1 × $39.00
The Better Butterfly Course with David Vallieres – Tradingology
1 × $39.00 -
×
 Futures & Options Course with Talkin Options
1 × $15.00
Futures & Options Course with Talkin Options
1 × $15.00 -
×
 Naked Trading Part 1 with Base Camp Trading
1 × $6.00
Naked Trading Part 1 with Base Camp Trading
1 × $6.00 -
×
 Practical Approach to Ninjatrader 8 Platform with Rajandran R
1 × $6.00
Practical Approach to Ninjatrader 8 Platform with Rajandran R
1 × $6.00 -
×
 Rounded Bottom Breakout Multimedia Course
1 × $31.00
Rounded Bottom Breakout Multimedia Course
1 × $31.00 -
×
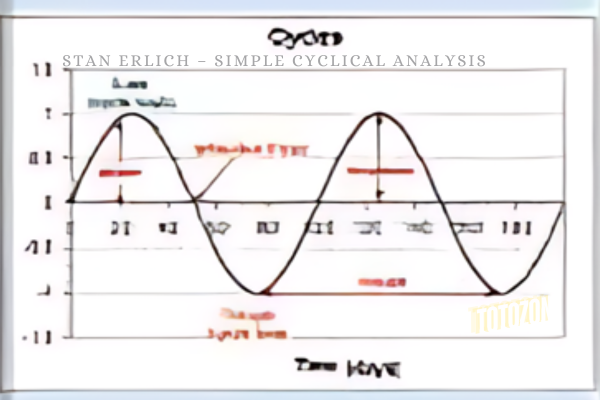 Simple Cyclical Analysis with Stan Erlich
1 × $6.00
Simple Cyclical Analysis with Stan Erlich
1 × $6.00 -
×
 The Astrology of the Old Testament or The Lost World Regained with Karl Anderson
1 × $6.00
The Astrology of the Old Testament or The Lost World Regained with Karl Anderson
1 × $6.00 -
×
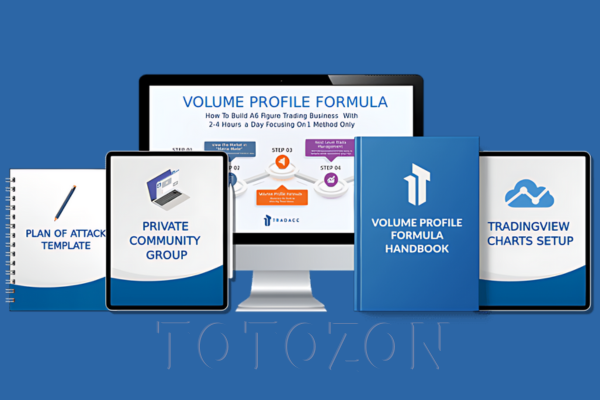 Volume Profile Formula with Aaron Korbs
1 × $5.00
Volume Profile Formula with Aaron Korbs
1 × $5.00 -
×
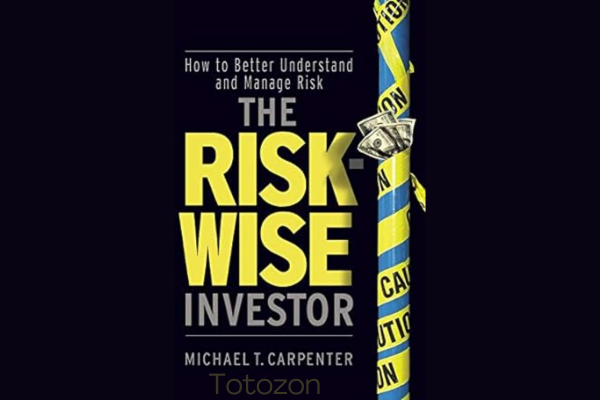 The Risk-Wise Investor: How to Better Understand and Manage Risk with Michael Carpenter
1 × $6.00
The Risk-Wise Investor: How to Better Understand and Manage Risk with Michael Carpenter
1 × $6.00 -
×
 Finding Astrocycles with an Ephemeris - Hans Hannula
1 × $6.00
Finding Astrocycles with an Ephemeris - Hans Hannula
1 × $6.00 -
×
 How To Build An Automated Trading Robot In Excel with Peter Titus - Marwood Research
1 × $15.00
How To Build An Automated Trading Robot In Excel with Peter Titus - Marwood Research
1 × $15.00 -
×
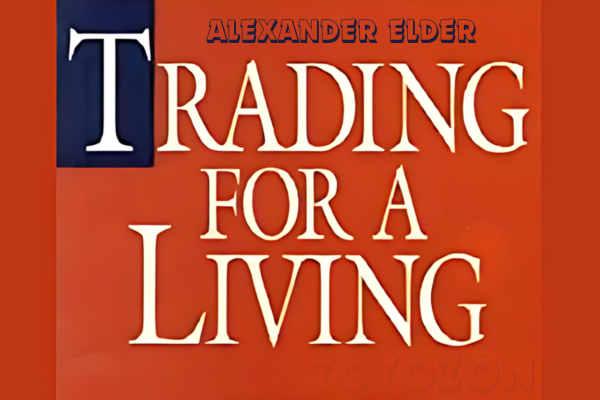 Trading for a Living with Alexander Elder
1 × $6.00
Trading for a Living with Alexander Elder
1 × $6.00 -
×
 Original Charting 1936 with W.D.Gann
1 × $6.00
Original Charting 1936 with W.D.Gann
1 × $6.00 -
×
 ICT – Inner Circle Trader 2020 Weekly Review
1 × $20.00
ICT – Inner Circle Trader 2020 Weekly Review
1 × $20.00 -
×
 How I've Achieved Triple-Digit Returns Daytrading: 4 Hours A Day with David Floyd
1 × $6.00
How I've Achieved Triple-Digit Returns Daytrading: 4 Hours A Day with David Floyd
1 × $6.00 -
×
 Master Trader - Advander Management Strategies
1 × $39.00
Master Trader - Advander Management Strategies
1 × $39.00 -
×
 D5 Render Course with Nuno Silva
1 × $27.00
D5 Render Course with Nuno Silva
1 × $27.00 -
×
 Technical Trading: System and Design Testing Class with Jeff Bierman
1 × $6.00
Technical Trading: System and Design Testing Class with Jeff Bierman
1 × $6.00 -
×
 Steidlmayer On Markets. A New Approach to Trading with J.Peter Steidlmayer
1 × $6.00
Steidlmayer On Markets. A New Approach to Trading with J.Peter Steidlmayer
1 × $6.00 -
×
 Profiting In Bull Or Bear Markets with George Dagnino
1 × $6.00
Profiting In Bull Or Bear Markets with George Dagnino
1 × $6.00 -
×
 Larry Williams Newsletters (1994-1997)
1 × $6.00
Larry Williams Newsletters (1994-1997)
1 × $6.00 -
×
 AstroFX Course
1 × $6.00
AstroFX Course
1 × $6.00 -
×
 Hedge Fund Market Wizards: How Winning Traders Win with Jack Schwager
1 × $6.00
Hedge Fund Market Wizards: How Winning Traders Win with Jack Schwager
1 × $6.00 -
×
 Mql4 Bundle: Basics, Scripts, Indicators, Experts with Jim Hodges
1 × $15.00
Mql4 Bundle: Basics, Scripts, Indicators, Experts with Jim Hodges
1 × $15.00 -
×
 Day Trading and Swing Trading Futures with Price Action by Humberto Malaspina
1 × $5.00
Day Trading and Swing Trading Futures with Price Action by Humberto Malaspina
1 × $5.00 -
×
 Optimize Funding Program with Solo Network
1 × $5.00
Optimize Funding Program with Solo Network
1 × $5.00 -
×
 Essentials Of Payroll Management & Accounting with Steven M.Bragg
1 × $6.00
Essentials Of Payroll Management & Accounting with Steven M.Bragg
1 × $6.00 -
×
 Ron Wagner – Creating a Profitable Trading & Investing Plan. 6 Key Components with Pristine
1 × $4.00
Ron Wagner – Creating a Profitable Trading & Investing Plan. 6 Key Components with Pristine
1 × $4.00 -
×
 Synthetic and Structured Assets: A Practical Guide to Investment and Risk with Erik Banks
1 × $6.00
Synthetic and Structured Assets: A Practical Guide to Investment and Risk with Erik Banks
1 × $6.00 -
×
 ICT Prodigy Trading Course – $650K in Payouts with Alex Solignani
1 × $15.00
ICT Prodigy Trading Course – $650K in Payouts with Alex Solignani
1 × $15.00

Investor’s Guide to Charting By Alistair Blair
$6.00
File Size: Cooming soon!
Delivery Time: 1–12 hours
Media Type: Online Course
Content Proof: Watch Here!
You may check content proof of “Investor’s Guide to Charting By Alistair Blair” below:

Investor’s Guide to Charting By Alistair Blair
Introduction
Welcome to the ultimate guide to charting for investors, based on the insights from Alistair Blair. This article aims to provide you with a comprehensive understanding of charting, its importance in investment strategies, and practical tips to enhance your trading skills.
What is Charting?
Charting involves analyzing historical price movements of securities through various types of charts to predict future price movements. It is a fundamental aspect of technical analysis, helping investors make informed decisions.
Why Charting is Essential for Investors
Understanding chart patterns can provide valuable insights into market trends and potential future movements. This can help investors identify entry and exit points, manage risks, and maximize returns.
Types of Charts in Technical Analysis
1. Line Charts
Line charts plot closing prices over a specific period, providing a clear view of the overall trend.
2. Bar Charts
Bar charts display the opening, high, low, and closing prices for each period, giving a more detailed view of price movements.
3. Candlestick Charts
Candlestick charts also show the open, high, low, and close prices but in a more visually appealing format. They are widely used for identifying market patterns.
Key Chart Patterns Every Investor Should Know
1. Head and Shoulders
A reversal pattern that signals a change in trend direction.
2. Double Top and Double Bottom
These patterns indicate potential trend reversals, with the double top suggesting a bearish reversal and the double bottom a bullish reversal.
3. Triangles
Triangles can be ascending, descending, or symmetrical, and they signify continuation or reversal patterns depending on the breakout direction.
Using Indicators in Charting
1. Moving Averages
Moving averages smooth out price data to identify trends. The two most common types are the simple moving average (SMA) and the exponential moving average (EMA).
2. Relative Strength Index (RSI)
RSI measures the speed and change of price movements, helping to identify overbought or oversold conditions.
3. Moving Average Convergence Divergence (MACD)
MACD is a trend-following momentum indicator that shows the relationship between two moving averages.
How to Read Chart Patterns
1. Identifying Trends
Look for higher highs and higher lows for uptrends, and lower highs and lower lows for downtrends.
2. Support and Resistance Levels
Support levels indicate where a price might stop falling, while resistance levels show where a price might stop rising.
3. Volume Analysis
Volume can confirm the strength of a price movement. Higher volume during a price move suggests stronger conviction.
Charting Tools and Software
1. MetaTrader
A popular platform offering a wide range of charting tools and indicators.
2. TradingView
Known for its user-friendly interface and extensive community-driven analysis.
3. Thinkorswim
Provided by TD Ameritrade, it offers professional-level charting capabilities.
Common Mistakes in Charting
1. Overcomplicating Analysis
Stick to a few key indicators and patterns to avoid analysis paralysis.
2. Ignoring Volume
Always consider volume to validate price movements and trends.
3. Not Adjusting for Different Time Frames
Analyze multiple time frames to get a comprehensive view of the market.
Developing a Charting Strategy
1. Define Your Goals
Determine your investment goals and risk tolerance.
2. Backtesting
Test your strategy using historical data to ensure its effectiveness.
3. Stay Updated
Keep learning and adapting to new market conditions and charting techniques.
The Benefits of Using Alistair Blair’s Approach
Alistair Blair’s methodologies emphasize simplicity, clarity, and practical application. By focusing on essential patterns and indicators, investors can make more informed decisions without getting overwhelmed.
Conclusion
Charting is a powerful tool that, when used correctly, can significantly enhance your investment strategy. By following Alistair Blair’s guide, you can develop a robust understanding of charting, identify key patterns, and make informed trading decisions.

Frequently Asked Questions
1. What is the most important chart for beginners to start with?
For beginners, line charts are the easiest to understand and provide a good starting point for identifying trends.
2. How often should I analyze charts?
Regular analysis, such as daily or weekly reviews, can help you stay updated with market trends and make timely decisions.
3. Can charting predict market crashes?
While charting can indicate potential reversals and trends, it cannot predict market crashes with certainty.
4. What is the best charting software for beginners?
TradingView is highly recommended for beginners due to its user-friendly interface and extensive educational resources.
5. How do I combine multiple indicators in my analysis?
Start with a few key indicators, like moving averages and RSI, and gradually incorporate more as you become comfortable with your analysis.
Be the first to review “Investor’s Guide to Charting By Alistair Blair”
You must be logged in to post a review.
Related products

Forex Trading
Original price was: $500.00.$5.00Current price is: $5.00.

Forex Trading
Original price was: $550.00.$5.00Current price is: $5.00.

Forex Trading
Original price was: $499.00.$15.00Current price is: $15.00.

Forex Trading
Original price was: $999.00.$15.00Current price is: $15.00.

Forex Trading
Original price was: $797.00.$10.00Current price is: $10.00.

Forex Trading
Original price was: $1,098.00.$39.00Current price is: $39.00.
Forex Trading
Original price was: $1,898.00.$10.00Current price is: $10.00.

Forex Trading
Original price was: $799.00.$15.00Current price is: $15.00.

Original price was: $799.00.$15.00Current price is: $15.00.

Forex Trading
Original price was: $125.00.$17.00Current price is: $17.00.

Forex Trading
Original price was: $2,995.00.$31.00Current price is: $31.00.

Original price was: $895.00.$15.00Current price is: $15.00.

Forex Trading
Original price was: $397.00.$31.00Current price is: $31.00.

Original price was: $310.00.$23.00Current price is: $23.00.

Original price was: $497.00.$31.00Current price is: $31.00.

Forex Trading
Quantamentals – The Next Great Forefront Of Trading and Investing with Trading Markets
Original price was: $1,495.00.$8.00Current price is: $8.00.
Forex Trading
Original price was: $2,000.00.$23.00Current price is: $23.00.

Forex Trading
Original price was: $697.00.$5.00Current price is: $5.00.

Forex Trading
The Complete Guide to Multiple Time Frame Analysis & Reading Price Action with Aiman Almansoori
Original price was: $1,399.00.$13.00Current price is: $13.00.

Forex Trading
Original price was: $4,997.00.$27.00Current price is: $27.00.

Reviews
There are no reviews yet.