-
×
 Better Trading with the Guppy Multiple Moving Average by Daryl Guppy
1 × $6.00
Better Trading with the Guppy Multiple Moving Average by Daryl Guppy
1 × $6.00 -
×
 The Orderflow Masterclass with PrimeTrading
1 × $17.00
The Orderflow Masterclass with PrimeTrading
1 × $17.00 -
×
 Supply and Demand Video Course with JamesFXS
1 × $13.00
Supply and Demand Video Course with JamesFXS
1 × $13.00 -
×
 Secrets of An Electronic Futures Trader with Larry Levin
1 × $6.00
Secrets of An Electronic Futures Trader with Larry Levin
1 × $6.00 -
×
 White Phoenix’s The Smart (Money) Approach to Trading with Jayson Casper
1 × $39.00
White Phoenix’s The Smart (Money) Approach to Trading with Jayson Casper
1 × $39.00 -
×
 How To Read The Market Professionally with TradeSmart
1 × $27.00
How To Read The Market Professionally with TradeSmart
1 × $27.00 -
×
 Common Sense Commodities with David Duty
1 × $6.00
Common Sense Commodities with David Duty
1 × $6.00 -
×
 Cryptocurrency Investing Master Class with Stone River eLearning
1 × $6.00
Cryptocurrency Investing Master Class with Stone River eLearning
1 × $6.00 -
×
 $20 – 52k 20 pips a day challange with Rafał Zuchowicz - TopMasterTrader
1 × $5.00
$20 – 52k 20 pips a day challange with Rafał Zuchowicz - TopMasterTrader
1 × $5.00 -
×
 Butterfly and Condor Workshop with Aeromir
1 × $15.00
Butterfly and Condor Workshop with Aeromir
1 × $15.00 -
×
 Power Cycle Trading The Ultimate Option Guide: When & How to Use Which Option Strategy For the Best Results - Powercycletrading
1 × $69.00
Power Cycle Trading The Ultimate Option Guide: When & How to Use Which Option Strategy For the Best Results - Powercycletrading
1 × $69.00 -
×
 Trading Full Circle the Complete Underground Trader System for Timing with Jea Yu
1 × $6.00
Trading Full Circle the Complete Underground Trader System for Timing with Jea Yu
1 × $6.00 -
×
 Master NFTs in 7 Days with Ben Yu
1 × $23.00
Master NFTs in 7 Days with Ben Yu
1 × $23.00 -
×
 Simple Cyclical Analysis with Stan Erlich
1 × $6.00
Simple Cyclical Analysis with Stan Erlich
1 × $6.00 -
×
 Precision Timing Your Options Trades Using Fibonacci with Trading Analysis
1 × $15.00
Precision Timing Your Options Trades Using Fibonacci with Trading Analysis
1 × $15.00 -
×
 Detecting Trend Direction & Strength (Article) with Barbara Star
1 × $6.00
Detecting Trend Direction & Strength (Article) with Barbara Star
1 × $6.00 -
×
 War Room Psychology Vol. 2 with Pat Mitchell – Trick Trades
1 × $23.00
War Room Psychology Vol. 2 with Pat Mitchell – Trick Trades
1 × $23.00 -
×
 Keynes & The Market with Justyn Walsh
1 × $6.00
Keynes & The Market with Justyn Walsh
1 × $6.00 -
×
 Trading Analysis Crash Course
1 × $23.00
Trading Analysis Crash Course
1 × $23.00 -
×
 Predicting Market Trends with Alan S.Farley
1 × $6.00
Predicting Market Trends with Alan S.Farley
1 × $6.00 -
×
 Ultimate Gann Trading
1 × $15.00
Ultimate Gann Trading
1 × $15.00 -
×
 Coulda, woulda, shoulda with Charles Cottle
1 × $6.00
Coulda, woulda, shoulda with Charles Cottle
1 × $6.00 -
×
 NetPicks - Universal Market Trader Course
1 × $6.00
NetPicks - Universal Market Trader Course
1 × $6.00 -
×
 Advanced Trader with Nikos Trading Academy
1 × $5.00
Advanced Trader with Nikos Trading Academy
1 × $5.00 -
×
 Quantitative Trading: How to Build Your Own Algorithmic Trading Business (1st Edition) with Ernest Chan
1 × $6.00
Quantitative Trading: How to Build Your Own Algorithmic Trading Business (1st Edition) with Ernest Chan
1 × $6.00 -
×
 The HV7 Option Trading System with Amy Meissner – Aeromir
1 × $8.00
The HV7 Option Trading System with Amy Meissner – Aeromir
1 × $8.00 -
×
 Compass Trading System with Right Line Trading
1 × $39.00
Compass Trading System with Right Line Trading
1 × $39.00 -
×
 The STRAT Execution Basics with Jermaine McGruder
1 × $31.00
The STRAT Execution Basics with Jermaine McGruder
1 × $31.00 -
×
 E-Bonds: An Introduction to the Online Bond Market with Jake Wengroff
1 × $6.00
E-Bonds: An Introduction to the Online Bond Market with Jake Wengroff
1 × $6.00 -
×
 The M21 Strategy
1 × $15.00
The M21 Strategy
1 × $15.00 -
×
 The Orderflows Trade Opportunities Encyclopedia with Michael Valtos
1 × $8.00
The Orderflows Trade Opportunities Encyclopedia with Michael Valtos
1 × $8.00 -
×
 Stock Trader`s Almanac 2012 with Jeffrey Hirsch & Yale Hirsch
1 × $6.00
Stock Trader`s Almanac 2012 with Jeffrey Hirsch & Yale Hirsch
1 × $6.00 -
×
 Beat The Binaries
1 × $15.00
Beat The Binaries
1 × $15.00 -
×
 Basecamptrading - How to Become a More Consistent Trader
1 × $15.00
Basecamptrading - How to Become a More Consistent Trader
1 × $15.00 -
×
 Limitless Trading Academy with Lorenzo Corrado
1 × $10.00
Limitless Trading Academy with Lorenzo Corrado
1 × $10.00 -
×
 How To Win 97% Of Your Options Trader with Jeff Tompkins
1 × $6.00
How To Win 97% Of Your Options Trader with Jeff Tompkins
1 × $6.00 -
×
 OPTIONS FOR BEGINNERS
1 × $6.00
OPTIONS FOR BEGINNERS
1 × $6.00 -
×
 CFA Level 1,2,3 - Study Guides 2006
1 × $6.00
CFA Level 1,2,3 - Study Guides 2006
1 × $6.00 -
×
 The Stock Market, Credit & Capital Formation with Fritz Machlup
1 × $6.00
The Stock Market, Credit & Capital Formation with Fritz Machlup
1 × $6.00 -
×
 Donald Delves – Stock Options and the New Rules of Corporate Accountability
1 × $6.00
Donald Delves – Stock Options and the New Rules of Corporate Accountability
1 × $6.00 -
×
 The Bond Book (2nd Ed.) with Annette Thau
1 × $6.00
The Bond Book (2nd Ed.) with Annette Thau
1 × $6.00 -
×
 The Binary Trigger (Video, Books) with John Piper
1 × $6.00
The Binary Trigger (Video, Books) with John Piper
1 × $6.00 -
×
 SQX Mentorship with Tip Toe Hippo
1 × $23.00
SQX Mentorship with Tip Toe Hippo
1 × $23.00 -
×
 A Complete Guide to the Futures Markets: Fundamental Analysis, Technical Analysis, Trading, Spreads, and Options (1st Edition) - Jack Schwager
1 × $6.00
A Complete Guide to the Futures Markets: Fundamental Analysis, Technical Analysis, Trading, Spreads, and Options (1st Edition) - Jack Schwager
1 × $6.00 -
×
 Commitments of Traders : Strategies for Tracking the Market and Trading Profitably with Floyd Upperman
1 × $6.00
Commitments of Traders : Strategies for Tracking the Market and Trading Profitably with Floyd Upperman
1 × $6.00 -
×
 Unsorted Articles about the Psychology of Trading with Brett N.Steenbarger
1 × $6.00
Unsorted Articles about the Psychology of Trading with Brett N.Steenbarger
1 × $6.00 -
×
 Superleverage The Only Sensible Way to Speculate with Steve Sarnoff
1 × $6.00
Superleverage The Only Sensible Way to Speculate with Steve Sarnoff
1 × $6.00 -
×
 Quantamentals - The Next Great Forefront Of Trading and Investing with Trading Markets
1 × $8.00
Quantamentals - The Next Great Forefront Of Trading and Investing with Trading Markets
1 × $8.00 -
×
 Investment Madness with John Nofsinger
1 × $6.00
Investment Madness with John Nofsinger
1 × $6.00 -
×
 Profiletraders - Market Profile Day Trading
1 × $15.00
Profiletraders - Market Profile Day Trading
1 × $15.00 -
×
 The Nature of Risk with Justin Mamis
1 × $6.00
The Nature of Risk with Justin Mamis
1 × $6.00 -
×
 The Cycles and The Codes with Myles Wilson-Walker
1 × $15.00
The Cycles and The Codes with Myles Wilson-Walker
1 × $15.00 -
×
 The MissionFX Compounding Course with Nick Shawn
1 × $5.00
The MissionFX Compounding Course with Nick Shawn
1 × $5.00 -
×
 Forecast 2024 Clarification with Larry Williams
1 × $15.00
Forecast 2024 Clarification with Larry Williams
1 × $15.00 -
×
 The New Science of Asset Allocation with Thomas Schneeweis
1 × $6.00
The New Science of Asset Allocation with Thomas Schneeweis
1 × $6.00 -
×
 Advanced Trading System - How To 10x Your Trading Skillsets & Results with The Trade Academy
1 × $6.00
Advanced Trading System - How To 10x Your Trading Skillsets & Results with The Trade Academy
1 × $6.00 -
×
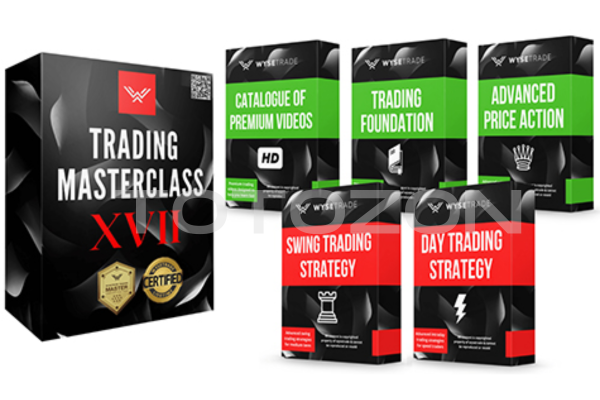 Trading Masterclass XVII with Wysetrade
1 × $6.00
Trading Masterclass XVII with Wysetrade
1 × $6.00 -
×
 Neowave. Inovations that Make Elliott Wave Work Better for You with Glenn Neely
1 × $6.00
Neowave. Inovations that Make Elliott Wave Work Better for You with Glenn Neely
1 × $6.00 -
×
 Quality FX Academy
1 × $5.00
Quality FX Academy
1 × $5.00 -
×
 Trading Freak Academy (Full Course) with JP - Trading Freak
1 × $5.00
Trading Freak Academy (Full Course) with JP - Trading Freak
1 × $5.00 -
×
 Trading with MORE Special Set-ups - Recorded Webinar
1 × $15.00
Trading with MORE Special Set-ups - Recorded Webinar
1 × $15.00 -
×
 NASDAQ Level II Trading Strategies
1 × $6.00
NASDAQ Level II Trading Strategies
1 × $6.00 -
×
 How to Trade a Vertical Market
1 × $93.00
How to Trade a Vertical Market
1 × $93.00 -
×
 ICT Prodigy Trading Course – $650K in Payouts with Alex Solignani
1 × $15.00
ICT Prodigy Trading Course – $650K in Payouts with Alex Solignani
1 × $15.00

Investor’s Guide to Charting By Alistair Blair
$6.00
File Size: Cooming soon!
Delivery Time: 1–12 hours
Media Type: Online Course
Content Proof: Watch Here!
You may check content proof of “Investor’s Guide to Charting By Alistair Blair” below:

Investor’s Guide to Charting By Alistair Blair
Introduction
Welcome to the ultimate guide to charting for investors, based on the insights from Alistair Blair. This article aims to provide you with a comprehensive understanding of charting, its importance in investment strategies, and practical tips to enhance your trading skills.
What is Charting?
Charting involves analyzing historical price movements of securities through various types of charts to predict future price movements. It is a fundamental aspect of technical analysis, helping investors make informed decisions.
Why Charting is Essential for Investors
Understanding chart patterns can provide valuable insights into market trends and potential future movements. This can help investors identify entry and exit points, manage risks, and maximize returns.
Types of Charts in Technical Analysis
1. Line Charts
Line charts plot closing prices over a specific period, providing a clear view of the overall trend.
2. Bar Charts
Bar charts display the opening, high, low, and closing prices for each period, giving a more detailed view of price movements.
3. Candlestick Charts
Candlestick charts also show the open, high, low, and close prices but in a more visually appealing format. They are widely used for identifying market patterns.
Key Chart Patterns Every Investor Should Know
1. Head and Shoulders
A reversal pattern that signals a change in trend direction.
2. Double Top and Double Bottom
These patterns indicate potential trend reversals, with the double top suggesting a bearish reversal and the double bottom a bullish reversal.
3. Triangles
Triangles can be ascending, descending, or symmetrical, and they signify continuation or reversal patterns depending on the breakout direction.
Using Indicators in Charting
1. Moving Averages
Moving averages smooth out price data to identify trends. The two most common types are the simple moving average (SMA) and the exponential moving average (EMA).
2. Relative Strength Index (RSI)
RSI measures the speed and change of price movements, helping to identify overbought or oversold conditions.
3. Moving Average Convergence Divergence (MACD)
MACD is a trend-following momentum indicator that shows the relationship between two moving averages.
How to Read Chart Patterns
1. Identifying Trends
Look for higher highs and higher lows for uptrends, and lower highs and lower lows for downtrends.
2. Support and Resistance Levels
Support levels indicate where a price might stop falling, while resistance levels show where a price might stop rising.
3. Volume Analysis
Volume can confirm the strength of a price movement. Higher volume during a price move suggests stronger conviction.
Charting Tools and Software
1. MetaTrader
A popular platform offering a wide range of charting tools and indicators.
2. TradingView
Known for its user-friendly interface and extensive community-driven analysis.
3. Thinkorswim
Provided by TD Ameritrade, it offers professional-level charting capabilities.
Common Mistakes in Charting
1. Overcomplicating Analysis
Stick to a few key indicators and patterns to avoid analysis paralysis.
2. Ignoring Volume
Always consider volume to validate price movements and trends.
3. Not Adjusting for Different Time Frames
Analyze multiple time frames to get a comprehensive view of the market.
Developing a Charting Strategy
1. Define Your Goals
Determine your investment goals and risk tolerance.
2. Backtesting
Test your strategy using historical data to ensure its effectiveness.
3. Stay Updated
Keep learning and adapting to new market conditions and charting techniques.
The Benefits of Using Alistair Blair’s Approach
Alistair Blair’s methodologies emphasize simplicity, clarity, and practical application. By focusing on essential patterns and indicators, investors can make more informed decisions without getting overwhelmed.
Conclusion
Charting is a powerful tool that, when used correctly, can significantly enhance your investment strategy. By following Alistair Blair’s guide, you can develop a robust understanding of charting, identify key patterns, and make informed trading decisions.

Frequently Asked Questions
1. What is the most important chart for beginners to start with?
For beginners, line charts are the easiest to understand and provide a good starting point for identifying trends.
2. How often should I analyze charts?
Regular analysis, such as daily or weekly reviews, can help you stay updated with market trends and make timely decisions.
3. Can charting predict market crashes?
While charting can indicate potential reversals and trends, it cannot predict market crashes with certainty.
4. What is the best charting software for beginners?
TradingView is highly recommended for beginners due to its user-friendly interface and extensive educational resources.
5. How do I combine multiple indicators in my analysis?
Start with a few key indicators, like moving averages and RSI, and gradually incorporate more as you become comfortable with your analysis.
Be the first to review “Investor’s Guide to Charting By Alistair Blair”
You must be logged in to post a review.
Related products

Original price was: $310.00.$23.00Current price is: $23.00.

Original price was: $450.00.$23.00Current price is: $23.00.

Original price was: $649.00.$20.00Current price is: $20.00.

Original price was: $997.00.$8.00Current price is: $8.00.
Original price was: $700.00.$39.00Current price is: $39.00.

Original price was: $1,200.00.$23.00Current price is: $23.00.

Original price was: $695.00.$41.00Current price is: $41.00.

Original price was: $139.00.$23.00Current price is: $23.00.
Forex Trading
Original price was: $4,997.00.$27.00Current price is: $27.00.

Forex Trading
Original price was: $499.00.$15.00Current price is: $15.00.
Original price was: $197.00.$5.00Current price is: $5.00.

Original price was: $997.00.$13.00Current price is: $13.00.
Original price was: $2,120.00.$15.00Current price is: $15.00.

Forex Trading
Original price was: $2,000.00.$23.00Current price is: $23.00.

Forex Trading
Original price was: $550.00.$5.00Current price is: $5.00.
Forex Trading
Original price was: $2,997.00.$23.00Current price is: $23.00.

Forex Trading
Original price was: $2,995.00.$31.00Current price is: $31.00.
Forex Trading
Original price was: $1,898.00.$10.00Current price is: $10.00.
Original price was: $299.00.$8.00Current price is: $8.00.

Forex Trading
Original price was: $797.00.$10.00Current price is: $10.00.

Reviews
There are no reviews yet.