-
×
 D.A.T.E. Unlock Your Trading DNA Worskshop with Geoff Bysshe
1 × $6.00
D.A.T.E. Unlock Your Trading DNA Worskshop with Geoff Bysshe
1 × $6.00 -
×
 Rounded Bottom Breakout Multimedia Course
1 × $31.00
Rounded Bottom Breakout Multimedia Course
1 × $31.00 -
×
 Elliott Wave International Educational Series Volumes 1 - 10 with Robert Prechter, Dave Allman & Wayne Gorman
1 × $54.00
Elliott Wave International Educational Series Volumes 1 - 10 with Robert Prechter, Dave Allman & Wayne Gorman
1 × $54.00 -
×
 The Mathematics of Money Management. Risk Analysis Techniques for Traders
1 × $6.00
The Mathematics of Money Management. Risk Analysis Techniques for Traders
1 × $6.00 -
×
 FTMO Academy Course
1 × $5.00
FTMO Academy Course
1 × $5.00 -
×
 0 DTE Options Trading Workshop with Aeromir Corporation
1 × $15.00
0 DTE Options Trading Workshop with Aeromir Corporation
1 × $15.00 -
×
 Basic of Market Astrophisics with Hans Hannula
1 × $6.00
Basic of Market Astrophisics with Hans Hannula
1 × $6.00 -
×
 High Probability Trading Using Elliott Wave And Fibonacci Analysis withVic Patel - Forex Training Group
1 × $10.00
High Probability Trading Using Elliott Wave And Fibonacci Analysis withVic Patel - Forex Training Group
1 × $10.00 -
×
 How to Create & Manage a Mutal Fund or ETF with Melinda Gerber
1 × $6.00
How to Create & Manage a Mutal Fund or ETF with Melinda Gerber
1 × $6.00 -
×
 Professional Chart Reading Bootcamp - 2 CDs
1 × $6.00
Professional Chart Reading Bootcamp - 2 CDs
1 × $6.00 -
×
 Dynamic Gann Levels with Don Fisher
1 × $6.00
Dynamic Gann Levels with Don Fisher
1 × $6.00 -
×
 Virtual Intensive Trader Training
1 × $31.00
Virtual Intensive Trader Training
1 × $31.00 -
×
 Hedges on Hedge Funds: How to Successfully Analyze and Select an Investment with James Hedges
1 × $6.00
Hedges on Hedge Funds: How to Successfully Analyze and Select an Investment with James Hedges
1 × $6.00 -
×
 Fractal Markets SFX with Tyson Bieniek
1 × $5.00
Fractal Markets SFX with Tyson Bieniek
1 × $5.00 -
×
 Investing In Fixer-Uppers 2003 with Jay DeCima
1 × $6.00
Investing In Fixer-Uppers 2003 with Jay DeCima
1 × $6.00 -
×
 Advanced Trading System - How To 10x Your Trading Skillsets & Results with The Trade Academy
1 × $6.00
Advanced Trading System - How To 10x Your Trading Skillsets & Results with The Trade Academy
1 × $6.00 -
×
 Short Skirt Trading, the Most Bang for the Buck with Linda Raschke
1 × $6.00
Short Skirt Trading, the Most Bang for the Buck with Linda Raschke
1 × $6.00 -
×
 Change Happens. Do You Profit Or Does Someone Else (Traders Expo Las Vegas Dec 2005) by Tobin Smith
1 × $6.00
Change Happens. Do You Profit Or Does Someone Else (Traders Expo Las Vegas Dec 2005) by Tobin Smith
1 × $6.00 -
×
 Forex Trading using Intermarket Analysis with Louis Mendelsohn
1 × $6.00
Forex Trading using Intermarket Analysis with Louis Mendelsohn
1 × $6.00 -
×
 The Dark Side Of Valuation with Aswath Damodaran
1 × $6.00
The Dark Side Of Valuation with Aswath Damodaran
1 × $6.00 -
×
 Plunketts Investment & Securities Industry Almanac 2010 with Jack W.Plunkett
1 × $6.00
Plunketts Investment & Securities Industry Almanac 2010 with Jack W.Plunkett
1 × $6.00 -
×
 Quantamentals - The Next Great Forefront Of Trading and Investing with Trading Markets
1 × $8.00
Quantamentals - The Next Great Forefront Of Trading and Investing with Trading Markets
1 × $8.00 -
×
 The Art And Science Of Trading with Adam Grimes
1 × $6.00
The Art And Science Of Trading with Adam Grimes
1 × $6.00 -
×
 A Comparison of Popular Trading Systems (2nd Ed.) with Lars Kestner
1 × $6.00
A Comparison of Popular Trading Systems (2nd Ed.) with Lars Kestner
1 × $6.00 -
×
 The Insider's Guide to 52 Homes in 52 Weeks: Acquire Your Real Estate Fortune Today with Dolf De Roos
1 × $6.00
The Insider's Guide to 52 Homes in 52 Weeks: Acquire Your Real Estate Fortune Today with Dolf De Roos
1 × $6.00 -
×
 China & the World Trading System with Deborah Cass, Brett Williams & George Barker
1 × $6.00
China & the World Trading System with Deborah Cass, Brett Williams & George Barker
1 × $6.00 -
×
 RROP Course 2023
1 × $5.00
RROP Course 2023
1 × $5.00 -
×
 Advanced Group Analysis Turorial with David Vomund
1 × $6.00
Advanced Group Analysis Turorial with David Vomund
1 × $6.00 -
×
 The Orderflows Trade Opportunities Encyclopedia with Michael Valtos
1 × $8.00
The Orderflows Trade Opportunities Encyclopedia with Michael Valtos
1 × $8.00 -
×
 AbleTrend with John Wang & Grace Wang
1 × $6.00
AbleTrend with John Wang & Grace Wang
1 × $6.00 -
×
 Precise Exits & Entries with Charles LeBeau
1 × $6.00
Precise Exits & Entries with Charles LeBeau
1 × $6.00 -
×
 Candlestick and Pivot Point Trading Triggers with John Person
1 × $6.00
Candlestick and Pivot Point Trading Triggers with John Person
1 × $6.00 -
×
 Complete Day Trading Course with The Trading Floor
1 × $13.00
Complete Day Trading Course with The Trading Floor
1 × $13.00 -
×
 Dan Sheridan Butterfly Course + Iron Condor Class Bundle Pack
1 × $23.00
Dan Sheridan Butterfly Course + Iron Condor Class Bundle Pack
1 × $23.00 -
×
 Forecast 2024 Clarification with Larry Williams
1 × $15.00
Forecast 2024 Clarification with Larry Williams
1 × $15.00 -
×
 Trade from Anywhere
1 × $6.00
Trade from Anywhere
1 × $6.00 -
×
 Profits in the Stock Market with Harold Gartley
1 × $6.00
Profits in the Stock Market with Harold Gartley
1 × $6.00 -
×
 Essentials in Quantitative Trading QT01 By HangukQuant's
1 × $23.00
Essentials in Quantitative Trading QT01 By HangukQuant's
1 × $23.00 -
×
 The Trading Blueprint with Brad Goh - The Trading Geek
1 × $5.00
The Trading Blueprint with Brad Goh - The Trading Geek
1 × $5.00 -
×
 Practical Applications of Candlestick Charts with Gary Wagner
1 × $6.00
Practical Applications of Candlestick Charts with Gary Wagner
1 × $6.00 -
×
 Compass Trading System with Right Line Trading
1 × $39.00
Compass Trading System with Right Line Trading
1 × $39.00 -
×
 Mastertrader – Mastering Swing Trading
1 × $31.00
Mastertrader – Mastering Swing Trading
1 × $31.00 -
×
 Home Run Options Trading Course with Dave Aquino - Base Camp Trading
1 × $11.00
Home Run Options Trading Course with Dave Aquino - Base Camp Trading
1 × $11.00 -
×
 The Stock Market Mastery Program with Ryan Hildreth
1 × $12.00
The Stock Market Mastery Program with Ryan Hildreth
1 × $12.00 -
×
 The Indices Orderflow Masterclass with The Forex Scalpers
1 × $23.00
The Indices Orderflow Masterclass with The Forex Scalpers
1 × $23.00 -
×
 Starting Out in Futures Trading with Mark Powers
1 × $6.00
Starting Out in Futures Trading with Mark Powers
1 × $6.00 -
×
 Bond Market Course with The Macro Compass
1 × $15.00
Bond Market Course with The Macro Compass
1 × $15.00 -
×
 Weekly Diagonal Spreads for Consistent Income By Doc Severson
1 × $6.00
Weekly Diagonal Spreads for Consistent Income By Doc Severson
1 × $6.00 -
×
 Follow the Leader Trading System with Anthony Gibson
1 × $6.00
Follow the Leader Trading System with Anthony Gibson
1 × $6.00 -
×
 Flipping Markets Video Course (2022)
1 × $5.00
Flipping Markets Video Course (2022)
1 × $5.00 -
×
 Candlesticks Trading Course
1 × $31.00
Candlesticks Trading Course
1 × $31.00 -
×
 Gann’s Scientific Methods Unveiled (Vol I, II)
1 × $6.00
Gann’s Scientific Methods Unveiled (Vol I, II)
1 × $6.00 -
×
 Trading Short TermSame Day Trades Sep 2023 with Dan Sheridan & Mark Fenton - Sheridan Options Mentoring
1 × $31.00
Trading Short TermSame Day Trades Sep 2023 with Dan Sheridan & Mark Fenton - Sheridan Options Mentoring
1 × $31.00 -
×
 Derivates Demystified
1 × $6.00
Derivates Demystified
1 × $6.00 -
×
 Stock Market Investing Mastery with Jeremy
1 × $39.00
Stock Market Investing Mastery with Jeremy
1 × $39.00 -
×
 How to Analyze Multifamily Investment Opportunities with Symon He & Brandon Young
1 × $6.00
How to Analyze Multifamily Investment Opportunities with Symon He & Brandon Young
1 × $6.00

Investor’s Guide to Charting By Alistair Blair
$6.00
File Size: Cooming soon!
Delivery Time: 1–12 hours
Media Type: Online Course
Content Proof: Watch Here!
You may check content proof of “Investor’s Guide to Charting By Alistair Blair” below:

Investor’s Guide to Charting By Alistair Blair
Introduction
Welcome to the ultimate guide to charting for investors, based on the insights from Alistair Blair. This article aims to provide you with a comprehensive understanding of charting, its importance in investment strategies, and practical tips to enhance your trading skills.
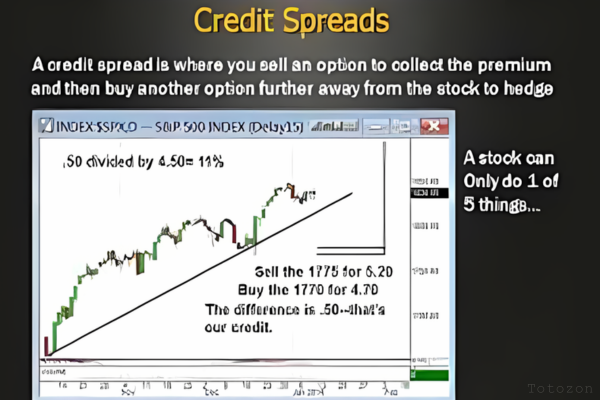
What is Charting?
Charting involves analyzing historical price movements of securities through various types of charts to predict future price movements. It is a fundamental aspect of technical analysis, helping investors make informed decisions.
Why Charting is Essential for Investors
Understanding chart patterns can provide valuable insights into market trends and potential future movements. This can help investors identify entry and exit points, manage risks, and maximize returns.
Types of Charts in Technical Analysis
1. Line Charts
Line charts plot closing prices over a specific period, providing a clear view of the overall trend.
2. Bar Charts
Bar charts display the opening, high, low, and closing prices for each period, giving a more detailed view of price movements.
3. Candlestick Charts
Candlestick charts also show the open, high, low, and close prices but in a more visually appealing format. They are widely used for identifying market patterns.
Key Chart Patterns Every Investor Should Know
1. Head and Shoulders
A reversal pattern that signals a change in trend direction.
2. Double Top and Double Bottom
These patterns indicate potential trend reversals, with the double top suggesting a bearish reversal and the double bottom a bullish reversal.
3. Triangles
Triangles can be ascending, descending, or symmetrical, and they signify continuation or reversal patterns depending on the breakout direction.
Using Indicators in Charting
1. Moving Averages
Moving averages smooth out price data to identify trends. The two most common types are the simple moving average (SMA) and the exponential moving average (EMA).
2. Relative Strength Index (RSI)
RSI measures the speed and change of price movements, helping to identify overbought or oversold conditions.
3. Moving Average Convergence Divergence (MACD)
MACD is a trend-following momentum indicator that shows the relationship between two moving averages.
How to Read Chart Patterns
1. Identifying Trends
Look for higher highs and higher lows for uptrends, and lower highs and lower lows for downtrends.
2. Support and Resistance Levels
Support levels indicate where a price might stop falling, while resistance levels show where a price might stop rising.
3. Volume Analysis
Volume can confirm the strength of a price movement. Higher volume during a price move suggests stronger conviction.
Charting Tools and Software
1. MetaTrader
A popular platform offering a wide range of charting tools and indicators.
2. TradingView
Known for its user-friendly interface and extensive community-driven analysis.
3. Thinkorswim
Provided by TD Ameritrade, it offers professional-level charting capabilities.
Common Mistakes in Charting
1. Overcomplicating Analysis
Stick to a few key indicators and patterns to avoid analysis paralysis.
2. Ignoring Volume
Always consider volume to validate price movements and trends.
3. Not Adjusting for Different Time Frames
Analyze multiple time frames to get a comprehensive view of the market.
Developing a Charting Strategy
1. Define Your Goals
Determine your investment goals and risk tolerance.
2. Backtesting
Test your strategy using historical data to ensure its effectiveness.
3. Stay Updated
Keep learning and adapting to new market conditions and charting techniques.
The Benefits of Using Alistair Blair’s Approach
Alistair Blair’s methodologies emphasize simplicity, clarity, and practical application. By focusing on essential patterns and indicators, investors can make more informed decisions without getting overwhelmed.
Conclusion
Charting is a powerful tool that, when used correctly, can significantly enhance your investment strategy. By following Alistair Blair’s guide, you can develop a robust understanding of charting, identify key patterns, and make informed trading decisions.

Frequently Asked Questions
1. What is the most important chart for beginners to start with?
For beginners, line charts are the easiest to understand and provide a good starting point for identifying trends.
2. How often should I analyze charts?
Regular analysis, such as daily or weekly reviews, can help you stay updated with market trends and make timely decisions.
3. Can charting predict market crashes?
While charting can indicate potential reversals and trends, it cannot predict market crashes with certainty.
4. What is the best charting software for beginners?
TradingView is highly recommended for beginners due to its user-friendly interface and extensive educational resources.
5. How do I combine multiple indicators in my analysis?
Start with a few key indicators, like moving averages and RSI, and gradually incorporate more as you become comfortable with your analysis.
Be the first to review “Investor’s Guide to Charting By Alistair Blair”
You must be logged in to post a review.
Related products

Original price was: $997.00.$8.00Current price is: $8.00.

Forex Trading
Original price was: $799.00.$15.00Current price is: $15.00.

Original price was: $197.00.$5.00Current price is: $5.00.

Original price was: $4,995.00.$15.00Current price is: $15.00.

Original price was: $310.00.$23.00Current price is: $23.00.

Forex Trading
Original price was: $4,997.00.$27.00Current price is: $27.00.

Original price was: $999.00.$5.00Current price is: $5.00.

Forex Trading
Original price was: $2,997.00.$23.00Current price is: $23.00.
Original price was: $497.00.$11.00Current price is: $11.00.

Original price was: $1,849.00.$15.00Current price is: $15.00.
Forex Trading
Quantamentals – The Next Great Forefront Of Trading and Investing with Trading Markets
Original price was: $1,495.00.$8.00Current price is: $8.00.
Forex Trading
Original price was: $499.00.$15.00Current price is: $15.00.

Original price was: $799.00.$15.00Current price is: $15.00.
Forex Trading
Original price was: $249.00.$15.00Current price is: $15.00.
Forex Trading
Original price was: $697.00.$5.00Current price is: $5.00.

Original price was: $2,120.00.$15.00Current price is: $15.00.

Forex Trading
Original price was: $2,995.00.$31.00Current price is: $31.00.
Forex Trading
Original price was: $397.00.$31.00Current price is: $31.00.
Forex Trading
Original price was: $797.00.$10.00Current price is: $10.00.

Forex Trading
Original price was: $239.00.$8.00Current price is: $8.00.

Reviews
There are no reviews yet.