-
×
 3 Hour Calendar Class With Bonus 3 Months Daily Analysis!
1 × $23.00
3 Hour Calendar Class With Bonus 3 Months Daily Analysis!
1 × $23.00 -
×
 The Delphi Scalper 4 - Video + Metatrader Indicators with Jason Fielder
1 × $6.00
The Delphi Scalper 4 - Video + Metatrader Indicators with Jason Fielder
1 × $6.00 -
×
 Options, Futures & Other Derivatives (5th Ed.)
1 × $6.00
Options, Futures & Other Derivatives (5th Ed.)
1 × $6.00 -
×
 Proven Chart Patterns: Key Indicators for Success in Today’s Markets with Chris Manning
1 × $6.00
Proven Chart Patterns: Key Indicators for Success in Today’s Markets with Chris Manning
1 × $6.00 -
×
 Gann’s Scientific Methods Unveiled (Vol I, II)
1 × $6.00
Gann’s Scientific Methods Unveiled (Vol I, II)
1 × $6.00 -
×
 Forex Made Easy: 6 Ways to Trade the Dollar with James Dicks
1 × $6.00
Forex Made Easy: 6 Ways to Trade the Dollar with James Dicks
1 × $6.00 -
×
 Tradezilla 2.0
1 × $5.00
Tradezilla 2.0
1 × $5.00 -
×
 Edges For Ledges 2 with Trader Dante
1 × $5.00
Edges For Ledges 2 with Trader Dante
1 × $5.00 -
×
 Option Trading: Pricing and Volatility Strategies and Techniques with Euan Sinclair
1 × $6.00
Option Trading: Pricing and Volatility Strategies and Techniques with Euan Sinclair
1 × $6.00 -
×
 Stock Selection Course with Dave Landry
1 × $6.00
Stock Selection Course with Dave Landry
1 × $6.00 -
×
 Simpler Options - Ultimate Guide to Debit Spreads – Nov 2014
1 × $6.00
Simpler Options - Ultimate Guide to Debit Spreads – Nov 2014
1 × $6.00 -
×
 PennyStocking with Timothy Sykes
1 × $5.00
PennyStocking with Timothy Sykes
1 × $5.00 -
×
 Stock Investing Strategies with Maria Crawford Scott, John Bajkowski
1 × $6.00
Stock Investing Strategies with Maria Crawford Scott, John Bajkowski
1 × $6.00 -
×
 Lazy Gap Trader Course with David Frost
1 × $6.00
Lazy Gap Trader Course with David Frost
1 × $6.00 -
×
 Master The Markets 2.0 with French Trader
1 × $6.00
Master The Markets 2.0 with French Trader
1 × $6.00 -
×
 MTA Master Trader Academy with Junior Charles
1 × $5.00
MTA Master Trader Academy with Junior Charles
1 × $5.00 -
×
 FXStreet Unrecorded Webinars Sept & Oct, 2011 with Sam Seiden
1 × $6.00
FXStreet Unrecorded Webinars Sept & Oct, 2011 with Sam Seiden
1 × $6.00 -
×
 Trading For A Living Course with Yvan Byeajee - Trading Composure
1 × $6.00
Trading For A Living Course with Yvan Byeajee - Trading Composure
1 × $6.00 -
×
 The Orderflow Masterclass with PrimeTrading
1 × $17.00
The Orderflow Masterclass with PrimeTrading
1 × $17.00 -
×
 The Day Traders Fast Track Program
1 × $23.00
The Day Traders Fast Track Program
1 × $23.00 -
×
 Sell & Sell Short with Alexander Elder
1 × $6.00
Sell & Sell Short with Alexander Elder
1 × $6.00 -
×
 Market Forecasting. Stocks and Grain
1 × $6.00
Market Forecasting. Stocks and Grain
1 × $6.00 -
×
 Trade The Price Action with Thomas Wood (Valuecharts)
1 × $15.00
Trade The Price Action with Thomas Wood (Valuecharts)
1 × $15.00 -
×
 Technical Analysis 101: A Comprehensive Guide to Becoming a Better Trader Class with Jeff Bierman
1 × $6.00
Technical Analysis 101: A Comprehensive Guide to Becoming a Better Trader Class with Jeff Bierman
1 × $6.00 -
×
 Market Masters. How Traders Think Trade And Invest with Jake Bernstein
1 × $6.00
Market Masters. How Traders Think Trade And Invest with Jake Bernstein
1 × $6.00 -
×
 Market Wizards with Jack Schwager
1 × $6.00
Market Wizards with Jack Schwager
1 × $6.00 -
×
 Consistently Profitable Trader with Pollinate Trading
1 × $13.00
Consistently Profitable Trader with Pollinate Trading
1 × $13.00 -
×
 Chart Reading Course with TraderSumo
1 × $5.00
Chart Reading Course with TraderSumo
1 × $5.00 -
×
 Investing for the Long Term with Peter Bernstein
1 × $6.00
Investing for the Long Term with Peter Bernstein
1 × $6.00 -
×
 Full 2 Day Dark Pool And Market Strategy Training
1 × $6.00
Full 2 Day Dark Pool And Market Strategy Training
1 × $6.00 -
×
 How I Trade for a Living with Gary Smith
1 × $6.00
How I Trade for a Living with Gary Smith
1 × $6.00 -
×
 Home Run Options Trading Course with Dave Aquino - Base Camp Trading
1 × $11.00
Home Run Options Trading Course with Dave Aquino - Base Camp Trading
1 × $11.00 -
×
 The Art And Science Of Trading with Adam Grimes
1 × $6.00
The Art And Science Of Trading with Adam Grimes
1 × $6.00 -
×
 Chart Pattern Profits
1 × $6.00
Chart Pattern Profits
1 × $6.00 -
×
 Gannline. Total School Package
1 × $6.00
Gannline. Total School Package
1 × $6.00 -
×
 Increase Your Net Worth In 2 Hours A Week with Jerremy Newsome - Real Life Trading
1 × $17.00
Increase Your Net Worth In 2 Hours A Week with Jerremy Newsome - Real Life Trading
1 × $17.00 -
×
 The Best Option Trading Course with David Jaffee - Best Stock Strategy
1 × $15.00
The Best Option Trading Course with David Jaffee - Best Stock Strategy
1 × $15.00 -
×
 Peter Borish Online Trader Program
1 × $15.00
Peter Borish Online Trader Program
1 × $15.00 -
×
 The Bond Book (2nd Ed.) with Annette Thau
1 × $6.00
The Bond Book (2nd Ed.) with Annette Thau
1 × $6.00 -
×
 How To Write High Converting Copy with Tej Dosa
1 × $6.00
How To Write High Converting Copy with Tej Dosa
1 × $6.00 -
×
 Sacredscience - Sepharial Arcana – Rubber
1 × $6.00
Sacredscience - Sepharial Arcana – Rubber
1 × $6.00 -
×
 Pattern Trader Pro with ForexStore
1 × $6.00
Pattern Trader Pro with ForexStore
1 × $6.00 -
×
 TradeGuider Education Package
1 × $54.00
TradeGuider Education Package
1 × $54.00 -
×
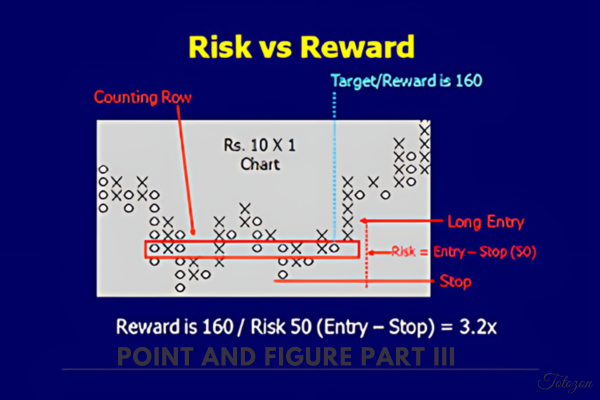 Point And Figure Part III By Bruce Fraser & Roman Bogomazov - Wyckoff Analytics
1 × $23.00
Point And Figure Part III By Bruce Fraser & Roman Bogomazov - Wyckoff Analytics
1 × $23.00 -
×
 Sovereign Man Price Value International 2016
1 × $15.00
Sovereign Man Price Value International 2016
1 × $15.00 -
×
 IBD Advanced Buying Strategies Home Study Program
1 × $10.00
IBD Advanced Buying Strategies Home Study Program
1 × $10.00 -
×
 Essentials in Quantitative Trading QT01 By HangukQuant's
1 × $23.00
Essentials in Quantitative Trading QT01 By HangukQuant's
1 × $23.00 -
×
 Starter Guide to Investing Stocks, Crypto & Precious Metals with Ryan Hogue
1 × $5.00
Starter Guide to Investing Stocks, Crypto & Precious Metals with Ryan Hogue
1 × $5.00 -
×
 How To Successfully Trade The Haggerty Slim Jim Strategy for Explosive Gains with Kevin Haggerty
1 × $6.00
How To Successfully Trade The Haggerty Slim Jim Strategy for Explosive Gains with Kevin Haggerty
1 × $6.00 -
×
 Precision Timing Your Options Trades Using Fibonacci with Trading Analysis
1 × $15.00
Precision Timing Your Options Trades Using Fibonacci with Trading Analysis
1 × $15.00 -
×
 Investment Strategies for the 21th Century with Frank Amstrong
1 × $6.00
Investment Strategies for the 21th Century with Frank Amstrong
1 × $6.00 -
×
 Short Swing Trading v6.0 with David Smith
1 × $6.00
Short Swing Trading v6.0 with David Smith
1 × $6.00 -
×
 Advanced Options Trading with Lucas Downey
1 × $15.00
Advanced Options Trading with Lucas Downey
1 × $15.00 -
×
 Forex Trading Plan - Learn How To Set SMART Trading Goals! with Anas Abba & FXMindTrix Academy
1 × $6.00
Forex Trading Plan - Learn How To Set SMART Trading Goals! with Anas Abba & FXMindTrix Academy
1 × $6.00 -
×
 Applying Fibonacci Analysis to Price Action
1 × $6.00
Applying Fibonacci Analysis to Price Action
1 × $6.00 -
×
 Forex Shockwave Analysis with James Bickford
1 × $6.00
Forex Shockwave Analysis with James Bickford
1 × $6.00 -
×
 Stock Market Strategies That Work with Jack Bernstein
1 × $6.00
Stock Market Strategies That Work with Jack Bernstein
1 × $6.00 -
×
 OPTIONS FOR BEGINNERS
1 × $6.00
OPTIONS FOR BEGINNERS
1 × $6.00 -
×
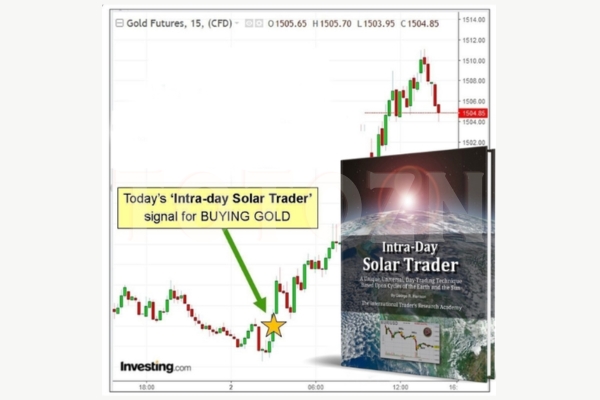 Intra-day Solar Trader with George Harrison
1 × $17.00
Intra-day Solar Trader with George Harrison
1 × $17.00 -
×
 Day Trading and Swing Trading Futures with Price Action by Humberto Malaspina
1 × $5.00
Day Trading and Swing Trading Futures with Price Action by Humberto Malaspina
1 × $5.00 -
×
 NY 6 - Jason McDonald – Why Shorts are Hard to Find and How You Can Find Great Shorts
1 × $6.00
NY 6 - Jason McDonald – Why Shorts are Hard to Find and How You Can Find Great Shorts
1 × $6.00 -
×
 Foundations of Forex Trading with TradeSmart University
1 × $6.00
Foundations of Forex Trading with TradeSmart University
1 × $6.00 -
×
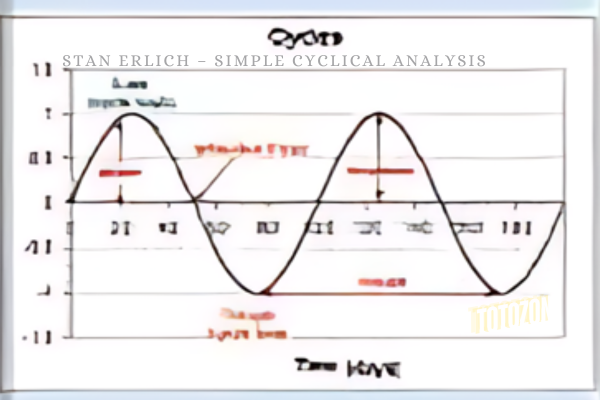 Simple Cyclical Analysis with Stan Erlich
1 × $6.00
Simple Cyclical Analysis with Stan Erlich
1 × $6.00 -
×
 SPIKED COLLARS (Dynamic Hedging)
1 × $15.00
SPIKED COLLARS (Dynamic Hedging)
1 × $15.00 -
×
 HEDGED STRATEGY SERIES IN VOLATILE MARKETS – HEDGED CREDIT SPREADS - Dan Sheridan
1 × $6.00
HEDGED STRATEGY SERIES IN VOLATILE MARKETS – HEDGED CREDIT SPREADS - Dan Sheridan
1 × $6.00 -
×
 Elite Price Action Tutorials with Wmd4x
1 × $8.00
Elite Price Action Tutorials with Wmd4x
1 × $8.00 -
×
 The Amazing Common Sense Guide To Investment Success with John Thomchick
1 × $6.00
The Amazing Common Sense Guide To Investment Success with John Thomchick
1 × $6.00 -
×
 The Day Trading ES Futures Blueprint Class with Corey Rosenbloom
1 × $6.00
The Day Trading ES Futures Blueprint Class with Corey Rosenbloom
1 × $6.00 -
×
 Introduction to Stocks & Forex
1 × $15.00
Introduction to Stocks & Forex
1 × $15.00 -
×
 Small Stocks for Big Profits: Generate Spectacular Returns by Investing in Up-and-Coming Companies with George Angell
1 × $6.00
Small Stocks for Big Profits: Generate Spectacular Returns by Investing in Up-and-Coming Companies with George Angell
1 × $6.00 -
×
 High Probability Trading Using Elliott Wave And Fibonacci Analysis withVic Patel - Forex Training Group
1 × $10.00
High Probability Trading Using Elliott Wave And Fibonacci Analysis withVic Patel - Forex Training Group
1 × $10.00

Investor’s Guide to Charting By Alistair Blair
$6.00
File Size: Cooming soon!
Delivery Time: 1–12 hours
Media Type: Online Course
Content Proof: Watch Here!
You may check content proof of “Investor’s Guide to Charting By Alistair Blair” below:

Investor’s Guide to Charting By Alistair Blair
Introduction
Welcome to the ultimate guide to charting for investors, based on the insights from Alistair Blair. This article aims to provide you with a comprehensive understanding of charting, its importance in investment strategies, and practical tips to enhance your trading skills.
What is Charting?
Charting involves analyzing historical price movements of securities through various types of charts to predict future price movements. It is a fundamental aspect of technical analysis, helping investors make informed decisions.
Why Charting is Essential for Investors
Understanding chart patterns can provide valuable insights into market trends and potential future movements. This can help investors identify entry and exit points, manage risks, and maximize returns.
Types of Charts in Technical Analysis
1. Line Charts
Line charts plot closing prices over a specific period, providing a clear view of the overall trend.
2. Bar Charts
Bar charts display the opening, high, low, and closing prices for each period, giving a more detailed view of price movements.
3. Candlestick Charts
Candlestick charts also show the open, high, low, and close prices but in a more visually appealing format. They are widely used for identifying market patterns.
Key Chart Patterns Every Investor Should Know
1. Head and Shoulders
A reversal pattern that signals a change in trend direction.
2. Double Top and Double Bottom
These patterns indicate potential trend reversals, with the double top suggesting a bearish reversal and the double bottom a bullish reversal.
3. Triangles
Triangles can be ascending, descending, or symmetrical, and they signify continuation or reversal patterns depending on the breakout direction.
Using Indicators in Charting
1. Moving Averages
Moving averages smooth out price data to identify trends. The two most common types are the simple moving average (SMA) and the exponential moving average (EMA).
2. Relative Strength Index (RSI)
RSI measures the speed and change of price movements, helping to identify overbought or oversold conditions.
3. Moving Average Convergence Divergence (MACD)
MACD is a trend-following momentum indicator that shows the relationship between two moving averages.
How to Read Chart Patterns
1. Identifying Trends
Look for higher highs and higher lows for uptrends, and lower highs and lower lows for downtrends.
2. Support and Resistance Levels
Support levels indicate where a price might stop falling, while resistance levels show where a price might stop rising.
3. Volume Analysis
Volume can confirm the strength of a price movement. Higher volume during a price move suggests stronger conviction.
Charting Tools and Software
1. MetaTrader
A popular platform offering a wide range of charting tools and indicators.
2. TradingView
Known for its user-friendly interface and extensive community-driven analysis.
3. Thinkorswim
Provided by TD Ameritrade, it offers professional-level charting capabilities.
Common Mistakes in Charting
1. Overcomplicating Analysis
Stick to a few key indicators and patterns to avoid analysis paralysis.
2. Ignoring Volume
Always consider volume to validate price movements and trends.
3. Not Adjusting for Different Time Frames
Analyze multiple time frames to get a comprehensive view of the market.
Developing a Charting Strategy
1. Define Your Goals
Determine your investment goals and risk tolerance.
2. Backtesting
Test your strategy using historical data to ensure its effectiveness.
3. Stay Updated
Keep learning and adapting to new market conditions and charting techniques.
The Benefits of Using Alistair Blair’s Approach
Alistair Blair’s methodologies emphasize simplicity, clarity, and practical application. By focusing on essential patterns and indicators, investors can make more informed decisions without getting overwhelmed.
Conclusion
Charting is a powerful tool that, when used correctly, can significantly enhance your investment strategy. By following Alistair Blair’s guide, you can develop a robust understanding of charting, identify key patterns, and make informed trading decisions.

Frequently Asked Questions
1. What is the most important chart for beginners to start with?
For beginners, line charts are the easiest to understand and provide a good starting point for identifying trends.
2. How often should I analyze charts?
Regular analysis, such as daily or weekly reviews, can help you stay updated with market trends and make timely decisions.
3. Can charting predict market crashes?
While charting can indicate potential reversals and trends, it cannot predict market crashes with certainty.
4. What is the best charting software for beginners?
TradingView is highly recommended for beginners due to its user-friendly interface and extensive educational resources.
5. How do I combine multiple indicators in my analysis?
Start with a few key indicators, like moving averages and RSI, and gradually incorporate more as you become comfortable with your analysis.
Be the first to review “Investor’s Guide to Charting By Alistair Blair”
You must be logged in to post a review.
Related products

Forex Trading
Original price was: $799.00.$15.00Current price is: $15.00.

Original price was: $1,200.00.$23.00Current price is: $23.00.

Original price was: $299.00.$8.00Current price is: $8.00.

Original price was: $997.00.$8.00Current price is: $8.00.

Original price was: $700.00.$39.00Current price is: $39.00.

Original price was: $1,800.00.$54.00Current price is: $54.00.
Forex Trading
Original price was: $850.00.$23.00Current price is: $23.00.

Forex Trading
Original price was: $1,098.00.$39.00Current price is: $39.00.

Original price was: $310.00.$23.00Current price is: $23.00.

Original price was: $799.00.$15.00Current price is: $15.00.

Forex Trading
Original price was: $239.00.$8.00Current price is: $8.00.

Original price was: $649.00.$20.00Current price is: $20.00.

Forex Trading
Original price was: $2,995.00.$31.00Current price is: $31.00.

Forex Trading
Original price was: $499.00.$15.00Current price is: $15.00.

Forex Trading
Original price was: $249.00.$15.00Current price is: $15.00.

Forex Trading
Quantamentals – The Next Great Forefront Of Trading and Investing with Trading Markets
Original price was: $1,495.00.$8.00Current price is: $8.00.

Original price was: $197.00.$5.00Current price is: $5.00.
Forex Trading
Original price was: $1,898.00.$10.00Current price is: $10.00.

Forex Trading
Original price was: $2,997.00.$23.00Current price is: $23.00.
Forex Trading
Original price was: $797.00.$10.00Current price is: $10.00.

Reviews
There are no reviews yet.