-
×
 Essentials Course & Day Trading Strategies with Bear Bull Traders
1 × $13.00
Essentials Course & Day Trading Strategies with Bear Bull Traders
1 × $13.00 -
×
 The Aime Workshop with Clay Marafiote
1 × $6.00
The Aime Workshop with Clay Marafiote
1 × $6.00 -
×
 Handbook on the Knowledge Economy with David Rooney
1 × $6.00
Handbook on the Knowledge Economy with David Rooney
1 × $6.00 -
×
 Core Strategy Program with Ota Courses
1 × $174.00
Core Strategy Program with Ota Courses
1 × $174.00 -
×
 Guide to Winning with Automated Trading Systems with Jack Schwager
1 × $6.00
Guide to Winning with Automated Trading Systems with Jack Schwager
1 × $6.00 -
×
 Butterfly and Condor Workshop with Aeromir
1 × $15.00
Butterfly and Condor Workshop with Aeromir
1 × $15.00 -
×
 Financial Astrology Course with Brian James Sklenka
1 × $6.00
Financial Astrology Course with Brian James Sklenka
1 × $6.00 -
×
 Square The Range Trading System with Michael Jenkins
1 × $6.00
Square The Range Trading System with Michael Jenkins
1 × $6.00 -
×
 Deep Dive Butterfly Trading Strategy Class with SJG Trades
1 × $41.00
Deep Dive Butterfly Trading Strategy Class with SJG Trades
1 × $41.00 -
×
 Introduction To The STRAT Course with Rob Smith
1 × $8.00
Introduction To The STRAT Course with Rob Smith
1 × $8.00 -
×
 Teresa Lo's PowerSwings EOD for eSignal (powerswings.com)
1 × $6.00
Teresa Lo's PowerSwings EOD for eSignal (powerswings.com)
1 × $6.00 -
×
 Measuring Market Risk (2nd Edition) with Kevin Dowd
1 × $6.00
Measuring Market Risk (2nd Edition) with Kevin Dowd
1 × $6.00 -
×
 Price Analysis Webinar with Carolyn Boroden
1 × $6.00
Price Analysis Webinar with Carolyn Boroden
1 × $6.00 -
×
 60 Minute Trader with Chris Kobewka
1 × $6.00
60 Minute Trader with Chris Kobewka
1 × $6.00 -
×
 FX GOAT 3.0 (ALL IN ONE) with FX GOAT FOREX TRADING ACADEMY
1 × $5.00
FX GOAT 3.0 (ALL IN ONE) with FX GOAT FOREX TRADING ACADEMY
1 × $5.00 -
×
 Out of the Pits with Caitlin Zaloom
1 × $6.00
Out of the Pits with Caitlin Zaloom
1 × $6.00 -
×
 Peter Borish Online Trader Program
1 × $15.00
Peter Borish Online Trader Program
1 × $15.00 -
×
 Forex Strategy Course with Angel Traders
1 × $6.00
Forex Strategy Course with Angel Traders
1 × $6.00 -
×
 Trading Earnings Formula Class with Don Kaufman
1 × $6.00
Trading Earnings Formula Class with Don Kaufman
1 × $6.00 -
×
 Fast Track Course with Tradelikerocket
1 × $233.00
Fast Track Course with Tradelikerocket
1 × $233.00 -
×
 Support and Resistance Trading with Rob Booker
1 × $6.00
Support and Resistance Trading with Rob Booker
1 × $6.00 -
×
 The Ultimate Trading Resource with Clayton Bell, Alex Viscusi & Ben Chaffee
1 × $6.00
The Ultimate Trading Resource with Clayton Bell, Alex Viscusi & Ben Chaffee
1 × $6.00 -
×
 The AB-CD Secret Pattern
1 × $4.00
The AB-CD Secret Pattern
1 × $4.00 -
×
 The Binary Trigger (Video, Books) with John Piper
1 × $6.00
The Binary Trigger (Video, Books) with John Piper
1 × $6.00 -
×
 Corruption and Reform: Lessons from America's Economic History with Edward Glaeser & Claudia Goldin
1 × $6.00
Corruption and Reform: Lessons from America's Economic History with Edward Glaeser & Claudia Goldin
1 × $6.00 -
×
 Small and Mighty Association with Ryan Lee
1 × $6.00
Small and Mighty Association with Ryan Lee
1 × $6.00 -
×
 Sure-thing Options Trading: A Money-Making Guide to the New Listed Stock and Commodity Options Markets - George Angell
1 × $6.00
Sure-thing Options Trading: A Money-Making Guide to the New Listed Stock and Commodity Options Markets - George Angell
1 × $6.00 -
×
 Researching your Trade
1 × $6.00
Researching your Trade
1 × $6.00 -
×
 The All Put Flat Butterfly with Dan Sheridan - Sheridan Options Mentoring
1 × $6.00
The All Put Flat Butterfly with Dan Sheridan - Sheridan Options Mentoring
1 × $6.00 -
×
 The Indices Orderflow Masterclass with The Forex Scalpers
1 × $23.00
The Indices Orderflow Masterclass with The Forex Scalpers
1 × $23.00 -
×
 Stock Market 101 with Sabrina Peterson
1 × $4.00
Stock Market 101 with Sabrina Peterson
1 × $4.00 -
×
 The Bible of Options Strategies: The Definitive Guide for Practical Trading Strategies with Guy Cohen
1 × $6.00
The Bible of Options Strategies: The Definitive Guide for Practical Trading Strategies with Guy Cohen
1 × $6.00 -
×
 Stock Traders Almanac 2008 with Jeffrey Hirsch & Yale Hirsch
1 × $6.00
Stock Traders Almanac 2008 with Jeffrey Hirsch & Yale Hirsch
1 × $6.00 -
×
 Investor’s Guide to Charting By Alistair Blair
1 × $6.00
Investor’s Guide to Charting By Alistair Blair
1 × $6.00 -
×
 Evidence Based Technical Analysis with David Aronson
1 × $6.00
Evidence Based Technical Analysis with David Aronson
1 × $6.00 -
×
 Professor Jeff Bierman's 15 Class Bundle (The Professor's Package)
1 × $6.00
Professor Jeff Bierman's 15 Class Bundle (The Professor's Package)
1 × $6.00 -
×
 The MMXM Traders Course - The MMXM Trader
1 × $5.00
The MMXM Traders Course - The MMXM Trader
1 × $5.00 -
×
 Developing Profitable Systems from Discretionary to Mechanical with Fred Shutzman
1 × $6.00
Developing Profitable Systems from Discretionary to Mechanical with Fred Shutzman
1 × $6.00 -
×
 TradeCraft: Your Path to Peak Performance Trading By Adam Grimes
1 × $15.00
TradeCraft: Your Path to Peak Performance Trading By Adam Grimes
1 × $15.00 -
×
 The Hindenburg Strategy with Todd Mitchell
1 × $23.00
The Hindenburg Strategy with Todd Mitchell
1 × $23.00 -
×
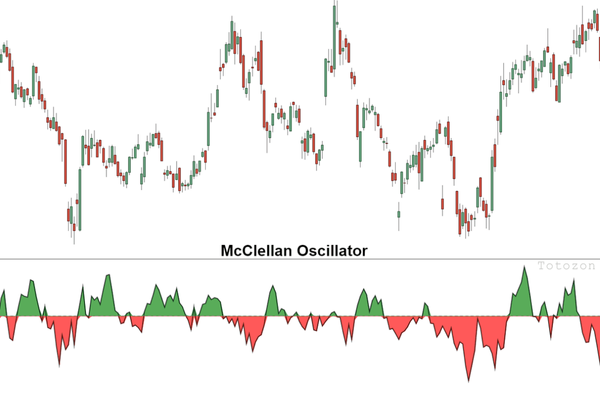 The McClellan Oscillator and Other Tools for with Tom McClellan
1 × $6.00
The McClellan Oscillator and Other Tools for with Tom McClellan
1 × $6.00 -
×
 Options Trading & Ultimate MasterClass With Tyrone Abela - FX Evolution
1 × $54.00
Options Trading & Ultimate MasterClass With Tyrone Abela - FX Evolution
1 × $54.00 -
×
 Sure Fire Forex Trading with Mark McRae
1 × $6.00
Sure Fire Forex Trading with Mark McRae
1 × $6.00 -
×
 Hedges on Hedge Funds: How to Successfully Analyze and Select an Investment with James Hedges
1 × $6.00
Hedges on Hedge Funds: How to Successfully Analyze and Select an Investment with James Hedges
1 × $6.00 -
×
 The Dick Davis Dividend: Straight Talk on Making Money from 40 Years on Wall Street with Dick Davis
1 × $6.00
The Dick Davis Dividend: Straight Talk on Making Money from 40 Years on Wall Street with Dick Davis
1 × $6.00 -
×
 Mastertrader – Mastering Swing Trading
1 × $31.00
Mastertrader – Mastering Swing Trading
1 × $31.00 -
×
 The Insured Portfolio: Your Gateway to Stress-Free Global Investments with Erika Nolan, Marc-Andre Sola & Shannon Crouch
1 × $6.00
The Insured Portfolio: Your Gateway to Stress-Free Global Investments with Erika Nolan, Marc-Andre Sola & Shannon Crouch
1 × $6.00 -
×
 CBOT Seminar on Market Profile (101 & 102) with Alex Benjamin
1 × $6.00
CBOT Seminar on Market Profile (101 & 102) with Alex Benjamin
1 × $6.00 -
×
 High Probability Trading Using Elliott Wave And Fibonacci Analysis withVic Patel - Forex Training Group
1 × $10.00
High Probability Trading Using Elliott Wave And Fibonacci Analysis withVic Patel - Forex Training Group
1 × $10.00
Investor’s Guide to Charting By Alistair Blair
$6.00
File Size: Cooming soon!
Delivery Time: 1–12 hours
Media Type: Online Course
Content Proof: Watch Here!
You may check content proof of “Investor’s Guide to Charting By Alistair Blair” below:

Investor’s Guide to Charting By Alistair Blair
Introduction
Welcome to the ultimate guide to charting for investors, based on the insights from Alistair Blair. This article aims to provide you with a comprehensive understanding of charting, its importance in investment strategies, and practical tips to enhance your trading skills.
What is Charting?
Charting involves analyzing historical price movements of securities through various types of charts to predict future price movements. It is a fundamental aspect of technical analysis, helping investors make informed decisions.
Why Charting is Essential for Investors
Understanding chart patterns can provide valuable insights into market trends and potential future movements. This can help investors identify entry and exit points, manage risks, and maximize returns.
Types of Charts in Technical Analysis
1. Line Charts
Line charts plot closing prices over a specific period, providing a clear view of the overall trend.
2. Bar Charts
Bar charts display the opening, high, low, and closing prices for each period, giving a more detailed view of price movements.
3. Candlestick Charts
Candlestick charts also show the open, high, low, and close prices but in a more visually appealing format. They are widely used for identifying market patterns.
Key Chart Patterns Every Investor Should Know
1. Head and Shoulders
A reversal pattern that signals a change in trend direction.
2. Double Top and Double Bottom
These patterns indicate potential trend reversals, with the double top suggesting a bearish reversal and the double bottom a bullish reversal.
3. Triangles
Triangles can be ascending, descending, or symmetrical, and they signify continuation or reversal patterns depending on the breakout direction.
Using Indicators in Charting
1. Moving Averages
Moving averages smooth out price data to identify trends. The two most common types are the simple moving average (SMA) and the exponential moving average (EMA).
2. Relative Strength Index (RSI)
RSI measures the speed and change of price movements, helping to identify overbought or oversold conditions.
3. Moving Average Convergence Divergence (MACD)
MACD is a trend-following momentum indicator that shows the relationship between two moving averages.
How to Read Chart Patterns
1. Identifying Trends
Look for higher highs and higher lows for uptrends, and lower highs and lower lows for downtrends.
2. Support and Resistance Levels
Support levels indicate where a price might stop falling, while resistance levels show where a price might stop rising.
3. Volume Analysis
Volume can confirm the strength of a price movement. Higher volume during a price move suggests stronger conviction.
Charting Tools and Software
1. MetaTrader
A popular platform offering a wide range of charting tools and indicators.
2. TradingView
Known for its user-friendly interface and extensive community-driven analysis.
3. Thinkorswim
Provided by TD Ameritrade, it offers professional-level charting capabilities.
Common Mistakes in Charting
1. Overcomplicating Analysis
Stick to a few key indicators and patterns to avoid analysis paralysis.
2. Ignoring Volume
Always consider volume to validate price movements and trends.
3. Not Adjusting for Different Time Frames
Analyze multiple time frames to get a comprehensive view of the market.
Developing a Charting Strategy
1. Define Your Goals
Determine your investment goals and risk tolerance.
2. Backtesting
Test your strategy using historical data to ensure its effectiveness.
3. Stay Updated
Keep learning and adapting to new market conditions and charting techniques.
The Benefits of Using Alistair Blair’s Approach
Alistair Blair’s methodologies emphasize simplicity, clarity, and practical application. By focusing on essential patterns and indicators, investors can make more informed decisions without getting overwhelmed.
Conclusion
Charting is a powerful tool that, when used correctly, can significantly enhance your investment strategy. By following Alistair Blair’s guide, you can develop a robust understanding of charting, identify key patterns, and make informed trading decisions.

Frequently Asked Questions
1. What is the most important chart for beginners to start with?
For beginners, line charts are the easiest to understand and provide a good starting point for identifying trends.
2. How often should I analyze charts?
Regular analysis, such as daily or weekly reviews, can help you stay updated with market trends and make timely decisions.
3. Can charting predict market crashes?
While charting can indicate potential reversals and trends, it cannot predict market crashes with certainty.
4. What is the best charting software for beginners?
TradingView is highly recommended for beginners due to its user-friendly interface and extensive educational resources.
5. How do I combine multiple indicators in my analysis?
Start with a few key indicators, like moving averages and RSI, and gradually incorporate more as you become comfortable with your analysis.
Be the first to review “Investor’s Guide to Charting By Alistair Blair”
You must be logged in to post a review.
Related products

Forex Trading
Original price was: $697.00.$5.00Current price is: $5.00.

Original price was: $1,849.00.$15.00Current price is: $15.00.

Original price was: $197.00.$5.00Current price is: $5.00.
Forex Trading
Original price was: $797.00.$10.00Current price is: $10.00.
Original price was: $1,800.00.$54.00Current price is: $54.00.

Original price was: $497.00.$11.00Current price is: $11.00.

Forex Trading
The Complete Guide to Multiple Time Frame Analysis & Reading Price Action with Aiman Almansoori
Original price was: $1,399.00.$13.00Current price is: $13.00.

Forex Trading
Original price was: $249.00.$15.00Current price is: $15.00.
Forex Trading
Original price was: $1,898.00.$10.00Current price is: $10.00.

Forex Trading
Original price was: $4,997.00.$27.00Current price is: $27.00.

Forex Trading
Original price was: $2,997.00.$23.00Current price is: $23.00.

Forex Trading
Original price was: $239.00.$8.00Current price is: $8.00.

Forex Trading
Original price was: $550.00.$5.00Current price is: $5.00.

Forex Trading
Original price was: $2,000.00.$23.00Current price is: $23.00.

Forex Trading
Original price was: $500.00.$5.00Current price is: $5.00.

Forex Trading
Original price was: $2,995.00.$31.00Current price is: $31.00.

Forex Trading
Original price was: $999.00.$15.00Current price is: $15.00.
Forex Trading
Original price was: $799.00.$15.00Current price is: $15.00.

Original price was: $997.00.$8.00Current price is: $8.00.

Forex Trading
Original price was: $125.00.$17.00Current price is: $17.00.

Reviews
There are no reviews yet.