-
×
 Investment Science with David G.Luenberger
1 × $6.00
Investment Science with David G.Luenberger
1 × $6.00 -
×
 High Rollers Mega Course Bundle - 13 Market Moves
1 × $39.00
High Rollers Mega Course Bundle - 13 Market Moves
1 × $39.00 -
×
 Predicting Market Trends with Periodic Number Cycle
1 × $6.00
Predicting Market Trends with Periodic Number Cycle
1 × $6.00 -
×
 Forex Trading For Beginners with John Jagerson - Investopedia Academy
1 × $6.00
Forex Trading For Beginners with John Jagerson - Investopedia Academy
1 × $6.00 -
×
 Point and Figure Mentorship Course
1 × $54.00
Point and Figure Mentorship Course
1 × $54.00 -
×
 Peak Capital Trading Bootcamp with Andrew Aziz
1 × $5.00
Peak Capital Trading Bootcamp with Andrew Aziz
1 × $5.00 -
×
 Day Trading Options Guide PDF with Matt Diamond
1 × $23.00
Day Trading Options Guide PDF with Matt Diamond
1 × $23.00 -
×
 The Aftermath + Jack Savage Extras (How To Trade Gold) with FXSavages
1 × $6.00
The Aftermath + Jack Savage Extras (How To Trade Gold) with FXSavages
1 × $6.00 -
×
 Forex Powerband Dominator
1 × $6.00
Forex Powerband Dominator
1 × $6.00 -
×
 Candlestick Charts with Clive Lambert
1 × $6.00
Candlestick Charts with Clive Lambert
1 × $6.00 -
×
 THE ART OF ADJUSTING IN 2017
1 × $6.00
THE ART OF ADJUSTING IN 2017
1 × $6.00 -
×
 Advanced Bond Trading Course
1 × $62.00
Advanced Bond Trading Course
1 × $62.00 -
×
 SO FX Educational Course with SO FX
1 × $5.00
SO FX Educational Course with SO FX
1 × $5.00 -
×
 Advanced Option Trading with Broken Wing Butterflys with Greg Loehr
1 × $9.00
Advanced Option Trading with Broken Wing Butterflys with Greg Loehr
1 × $9.00 -
×
 Forex 201 - Advanced Strategies with Stonehill Forex
1 × $5.00
Forex 201 - Advanced Strategies with Stonehill Forex
1 × $5.00 -
×
 E-mini Weekly Options Income with Peter Titus
1 × $15.00
E-mini Weekly Options Income with Peter Titus
1 × $15.00 -
×
 WYCKOFF TRADING COURSE (WTC) PART I – ANALYSIS (Spring 2023) - Roman Bogomazov & Alessio Rutigliano
1 × $209.00
WYCKOFF TRADING COURSE (WTC) PART I – ANALYSIS (Spring 2023) - Roman Bogomazov & Alessio Rutigliano
1 × $209.00 -
×
 Masterclass 2.0 with Dave Teaches
1 × $31.00
Masterclass 2.0 with Dave Teaches
1 × $31.00 -
×
 Golden Pips Generator - DMA HACK with Hooman
1 × $62.00
Golden Pips Generator - DMA HACK with Hooman
1 × $62.00 -
×
 The Day Trader: From the Pit to the PC with Lewis Borsellino
1 × $6.00
The Day Trader: From the Pit to the PC with Lewis Borsellino
1 × $6.00 -
×
 Reading The Tape Trade Series with CompassFX
1 × $10.00
Reading The Tape Trade Series with CompassFX
1 × $10.00 -
×
 Signals
1 × $6.00
Signals
1 × $6.00 -
×
 Acclimation Course with Base Camp Trading
1 × $10.00
Acclimation Course with Base Camp Trading
1 × $10.00 -
×
 Path to Profits By Scott Redler - T3 Live
1 × $6.00
Path to Profits By Scott Redler - T3 Live
1 × $6.00 -
×
 Coulda, woulda, shoulda with Charles Cottle
1 × $6.00
Coulda, woulda, shoulda with Charles Cottle
1 × $6.00 -
×
 PDFT (Price Driven Forex Trading) Course with Avi Frister
1 × $6.00
PDFT (Price Driven Forex Trading) Course with Avi Frister
1 × $6.00 -
×
 Trading Options Effectively with Paul Forchione
1 × $4.00
Trading Options Effectively with Paul Forchione
1 × $4.00 -
×
 Rounded Bottom Breakout Multimedia Course
1 × $31.00
Rounded Bottom Breakout Multimedia Course
1 × $31.00 -
×
 Naked Trading Part 1 with Base Camp Trading
1 × $6.00
Naked Trading Part 1 with Base Camp Trading
1 × $6.00 -
×
 How to Trade a Vertical Market
1 × $93.00
How to Trade a Vertical Market
1 × $93.00 -
×
 Daytrade (Italian) with Guiuseppe Migliorino
1 × $6.00
Daytrade (Italian) with Guiuseppe Migliorino
1 × $6.00 -
×
 Set and Forget with Alex Gonzalez - Swing Trading Lab
1 × $5.00
Set and Forget with Alex Gonzalez - Swing Trading Lab
1 × $5.00 -
×
 ETFs for the Long Run: What They Are, How They Work, and Simple Strategies for Successful Long-Term Investing - Lawrence Carrel
1 × $6.00
ETFs for the Long Run: What They Are, How They Work, and Simple Strategies for Successful Long-Term Investing - Lawrence Carrel
1 × $6.00 -
×
 Getting Started in Technical Analysis with Jack Schwager
1 × $6.00
Getting Started in Technical Analysis with Jack Schwager
1 × $6.00 -
×
 Synthetic and Structured Assets: A Practical Guide to Investment and Risk with Erik Banks
1 × $6.00
Synthetic and Structured Assets: A Practical Guide to Investment and Risk with Erik Banks
1 × $6.00 -
×
 The Handbook of Pairs Trading with Douglas Ehrman
1 × $6.00
The Handbook of Pairs Trading with Douglas Ehrman
1 × $6.00 -
×
 Baby Blue Trading Technique for the E-Minis with Dave Wright
1 × $6.00
Baby Blue Trading Technique for the E-Minis with Dave Wright
1 × $6.00 -
×
 Futures 101: An Introduction to Futures Contracts Class with Don Kaufman
1 × $6.00
Futures 101: An Introduction to Futures Contracts Class with Don Kaufman
1 × $6.00 -
×
 Relationship of the StockMarket Fluctuations to the Lunarcycle with Frank J.Guarino
1 × $6.00
Relationship of the StockMarket Fluctuations to the Lunarcycle with Frank J.Guarino
1 × $6.00 -
×
 Power Charting - Robert’s Indicator Webinar
1 × $6.00
Power Charting - Robert’s Indicator Webinar
1 × $6.00 -
×
 AI For Traders with Trading Markets
1 × $31.00
AI For Traders with Trading Markets
1 × $31.00 -
×
 How to Find the Most Profitable Stocks with Mubarak Shah
1 × $6.00
How to Find the Most Profitable Stocks with Mubarak Shah
1 × $6.00 -
×
 Candlesticks Explained with Martin Pring
1 × $6.00
Candlesticks Explained with Martin Pring
1 × $6.00 -
×
 Channel Analysis. The Key to Improved Timing of Trades with Brian J.Millard
1 × $6.00
Channel Analysis. The Key to Improved Timing of Trades with Brian J.Millard
1 × $6.00 -
×
 Measuring & Controlling Interest Rate & Credit Risk (2nd Ed.) with Frank Fabozzi, Steven Mann & Moorad Choudhry
1 × $6.00
Measuring & Controlling Interest Rate & Credit Risk (2nd Ed.) with Frank Fabozzi, Steven Mann & Moorad Choudhry
1 × $6.00 -
×
 Astro Models (techedgecycles.com) with Yuri Shramenko
1 × $6.00
Astro Models (techedgecycles.com) with Yuri Shramenko
1 × $6.00 -
×
 Long/Short Market Dynamics: Trading Strategies for Today's Markets with Clive Corcoran
1 × $6.00
Long/Short Market Dynamics: Trading Strategies for Today's Markets with Clive Corcoran
1 × $6.00 -
×
 Precision Pattern Trading Workbook with Daryl Guppy
1 × $6.00
Precision Pattern Trading Workbook with Daryl Guppy
1 × $6.00 -
×
 Candlestick & Pivot Point Strategies with John L.Person
1 × $6.00
Candlestick & Pivot Point Strategies with John L.Person
1 × $6.00 -
×
 Pine Script Mastery Course with Matthew Slabosz
1 × $5.00
Pine Script Mastery Course with Matthew Slabosz
1 × $5.00 -
×
 Secrets of the Trading Pros with Jack Bouroudjan & Terrence Duffy
1 × $6.00
Secrets of the Trading Pros with Jack Bouroudjan & Terrence Duffy
1 × $6.00 -
×
 Ron Wagner – Creating a Profitable Trading & Investing Plan. 6 Key Components with Pristine
1 × $4.00
Ron Wagner – Creating a Profitable Trading & Investing Plan. 6 Key Components with Pristine
1 × $4.00 -
×
 Computational Financial Mathematics with Mathematica
1 × $6.00
Computational Financial Mathematics with Mathematica
1 × $6.00 -
×
 Fibonacci for the Active Trader with Derrik Hobbs
1 × $6.00
Fibonacci for the Active Trader with Derrik Hobbs
1 × $6.00 -
×
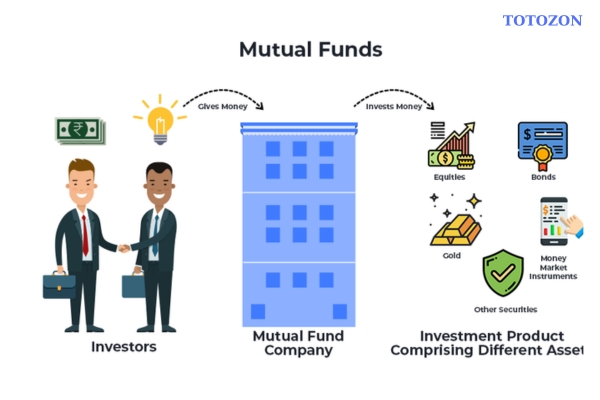 Mutual Funds: Fifty Years of Research Findings by Seth C. Anderson
1 × $6.00
Mutual Funds: Fifty Years of Research Findings by Seth C. Anderson
1 × $6.00 -
×
 Stock Market Rules (3rd Ed.) with Michael Sheimo
1 × $6.00
Stock Market Rules (3rd Ed.) with Michael Sheimo
1 × $6.00 -
×
 How I use Technical Analysis & Orderflow with Adam Webb - Traderskew
1 × $54.00
How I use Technical Analysis & Orderflow with Adam Webb - Traderskew
1 × $54.00 -
×
 Quantamentals - The Next Great Forefront Of Trading and Investing with Trading Markets
1 × $8.00
Quantamentals - The Next Great Forefront Of Trading and Investing with Trading Markets
1 × $8.00

Investor’s Guide to Charting By Alistair Blair
$6.00
File Size: Cooming soon!
Delivery Time: 1–12 hours
Media Type: Online Course
Content Proof: Watch Here!
You may check content proof of “Investor’s Guide to Charting By Alistair Blair” below:

Investor’s Guide to Charting By Alistair Blair
Introduction
Welcome to the ultimate guide to charting for investors, based on the insights from Alistair Blair. This article aims to provide you with a comprehensive understanding of charting, its importance in investment strategies, and practical tips to enhance your trading skills.
What is Charting?
Charting involves analyzing historical price movements of securities through various types of charts to predict future price movements. It is a fundamental aspect of technical analysis, helping investors make informed decisions.
Why Charting is Essential for Investors
Understanding chart patterns can provide valuable insights into market trends and potential future movements. This can help investors identify entry and exit points, manage risks, and maximize returns.
Types of Charts in Technical Analysis
1. Line Charts
Line charts plot closing prices over a specific period, providing a clear view of the overall trend.
2. Bar Charts
Bar charts display the opening, high, low, and closing prices for each period, giving a more detailed view of price movements.
3. Candlestick Charts
Candlestick charts also show the open, high, low, and close prices but in a more visually appealing format. They are widely used for identifying market patterns.
Key Chart Patterns Every Investor Should Know
1. Head and Shoulders
A reversal pattern that signals a change in trend direction.
2. Double Top and Double Bottom
These patterns indicate potential trend reversals, with the double top suggesting a bearish reversal and the double bottom a bullish reversal.
3. Triangles
Triangles can be ascending, descending, or symmetrical, and they signify continuation or reversal patterns depending on the breakout direction.
Using Indicators in Charting
1. Moving Averages
Moving averages smooth out price data to identify trends. The two most common types are the simple moving average (SMA) and the exponential moving average (EMA).
2. Relative Strength Index (RSI)
RSI measures the speed and change of price movements, helping to identify overbought or oversold conditions.
3. Moving Average Convergence Divergence (MACD)
MACD is a trend-following momentum indicator that shows the relationship between two moving averages.
How to Read Chart Patterns
1. Identifying Trends
Look for higher highs and higher lows for uptrends, and lower highs and lower lows for downtrends.
2. Support and Resistance Levels
Support levels indicate where a price might stop falling, while resistance levels show where a price might stop rising.
3. Volume Analysis
Volume can confirm the strength of a price movement. Higher volume during a price move suggests stronger conviction.
Charting Tools and Software
1. MetaTrader
A popular platform offering a wide range of charting tools and indicators.
2. TradingView
Known for its user-friendly interface and extensive community-driven analysis.
3. Thinkorswim
Provided by TD Ameritrade, it offers professional-level charting capabilities.
Common Mistakes in Charting
1. Overcomplicating Analysis
Stick to a few key indicators and patterns to avoid analysis paralysis.
2. Ignoring Volume
Always consider volume to validate price movements and trends.
3. Not Adjusting for Different Time Frames
Analyze multiple time frames to get a comprehensive view of the market.
Developing a Charting Strategy
1. Define Your Goals
Determine your investment goals and risk tolerance.
2. Backtesting
Test your strategy using historical data to ensure its effectiveness.
3. Stay Updated
Keep learning and adapting to new market conditions and charting techniques.
The Benefits of Using Alistair Blair’s Approach
Alistair Blair’s methodologies emphasize simplicity, clarity, and practical application. By focusing on essential patterns and indicators, investors can make more informed decisions without getting overwhelmed.
Conclusion
Charting is a powerful tool that, when used correctly, can significantly enhance your investment strategy. By following Alistair Blair’s guide, you can develop a robust understanding of charting, identify key patterns, and make informed trading decisions.

Frequently Asked Questions
1. What is the most important chart for beginners to start with?
For beginners, line charts are the easiest to understand and provide a good starting point for identifying trends.
2. How often should I analyze charts?
Regular analysis, such as daily or weekly reviews, can help you stay updated with market trends and make timely decisions.
3. Can charting predict market crashes?
While charting can indicate potential reversals and trends, it cannot predict market crashes with certainty.
4. What is the best charting software for beginners?
TradingView is highly recommended for beginners due to its user-friendly interface and extensive educational resources.
5. How do I combine multiple indicators in my analysis?
Start with a few key indicators, like moving averages and RSI, and gradually incorporate more as you become comfortable with your analysis.
Be the first to review “Investor’s Guide to Charting By Alistair Blair”
You must be logged in to post a review.
Related products

Original price was: $1,200.00.$23.00Current price is: $23.00.

Original price was: $695.00.$41.00Current price is: $41.00.

Original price was: $1,800.00.$54.00Current price is: $54.00.

Original price was: $799.00.$15.00Current price is: $15.00.
Forex Trading
Quantamentals – The Next Great Forefront Of Trading and Investing with Trading Markets
Original price was: $1,495.00.$8.00Current price is: $8.00.

Forex Trading
Original price was: $999.00.$15.00Current price is: $15.00.

Forex Trading
Original price was: $1,098.00.$39.00Current price is: $39.00.

Original price was: $895.00.$15.00Current price is: $15.00.

Forex Trading
Original price was: $550.00.$5.00Current price is: $5.00.

Original price was: $139.00.$23.00Current price is: $23.00.

Forex Trading
Original price was: $239.00.$8.00Current price is: $8.00.

Original price was: $310.00.$23.00Current price is: $23.00.

Forex Trading
Original price was: $249.00.$15.00Current price is: $15.00.

Forex Trading
Original price was: $697.00.$5.00Current price is: $5.00.
Forex Trading
Original price was: $2,995.00.$31.00Current price is: $31.00.

Original price was: $299.00.$8.00Current price is: $8.00.

Original price was: $2,120.00.$15.00Current price is: $15.00.

Forex Trading
Original price was: $850.00.$23.00Current price is: $23.00.

Original price was: $1,849.00.$15.00Current price is: $15.00.

Original price was: $997.00.$8.00Current price is: $8.00.

Reviews
There are no reviews yet.