-
×
 Engineering Analysis: Interactive Methods and Programs with FORTRAN, QuickBASIC, MATLAB, and Mathematica with Yen-Ching Pao
1 × $6.00
Engineering Analysis: Interactive Methods and Programs with FORTRAN, QuickBASIC, MATLAB, and Mathematica with Yen-Ching Pao
1 × $6.00 -
×
 FuturesTrader71 - webinar series (4 webinars)
1 × $6.00
FuturesTrader71 - webinar series (4 webinars)
1 × $6.00 -
×
 Trade What You See How To Profit from Pattern Recognition with Larry Pesavento & Leslie Jouflas
1 × $6.00
Trade What You See How To Profit from Pattern Recognition with Larry Pesavento & Leslie Jouflas
1 × $6.00 -
×
 A14 Weekly Options Strategy Workshop 2023 with Amy Meissner - Aeromir
1 × $23.00
A14 Weekly Options Strategy Workshop 2023 with Amy Meissner - Aeromir
1 × $23.00 -
×
 Traders Winning Edge with Adrienne Laris Toghraie
1 × $6.00
Traders Winning Edge with Adrienne Laris Toghraie
1 × $6.00 -
×
 Chart Pattern Profits
1 × $6.00
Chart Pattern Profits
1 × $6.00 -
×
 30 Trading Classics with 3T Live
1 × $5.00
30 Trading Classics with 3T Live
1 × $5.00 -
×
 WondaFX Signature Strategy with WondaFX
1 × $5.00
WondaFX Signature Strategy with WondaFX
1 × $5.00 -
×
 Advanced Ichimoku Kinkō Hyō - Ichimoku Cloud Strategy with Rafał Zuchowicz - TopMasterTrader
1 × $17.00
Advanced Ichimoku Kinkō Hyō - Ichimoku Cloud Strategy with Rafał Zuchowicz - TopMasterTrader
1 × $17.00 -
×
 Options Trading & Ultimate MasterClass With Tyrone Abela - FX Evolution
1 × $54.00
Options Trading & Ultimate MasterClass With Tyrone Abela - FX Evolution
1 × $54.00 -
×
 Online Investing Hacks with Bonnie Biafore
1 × $6.00
Online Investing Hacks with Bonnie Biafore
1 × $6.00 -
×
 Donald Delves – Stock Options and the New Rules of Corporate Accountability
1 × $6.00
Donald Delves – Stock Options and the New Rules of Corporate Accountability
1 × $6.00 -
×
 Learn Investing & Trading with Danny Devan
1 × $23.00
Learn Investing & Trading with Danny Devan
1 × $23.00 -
×
 Pring on Price Patterns with Martin Pring
1 × $6.00
Pring on Price Patterns with Martin Pring
1 × $6.00 -
×
 Who is Afraid of Word Trade Organization with Kent Jones
1 × $6.00
Who is Afraid of Word Trade Organization with Kent Jones
1 × $6.00 -
×
 The Streetsmart Guide to Timing the Stock Market with Colin Alexander
1 × $6.00
The Streetsmart Guide to Timing the Stock Market with Colin Alexander
1 × $6.00 -
×
 How To Trade Forex Using Support & Resistance Levels with Vic Noble
1 × $6.00
How To Trade Forex Using Support & Resistance Levels with Vic Noble
1 × $6.00 -
×
 REMORA OPTIONS TRADING (Silver Membership)
1 × $23.00
REMORA OPTIONS TRADING (Silver Membership)
1 × $23.00 -
×
 Generating Consistent Profits On Smaller Accounts
1 × $23.00
Generating Consistent Profits On Smaller Accounts
1 × $23.00 -
×
 Trading Natural Resources in a Volatile Market with Kevin Kerr
1 × $6.00
Trading Natural Resources in a Volatile Market with Kevin Kerr
1 × $6.00 -
×
 T3 Live - The Simple Art of Trading
1 × $31.00
T3 Live - The Simple Art of Trading
1 × $31.00 -
×
 Divorcing the Dow: Using Revolutionary Market Indicators to Profit from the Stealth Boom Ahead - Jim Troup & Sharon Michalsky
1 × $6.00
Divorcing the Dow: Using Revolutionary Market Indicators to Profit from the Stealth Boom Ahead - Jim Troup & Sharon Michalsky
1 × $6.00 -
×
 Letal Forex System with Alex Seeni
1 × $6.00
Letal Forex System with Alex Seeni
1 × $6.00 -
×
 Best of AM Review (Volume 1-3) with Peter Bain
1 × $6.00
Best of AM Review (Volume 1-3) with Peter Bain
1 × $6.00 -
×
 Options Trading with Adam Grimes - MarketLife
1 × $5.00
Options Trading with Adam Grimes - MarketLife
1 × $5.00 -
×
 Futures 101: An Introduction to Futures Contracts Class with Don Kaufman
1 × $6.00
Futures 101: An Introduction to Futures Contracts Class with Don Kaufman
1 × $6.00 -
×
 The Jupiter Effect with John Gribbin & Stephen Plagemann
1 × $6.00
The Jupiter Effect with John Gribbin & Stephen Plagemann
1 × $6.00 -
×
 Futures Trading Secrets Home Study with Bill McCready
1 × $6.00
Futures Trading Secrets Home Study with Bill McCready
1 × $6.00 -
×
 Profitable DayTrading with Precision - George Angell
1 × $6.00
Profitable DayTrading with Precision - George Angell
1 × $6.00 -
×
 The Astrology of the Old Testament or The Lost World Regained with Karl Anderson
1 × $6.00
The Astrology of the Old Testament or The Lost World Regained with Karl Anderson
1 × $6.00 -
×
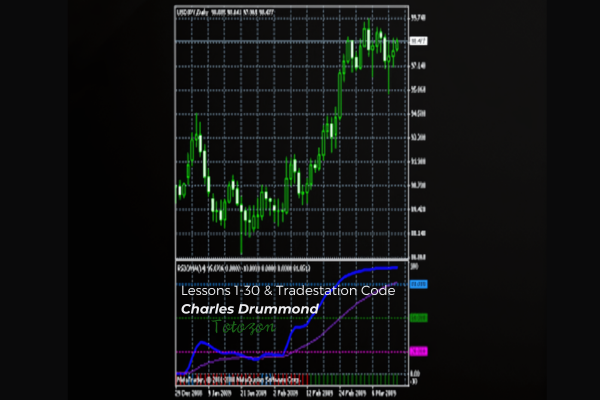 Lessons 1-30 & Tradestation Code with Charles Drummond
1 × $6.00
Lessons 1-30 & Tradestation Code with Charles Drummond
1 × $6.00 -
×
 An Introduction to Option Trading Success with James Bittman
1 × $6.00
An Introduction to Option Trading Success with James Bittman
1 × $6.00 -
×
 Right Line Trading IndicatorSuite (May 2015)
1 × $31.00
Right Line Trading IndicatorSuite (May 2015)
1 × $31.00 -
×
 ICT Prodigy Trading Course – $650K in Payouts with Alex Solignani
1 × $15.00
ICT Prodigy Trading Course – $650K in Payouts with Alex Solignani
1 × $15.00 -
×
 The Poor Man’s Gamma Scalp
1 × $54.00
The Poor Man’s Gamma Scalp
1 × $54.00 -
×
 Catching the Big Moves with Jack Bernstein
1 × $6.00
Catching the Big Moves with Jack Bernstein
1 × $6.00 -
×
 Proven Chart Patterns: Key Indicators for Success in Today’s Markets with Chris Manning
1 × $6.00
Proven Chart Patterns: Key Indicators for Success in Today’s Markets with Chris Manning
1 × $6.00 -
×
 The Ultimate Forex Structure Course
1 × $31.00
The Ultimate Forex Structure Course
1 × $31.00 -
×
 The Aggressive Conservative Investor with Martin Whitman & Martin Shubik
1 × $6.00
The Aggressive Conservative Investor with Martin Whitman & Martin Shubik
1 × $6.00 -
×
 Master Strategies of Super Achievers By Steven Scott
1 × $23.00
Master Strategies of Super Achievers By Steven Scott
1 × $23.00 -
×
 Investing Online with Benton E.Gup
1 × $6.00
Investing Online with Benton E.Gup
1 × $6.00 -
×
 Forecast 2024 Clarification with Larry Williams
1 × $15.00
Forecast 2024 Clarification with Larry Williams
1 × $15.00

Investor’s Guide to Charting By Alistair Blair
$6.00
File Size: Cooming soon!
Delivery Time: 1–12 hours
Media Type: Online Course
Content Proof: Watch Here!
You may check content proof of “Investor’s Guide to Charting By Alistair Blair” below:

Investor’s Guide to Charting By Alistair Blair
Introduction
Welcome to the ultimate guide to charting for investors, based on the insights from Alistair Blair. This article aims to provide you with a comprehensive understanding of charting, its importance in investment strategies, and practical tips to enhance your trading skills.
What is Charting?
Charting involves analyzing historical price movements of securities through various types of charts to predict future price movements. It is a fundamental aspect of technical analysis, helping investors make informed decisions.
Why Charting is Essential for Investors
Understanding chart patterns can provide valuable insights into market trends and potential future movements. This can help investors identify entry and exit points, manage risks, and maximize returns.
Types of Charts in Technical Analysis
1. Line Charts
Line charts plot closing prices over a specific period, providing a clear view of the overall trend.
2. Bar Charts
Bar charts display the opening, high, low, and closing prices for each period, giving a more detailed view of price movements.
3. Candlestick Charts
Candlestick charts also show the open, high, low, and close prices but in a more visually appealing format. They are widely used for identifying market patterns.
Key Chart Patterns Every Investor Should Know
1. Head and Shoulders
A reversal pattern that signals a change in trend direction.
2. Double Top and Double Bottom
These patterns indicate potential trend reversals, with the double top suggesting a bearish reversal and the double bottom a bullish reversal.
3. Triangles
Triangles can be ascending, descending, or symmetrical, and they signify continuation or reversal patterns depending on the breakout direction.
Using Indicators in Charting
1. Moving Averages
Moving averages smooth out price data to identify trends. The two most common types are the simple moving average (SMA) and the exponential moving average (EMA).
2. Relative Strength Index (RSI)
RSI measures the speed and change of price movements, helping to identify overbought or oversold conditions.
3. Moving Average Convergence Divergence (MACD)
MACD is a trend-following momentum indicator that shows the relationship between two moving averages.
How to Read Chart Patterns
1. Identifying Trends
Look for higher highs and higher lows for uptrends, and lower highs and lower lows for downtrends.
2. Support and Resistance Levels
Support levels indicate where a price might stop falling, while resistance levels show where a price might stop rising.
3. Volume Analysis
Volume can confirm the strength of a price movement. Higher volume during a price move suggests stronger conviction.
Charting Tools and Software
1. MetaTrader
A popular platform offering a wide range of charting tools and indicators.
2. TradingView
Known for its user-friendly interface and extensive community-driven analysis.
3. Thinkorswim
Provided by TD Ameritrade, it offers professional-level charting capabilities.
Common Mistakes in Charting
1. Overcomplicating Analysis
Stick to a few key indicators and patterns to avoid analysis paralysis.
2. Ignoring Volume
Always consider volume to validate price movements and trends.
3. Not Adjusting for Different Time Frames
Analyze multiple time frames to get a comprehensive view of the market.
Developing a Charting Strategy
1. Define Your Goals
Determine your investment goals and risk tolerance.
2. Backtesting
Test your strategy using historical data to ensure its effectiveness.
3. Stay Updated
Keep learning and adapting to new market conditions and charting techniques.
The Benefits of Using Alistair Blair’s Approach
Alistair Blair’s methodologies emphasize simplicity, clarity, and practical application. By focusing on essential patterns and indicators, investors can make more informed decisions without getting overwhelmed.
Conclusion
Charting is a powerful tool that, when used correctly, can significantly enhance your investment strategy. By following Alistair Blair’s guide, you can develop a robust understanding of charting, identify key patterns, and make informed trading decisions.

Frequently Asked Questions
1. What is the most important chart for beginners to start with?
For beginners, line charts are the easiest to understand and provide a good starting point for identifying trends.
2. How often should I analyze charts?
Regular analysis, such as daily or weekly reviews, can help you stay updated with market trends and make timely decisions.
3. Can charting predict market crashes?
While charting can indicate potential reversals and trends, it cannot predict market crashes with certainty.
4. What is the best charting software for beginners?
TradingView is highly recommended for beginners due to its user-friendly interface and extensive educational resources.
5. How do I combine multiple indicators in my analysis?
Start with a few key indicators, like moving averages and RSI, and gradually incorporate more as you become comfortable with your analysis.
Be the first to review “Investor’s Guide to Charting By Alistair Blair”
You must be logged in to post a review.
Related products
Forex Trading
Original price was: $249.00.$15.00Current price is: $15.00.

Original price was: $799.00.$15.00Current price is: $15.00.

Original price was: $700.00.$39.00Current price is: $39.00.
Forex Trading
Original price was: $1,898.00.$10.00Current price is: $10.00.

Original price was: $497.00.$11.00Current price is: $11.00.

Forex Trading
Quantamentals – The Next Great Forefront Of Trading and Investing with Trading Markets
Original price was: $1,495.00.$8.00Current price is: $8.00.

Forex Trading
Original price was: $499.00.$15.00Current price is: $15.00.

Original price was: $139.00.$23.00Current price is: $23.00.

Forex Trading
Original price was: $239.00.$8.00Current price is: $8.00.

Original price was: $997.00.$8.00Current price is: $8.00.

Forex Trading
Original price was: $797.00.$10.00Current price is: $10.00.

Original price was: $197.00.$5.00Current price is: $5.00.

Forex Trading
Original price was: $4,997.00.$27.00Current price is: $27.00.

Forex Trading
Original price was: $500.00.$5.00Current price is: $5.00.

Forex Trading
Original price was: $125.00.$17.00Current price is: $17.00.

Original price was: $895.00.$15.00Current price is: $15.00.

Forex Trading
Original price was: $2,997.00.$23.00Current price is: $23.00.

Original price was: $299.00.$8.00Current price is: $8.00.
Original price was: $2,120.00.$15.00Current price is: $15.00.

Original price was: $310.00.$23.00Current price is: $23.00.

Reviews
There are no reviews yet.