-
×
 Advanced Options Trading: Approaches, Tools, and Techniques for Professionals Traders with Kevin Kraus
1 × $6.00
Advanced Options Trading: Approaches, Tools, and Techniques for Professionals Traders with Kevin Kraus
1 × $6.00 -
×
 Matrix Spread Options Trading Course with Base Camp Trading
1 × $31.00
Matrix Spread Options Trading Course with Base Camp Trading
1 × $31.00 -
×
 Relationship of the StockMarket Fluctuations to the Lunarcycle with Frank J.Guarino
1 × $6.00
Relationship of the StockMarket Fluctuations to the Lunarcycle with Frank J.Guarino
1 × $6.00 -
×
 Scalp Strategy and Flipping Small Accounts with Opes Trading Group
1 × $5.00
Scalp Strategy and Flipping Small Accounts with Opes Trading Group
1 × $5.00 -
×
 TradeCraft: Your Path to Peak Performance Trading By Adam Grimes
1 × $15.00
TradeCraft: Your Path to Peak Performance Trading By Adam Grimes
1 × $15.00 -
×
 A Trader’s Guide To Discipline
1 × $6.00
A Trader’s Guide To Discipline
1 × $6.00 -
×
 3 Day WorkShop with HYDRA
1 × $13.00
3 Day WorkShop with HYDRA
1 × $13.00 -
×
 How to Predict and Prepare for a Stock Market Crash with Damon Verial
1 × $6.00
How to Predict and Prepare for a Stock Market Crash with Damon Verial
1 × $6.00 -
×
 30 Day Masterclass with Joe Elite Trader Hub ICT
1 × $6.00
30 Day Masterclass with Joe Elite Trader Hub ICT
1 × $6.00 -
×
 ActiveBeta Indexes. Capturing Systematic Sources of Active Equity Returns (HTML) with Andrew Lo
1 × $6.00
ActiveBeta Indexes. Capturing Systematic Sources of Active Equity Returns (HTML) with Andrew Lo
1 × $6.00 -
×
 Equity Valuation for Analysts and Investors: A Unique Stock Valuation Tool for Financial Statement Analysis and Model-Building with James Kelleher
1 × $6.00
Equity Valuation for Analysts and Investors: A Unique Stock Valuation Tool for Financial Statement Analysis and Model-Building with James Kelleher
1 × $6.00 -
×
 The Orderflow Masterclass with PrimeTrading
1 × $17.00
The Orderflow Masterclass with PrimeTrading
1 × $17.00 -
×
 Advanced Cycles with Nick Santiago - InTheMoneyStocks
1 × $171.00
Advanced Cycles with Nick Santiago - InTheMoneyStocks
1 × $171.00 -
×
 Trade from Anywhere
1 × $6.00
Trade from Anywhere
1 × $6.00 -
×
 OPTIONS FOR BEGINNERS
1 × $6.00
OPTIONS FOR BEGINNERS
1 × $6.00 -
×
 Investment Performance Measurement with Bruce Feibel
1 × $6.00
Investment Performance Measurement with Bruce Feibel
1 × $6.00 -
×
 Slapped by the Invisible Hand: The Panic of 2007 with Gary Gorton
1 × $6.00
Slapped by the Invisible Hand: The Panic of 2007 with Gary Gorton
1 × $6.00 -
×
 Emini Bonds
1 × $23.00
Emini Bonds
1 × $23.00 -
×
 Best of the Best: Collars with Amy Meissner & Scott Ruble
1 × $15.00
Best of the Best: Collars with Amy Meissner & Scott Ruble
1 × $15.00 -
×
 Trading Options Effectively with Paul Forchione
1 × $4.00
Trading Options Effectively with Paul Forchione
1 × $4.00 -
×
 Traders Secret Code Complete Course with Mark McRae
1 × $6.00
Traders Secret Code Complete Course with Mark McRae
1 × $6.00 -
×
 Measuring Risk in Complex Stochastic Systems with J.Franke, W. Hardle, G. Stahl
1 × $6.00
Measuring Risk in Complex Stochastic Systems with J.Franke, W. Hardle, G. Stahl
1 × $6.00 -
×
 Essentials in Quantitative Trading QT01 By HangukQuant's
1 × $23.00
Essentials in Quantitative Trading QT01 By HangukQuant's
1 × $23.00 -
×
 PRO COURSE Order Flow Strategy with Gova Trading Academy
1 × $5.00
PRO COURSE Order Flow Strategy with Gova Trading Academy
1 × $5.00 -
×
 ICT Trading Models with The Prop Trader
1 × $5.00
ICT Trading Models with The Prop Trader
1 × $5.00 -
×
 The Insider's Guide to Forex Trading with Kathy Lien
1 × $6.00
The Insider's Guide to Forex Trading with Kathy Lien
1 × $6.00 -
×
 Deep Dive Butterfly Trading Strategy Class with SJG Trades
1 × $41.00
Deep Dive Butterfly Trading Strategy Class with SJG Trades
1 × $41.00 -
×
 SQX Mentorship with Tip Toe Hippo
1 × $23.00
SQX Mentorship with Tip Toe Hippo
1 × $23.00 -
×
 All About Stock Market Strategies: The Easy Way To Get Started (All About Series) with David Brown
1 × $6.00
All About Stock Market Strategies: The Easy Way To Get Started (All About Series) with David Brown
1 × $6.00 -
×
 Order flow self-study training program with iMFtracker
1 × $10.00
Order flow self-study training program with iMFtracker
1 × $10.00 -
×
 Fierce 10 On Demand Coaching Program with High Performance Trading
1 × $5.00
Fierce 10 On Demand Coaching Program with High Performance Trading
1 × $5.00 -
×
 Candlestick Trading Forum Trading Seminar with Stephen W.Bigalow
1 × $4.00
Candlestick Trading Forum Trading Seminar with Stephen W.Bigalow
1 × $4.00 -
×
 The Naked Eye: Raw Data Analytics with Edgar Torres - Raw Data Analytics
1 × $8.00
The Naked Eye: Raw Data Analytics with Edgar Torres - Raw Data Analytics
1 × $8.00 -
×
 Home Run Options Trading Course with Dave Aquino - Base Camp Trading
1 × $11.00
Home Run Options Trading Course with Dave Aquino - Base Camp Trading
1 × $11.00 -
×
 7 Figures Forex Course
1 × $15.00
7 Figures Forex Course
1 × $15.00 -
×
 AI For Traders with Trading Markets
1 × $31.00
AI For Traders with Trading Markets
1 × $31.00 -
×
 0 DTE Options Trading Workshop with Aeromir Corporation
1 × $15.00
0 DTE Options Trading Workshop with Aeromir Corporation
1 × $15.00 -
×
 Crystal Ball Pack PLUS bonus Live Trade By Pat Mitchell - Trick Trades
1 × $20.00
Crystal Ball Pack PLUS bonus Live Trade By Pat Mitchell - Trick Trades
1 × $20.00 -
×
 The Precision Profit Float Indicator (TS Code & Setups) with Steve Woods
1 × $6.00
The Precision Profit Float Indicator (TS Code & Setups) with Steve Woods
1 × $6.00 -
×
 Profiting In Bull Or Bear Markets with George Dagnino
1 × $6.00
Profiting In Bull Or Bear Markets with George Dagnino
1 × $6.00 -
×
 Developing the Psychological Trader’s Edge with Robin Dayne
1 × $6.00
Developing the Psychological Trader’s Edge with Robin Dayne
1 × $6.00 -
×
 The Indices Orderflow Masterclass with The Forex Scalpers
1 × $23.00
The Indices Orderflow Masterclass with The Forex Scalpers
1 × $23.00 -
×
 Algo Trading Masterclass with Ali Casey - StatOasis
1 × $23.00
Algo Trading Masterclass with Ali Casey - StatOasis
1 × $23.00 -
×
 Options Trading & Ultimate MasterClass With Tyrone Abela - FX Evolution
1 × $54.00
Options Trading & Ultimate MasterClass With Tyrone Abela - FX Evolution
1 × $54.00 -
×
 Butterfly and Condor Workshop with Aeromir
1 × $15.00
Butterfly and Condor Workshop with Aeromir
1 × $15.00 -
×
 Stock Trading Simplified - 3 DVD + PDF Workbook with John Person
1 × $6.00
Stock Trading Simplified - 3 DVD + PDF Workbook with John Person
1 × $6.00 -
×
 Forex Trading Advice & Intro to The Natural Flow
1 × $6.00
Forex Trading Advice & Intro to The Natural Flow
1 × $6.00 -
×
 All About Bonds & Mutual Funds with Esme Faerber
1 × $6.00
All About Bonds & Mutual Funds with Esme Faerber
1 × $6.00 -
×
 Signals
1 × $6.00
Signals
1 × $6.00 -
×
 The Complete Guide to Multiple Time Frame Analysis & Reading Price Action with Aiman Almansoori
1 × $13.00
The Complete Guide to Multiple Time Frame Analysis & Reading Price Action with Aiman Almansoori
1 × $13.00 -
×
 The A14 Weekly Option Strategy Workshop with Amy Meissner
1 × $23.00
The A14 Weekly Option Strategy Workshop with Amy Meissner
1 × $23.00 -
×
 Trading a Living Thing (Article) with David Bowden
1 × $6.00
Trading a Living Thing (Article) with David Bowden
1 × $6.00 -
×
 The Crypto Code with Joel Peterson - Adam Short
1 × $15.00
The Crypto Code with Joel Peterson - Adam Short
1 × $15.00 -
×
 A Day In The Life Of A Forex Trader with Vic Noble & Shirley Hudson
1 × $23.00
A Day In The Life Of A Forex Trader with Vic Noble & Shirley Hudson
1 × $23.00 -
×
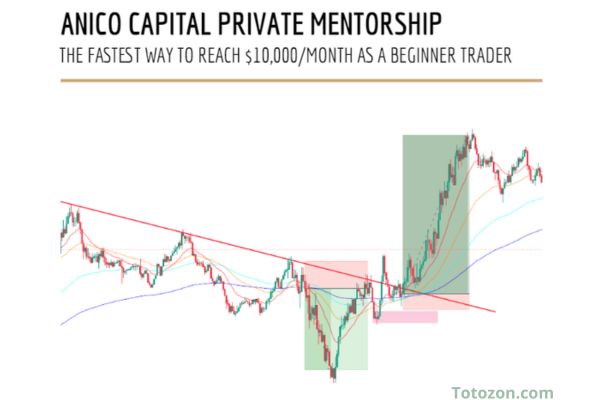 Private Mentorship with ANICO Capital
1 × $10.00
Private Mentorship with ANICO Capital
1 × $10.00 -
×
 The Best Option Trading Course with David Jaffee - Best Stock Strategy
1 × $15.00
The Best Option Trading Course with David Jaffee - Best Stock Strategy
1 × $15.00 -
×
 Commodity Speculation for Beginners with Charles Huff, Barbara Marinacci
1 × $6.00
Commodity Speculation for Beginners with Charles Huff, Barbara Marinacci
1 × $6.00 -
×
 Gann Trade Real Time with Larry B.Jacobs
1 × $6.00
Gann Trade Real Time with Larry B.Jacobs
1 × $6.00 -
×
 Quantamentals - The Next Great Forefront Of Trading and Investing with Trading Markets
1 × $8.00
Quantamentals - The Next Great Forefront Of Trading and Investing with Trading Markets
1 × $8.00 -
×
 Advanced Spread Trading with Guy Bower - MasterClass Trader
1 × $15.00
Advanced Spread Trading with Guy Bower - MasterClass Trader
1 × $15.00 -
×
 5-Day Master Trader Program 2022 with Mark Minervini
1 × $31.00
5-Day Master Trader Program 2022 with Mark Minervini
1 × $31.00
 with John J.Murphy")
InterMarket Analysis (Ed.2004) with John J.Murphy
$6.00
File Size: Coming soon!
Delivery Time: 1–12 hours
Media Type: Online Course
Content Proof: Watch Here!
You may check content proof of “InterMarket Analysis (Ed.2004) with John J.Murphy” below:
 with John J.Murphy")
InterMarket Analysis (Ed. 2004) with John J. Murphy
In the complex world of financial trading, understanding the relationships between different markets is crucial. John J. Murphy’s “InterMarket Analysis” (Ed. 2004) provides a comprehensive guide to this approach, offering traders invaluable insights into market dynamics. This article explores the key concepts, tools, and techniques from Murphy’s work, helping you leverage InterMarket Analysis for better trading decisions.
What is InterMarket Analysis?
Definition
InterMarket Analysis involves studying the correlations between different financial markets, such as stocks, bonds, commodities, and currencies. By analyzing these relationships, traders can predict market trends and make informed decisions.
Historical Context
The concept of InterMarket Analysis gained popularity in the late 20th century, with John J. Murphy being one of its foremost proponents. His 2004 edition expands on these principles, incorporating modern market dynamics.
Key Concepts in InterMarket Analysis
Market Correlations
Stocks and Bonds
Typically, stocks and bonds have an inverse relationship. When stock prices rise, bond prices often fall, indicating shifts in investor sentiment and economic conditions.
Commodities and Currencies
Commodity prices can significantly impact currency values, particularly for countries that are major exporters or importers. For instance, rising oil prices can strengthen the currencies of oil-exporting nations.
Leading and Lagging Indicators
Leading Indicators
Leading indicators, such as commodity prices and bond yields, often change direction before the broader market. They provide early signals of potential market trends.
Lagging Indicators
Lagging indicators, like stock prices, confirm trends after they have started. These indicators help validate the signals from leading indicators.
Practical Application of InterMarket Analysis
Identifying Trends
Analyzing the relationships between different markets helps identify trends that might not be apparent when looking at a single market. For example, a rise in bond yields might signal future stock market weakness.
Confirming Signals
InterMarket Analysis can confirm signals from other technical indicators. If multiple markets point in the same direction, it increases the likelihood of a valid trend.
Risk Management
Understanding market correlations helps manage risk more effectively. For example, knowing that rising interest rates typically lead to lower stock prices allows traders to adjust their portfolios accordingly.
Techniques for InterMarket Analysis
Chart Patterns
Head and Shoulders
The head and shoulders pattern, a common reversal pattern, can appear across different markets. Analyzing this pattern in related markets can provide additional confirmation of a trend reversal.
Double Tops and Bottoms
Double tops and bottoms are also reversal patterns that signal the end of a trend. Observing these patterns in multiple markets can provide stronger signals.
Correlation Analysis
Positive Correlation
A positive correlation between two markets means they move in the same direction. For example, a positive correlation between stock prices and commodity prices might indicate a strong economy.
Negative Correlation
A negative correlation means two markets move in opposite directions. The inverse relationship between stocks and bonds is a classic example of negative correlation.
Using Technical Indicators
Moving Averages
Moving averages smooth out price data to identify trends. Applying moving averages to multiple markets can highlight broader market trends.
Relative Strength Index (RSI)
The RSI measures the speed and change of price movements. Comparing RSI values across different markets can provide insights into market strength and potential reversals.
Benefits of InterMarket Analysis
Enhanced Market Understanding
InterMarket Analysis offers a deeper understanding of market dynamics, enabling traders to make more informed decisions.
Improved Trading Strategies
Considering multiple markets allows traders to develop more robust trading strategies that account for broader economic trends.
Better Risk Management
Understanding intermarket relationships helps traders anticipate market movements and manage risk more effectively.
Challenges of InterMarket Analysis
Complexity
InterMarket Analysis requires broad knowledge of multiple markets and their interactions, which can be complex and time-consuming.
Data Interpretation
Accurate data interpretation is crucial. Misinterpreting correlations or signals can lead to incorrect trading decisions.
Advanced Techniques in InterMarket Analysis
Algorithmic Trading
Algorithmic trading uses computer programs to execute trades based on predefined criteria. This approach can enhance trading efficiency and accuracy.
Leveraging Data Analytics
Big data and analytics provide deeper insights into market trends and trader behavior. Use advanced analytics tools to refine your trading strategies.
Utilizing Modern Trading Tools
Modern trading platforms offer real-time data, advanced charting capabilities, and automated trading features, making it easier to apply InterMarket Analysis.
Conclusion
John J. Murphy’s “InterMarket Analysis” (Ed. 2004) remains a crucial resource for traders seeking to understand and anticipate market movements. By analyzing the relationships between different financial markets, traders can gain valuable insights, confirm signals, and manage risk more effectively. As with any trading strategy, continuous education and adaptation to changing market conditions are essential.
 with John J.Murphy")
FAQs
1. What is InterMarket Analysis?
InterMarket Analysis studies the relationships between different financial markets to predict market movements.
2. Why is InterMarket Analysis important?
It provides a comprehensive view of market behavior, helping traders identify trends and potential turning points.
3. How can InterMarket Analysis improve trading strategies?
It enhances market understanding, allowing for more informed trading decisions and better risk management.
4. What are the key tools used in InterMarket Analysis?
Key tools include chart patterns, correlation analysis, and technical indicators like moving averages and RSI.
5. What are the challenges of InterMarket Analysis?
The main challenges are its complexity and the need for accurate data interpretation.
Be the first to review “InterMarket Analysis (Ed.2004) with John J.Murphy”
You must be logged in to post a review.
Related products

Forex Trading
Original price was: $4,997.00.$27.00Current price is: $27.00.
Original price was: $799.00.$15.00Current price is: $15.00.

Forex Trading
Original price was: $499.00.$15.00Current price is: $15.00.
Forex Trading
Original price was: $2,000.00.$23.00Current price is: $23.00.
Forex Trading
Original price was: $1,898.00.$10.00Current price is: $10.00.
Original price was: $1,800.00.$54.00Current price is: $54.00.
Original price was: $649.00.$20.00Current price is: $20.00.

Original price was: $997.00.$13.00Current price is: $13.00.
Original price was: $497.00.$31.00Current price is: $31.00.
Forex Trading
Original price was: $850.00.$23.00Current price is: $23.00.
Forex Trading
Original price was: $799.00.$15.00Current price is: $15.00.
Forex Trading
Original price was: $125.00.$17.00Current price is: $17.00.
Original price was: $997.00.$8.00Current price is: $8.00.

Forex Trading
Original price was: $697.00.$5.00Current price is: $5.00.
Forex Trading
Original price was: $999.00.$15.00Current price is: $15.00.
Original price was: $310.00.$23.00Current price is: $23.00.
Original price was: $999.00.$5.00Current price is: $5.00.
Forex Trading
Original price was: $2,995.00.$31.00Current price is: $31.00.

Original price was: $700.00.$39.00Current price is: $39.00.

Original price was: $299.00.$8.00Current price is: $8.00.

Reviews
There are no reviews yet.