-
×
 Trader University Course
1 × $5.00
Trader University Course
1 × $5.00 -
×
 Secrets of Swiss Banking with Hoyt Barber
1 × $6.00
Secrets of Swiss Banking with Hoyt Barber
1 × $6.00 -
×
 Using Options to Buy Stocks: Build Wealth with Little Risk and No Capital - Dennis Eisen
1 × $4.00
Using Options to Buy Stocks: Build Wealth with Little Risk and No Capital - Dennis Eisen
1 × $4.00 -
×
 Toni’s Market Club with Toni Turner
1 × $6.00
Toni’s Market Club with Toni Turner
1 × $6.00 -
×
 Foreign Exchange Option Pricing: A Practitioner's Guide with Iain Clark
1 × $6.00
Foreign Exchange Option Pricing: A Practitioner's Guide with Iain Clark
1 × $6.00 -
×
 Strategy, Value and Risk - The Real Options Approach with Jamie Rogers
1 × $6.00
Strategy, Value and Risk - The Real Options Approach with Jamie Rogers
1 × $6.00 -
×
 Super CD Companion for Metastock with Martin Pring
1 × $6.00
Super CD Companion for Metastock with Martin Pring
1 × $6.00 -
×
 Elite Trend Trader with Frank Bunn
1 × $23.00
Elite Trend Trader with Frank Bunn
1 × $23.00 -
×
 Mastertrader – Mastering Swing Trading
1 × $31.00
Mastertrader – Mastering Swing Trading
1 × $31.00 -
×
 Technical Analysis Entry & Exit with Andrew Baxter
1 × $6.00
Technical Analysis Entry & Exit with Andrew Baxter
1 × $6.00 -
×
 Options Professional Online Webinar (2010-01 – 2010-02) with J.L.Lord
1 × $6.00
Options Professional Online Webinar (2010-01 – 2010-02) with J.L.Lord
1 × $6.00 -
×
 Speculating with Foreign Currencies with Liverpool Group
1 × $6.00
Speculating with Foreign Currencies with Liverpool Group
1 × $6.00 -
×
 Learn To Fish Part II - Generating Consistent Income Through Day Trading with Daniel
1 × $6.00
Learn To Fish Part II - Generating Consistent Income Through Day Trading with Daniel
1 × $6.00 -
×
 New Market Mavericks with Geoff Cutmore
1 × $6.00
New Market Mavericks with Geoff Cutmore
1 × $6.00 -
×
 High Probability Trading with Marcel Link
1 × $6.00
High Probability Trading with Marcel Link
1 × $6.00 -
×
 The Best (Public) Trading Methods I’ve Found for Futures & Equities with Perry J.Kaufman
1 × $6.00
The Best (Public) Trading Methods I’ve Found for Futures & Equities with Perry J.Kaufman
1 × $6.00 -
×
 The Complete Guide to Multiple Time Frame Analysis & Reading Price Action with Aiman Almansoori
1 × $13.00
The Complete Guide to Multiple Time Frame Analysis & Reading Price Action with Aiman Almansoori
1 × $13.00 -
×
 The Price Action Manual, 2nd Ed 2008 with Bryce Gilmore
1 × $4.00
The Price Action Manual, 2nd Ed 2008 with Bryce Gilmore
1 × $4.00 -
×
 Explosive Growth Options & Stocks with Base Camp Trading
1 × $5.00
Explosive Growth Options & Stocks with Base Camp Trading
1 × $5.00 -
×
 WYCKOFF TRADING COURSE (WTC) PART I – ANALYSIS (Fall 2021) with Roman Bogomazov
1 × $209.00
WYCKOFF TRADING COURSE (WTC) PART I – ANALYSIS (Fall 2021) with Roman Bogomazov
1 × $209.00 -
×
 Pattern, Price & Time: Using Gann Theory in Trading Systems (1st Edition) with James Hyerczyk
1 × $6.00
Pattern, Price & Time: Using Gann Theory in Trading Systems (1st Edition) with James Hyerczyk
1 × $6.00 -
×
 Advanced Spread Trading with Guy Bower - MasterClass Trader
1 × $15.00
Advanced Spread Trading with Guy Bower - MasterClass Trader
1 × $15.00 -
×
 ICT Mentorship 2016-17 with Inner Circle Trading
1 × $6.00
ICT Mentorship 2016-17 with Inner Circle Trading
1 × $6.00 -
×
 Practical Applications of Candlestick Charts with Gary Wagner
1 × $6.00
Practical Applications of Candlestick Charts with Gary Wagner
1 × $6.00 -
×
 CMT Association Entire Webinars
1 × $31.00
CMT Association Entire Webinars
1 × $31.00 -
×
 Correct Stage for Average with Stan Weinstein
1 × $6.00
Correct Stage for Average with Stan Weinstein
1 × $6.00 -
×
 Dow Theory for the 21st Century: Technical Indicators for Improving Your Investment Results with Jack Schannep
1 × $6.00
Dow Theory for the 21st Century: Technical Indicators for Improving Your Investment Results with Jack Schannep
1 × $6.00 -
×
 Market Profile Video with FutexLive
1 × $6.00
Market Profile Video with FutexLive
1 × $6.00 -
×
 The Definitive Guide To Futures Trading (Volume II) with Larry Williams
1 × $6.00
The Definitive Guide To Futures Trading (Volume II) with Larry Williams
1 × $6.00 -
×
 Developing Mindfulness: The Observer of Thought with Traders State Of Mind
1 × $6.00
Developing Mindfulness: The Observer of Thought with Traders State Of Mind
1 × $6.00 -
×
 Matrix Spread Options Trading Course with Base Camp Trading
1 × $31.00
Matrix Spread Options Trading Course with Base Camp Trading
1 × $31.00 -
×
 The Jupiter Effect with John Gribbin & Stephen Plagemann
1 × $6.00
The Jupiter Effect with John Gribbin & Stephen Plagemann
1 × $6.00 -
×
 Computerized Trading. Maximizing Day Trading and Overnight Profits with Mark Jurik
1 × $6.00
Computerized Trading. Maximizing Day Trading and Overnight Profits with Mark Jurik
1 × $6.00 -
×
 Planetary Stock Trading with Bill Meridian
1 × $6.00
Planetary Stock Trading with Bill Meridian
1 × $6.00 -
×
 The Inner Circle Seminar
1 × $15.00
The Inner Circle Seminar
1 × $15.00 -
×
 TOP Momentum Bundle with Top Trade Tools
1 × $62.00
TOP Momentum Bundle with Top Trade Tools
1 × $62.00 -
×
 Steidlmayer On Markets. Trading with Market Profile with J.Peter Steidlmayer
1 × $6.00
Steidlmayer On Markets. Trading with Market Profile with J.Peter Steidlmayer
1 × $6.00 -
×
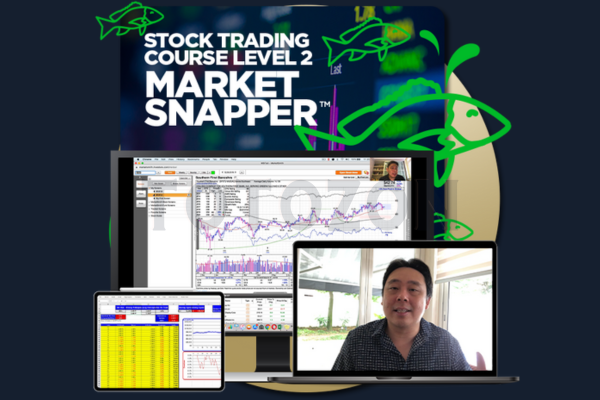 Stock Trading Course Level 2 Market Snapper™ 2019 with Piranha Profits
1 × $6.00
Stock Trading Course Level 2 Market Snapper™ 2019 with Piranha Profits
1 × $6.00 -
×
 Butterflies For Monthly Income 2016 with Dan Sheridan
1 × $15.00
Butterflies For Monthly Income 2016 with Dan Sheridan
1 × $15.00 -
×
 Perfecting Execution and Trade Management Online Masterclass with The Trading Framework
1 × $6.00
Perfecting Execution and Trade Management Online Masterclass with The Trading Framework
1 × $6.00 -
×
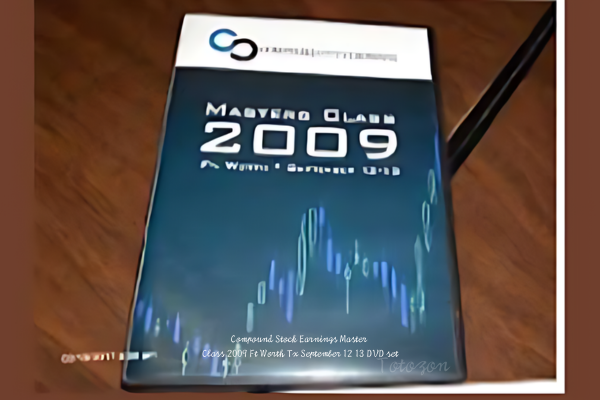 Compound Stock Earnings Master Class 2009 Ft Worth Tx September 12 13 DVD set
1 × $6.00
Compound Stock Earnings Master Class 2009 Ft Worth Tx September 12 13 DVD set
1 × $6.00 -
×
 Advanced AmiBroker Coding with Matt Radtke & Connors Research
1 × $23.00
Advanced AmiBroker Coding with Matt Radtke & Connors Research
1 × $23.00 -
×
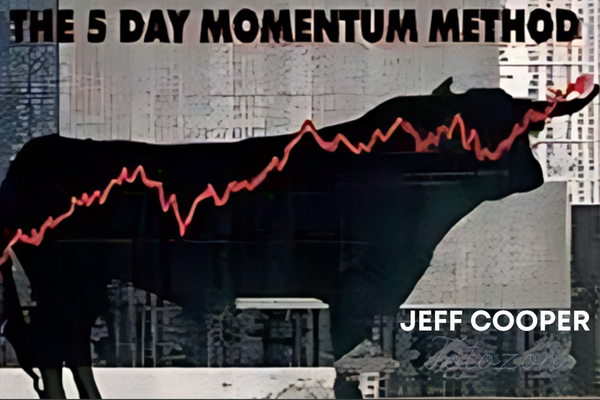 The 5 Day Momentum Method
1 × $6.00
The 5 Day Momentum Method
1 × $6.00 -
×
 Sang Lucci Master Course 2021 with Sang Lucci
1 × $6.00
Sang Lucci Master Course 2021 with Sang Lucci
1 × $6.00 -
×
 The A14 Weekly Option Strategy Workshop with Amy Meissner
1 × $23.00
The A14 Weekly Option Strategy Workshop with Amy Meissner
1 × $23.00 -
×
 Math Trading Course 2023
1 × $34.00
Math Trading Course 2023
1 × $34.00 -
×
 The Holy Grail Forex Strategy - 7 Setups To Conquer The Kingdom with Justin Whitebread-Lanaro - 1 Minute Master
1 × $15.00
The Holy Grail Forex Strategy - 7 Setups To Conquer The Kingdom with Justin Whitebread-Lanaro - 1 Minute Master
1 × $15.00 -
×
 SQX Mentorship with Tip Toe Hippo
1 × $23.00
SQX Mentorship with Tip Toe Hippo
1 × $23.00 -
×
 Boomerang Day Trader (Aug 2012)
1 × $54.00
Boomerang Day Trader (Aug 2012)
1 × $54.00 -
×
 Philadelphia Seminar Replay & PDF Study Guide with ASFX Day Trading
1 × $31.00
Philadelphia Seminar Replay & PDF Study Guide with ASFX Day Trading
1 × $31.00 -
×
 Applying Fibonacci Analysis to Price Action
1 × $6.00
Applying Fibonacci Analysis to Price Action
1 × $6.00 -
×
 Stock Trading Simplified - 3 DVD + PDF Workbook with John Person
1 × $6.00
Stock Trading Simplified - 3 DVD + PDF Workbook with John Person
1 × $6.00 -
×
 Essentials in Quantitative Trading QT01 By HangukQuant's
1 × $23.00
Essentials in Quantitative Trading QT01 By HangukQuant's
1 × $23.00
 with John J.Murphy")
InterMarket Analysis (Ed.2004) with John J.Murphy
$6.00
File Size: Coming soon!
Delivery Time: 1–12 hours
Media Type: Online Course
Content Proof: Watch Here!
You may check content proof of “InterMarket Analysis (Ed.2004) with John J.Murphy” below:
 with John J.Murphy")
InterMarket Analysis (Ed. 2004) with John J. Murphy
In the complex world of financial trading, understanding the relationships between different markets is crucial. John J. Murphy’s “InterMarket Analysis” (Ed. 2004) provides a comprehensive guide to this approach, offering traders invaluable insights into market dynamics. This article explores the key concepts, tools, and techniques from Murphy’s work, helping you leverage InterMarket Analysis for better trading decisions.
What is InterMarket Analysis?
Definition
InterMarket Analysis involves studying the correlations between different financial markets, such as stocks, bonds, commodities, and currencies. By analyzing these relationships, traders can predict market trends and make informed decisions.
Historical Context
The concept of InterMarket Analysis gained popularity in the late 20th century, with John J. Murphy being one of its foremost proponents. His 2004 edition expands on these principles, incorporating modern market dynamics.
Key Concepts in InterMarket Analysis
Market Correlations
Stocks and Bonds
Typically, stocks and bonds have an inverse relationship. When stock prices rise, bond prices often fall, indicating shifts in investor sentiment and economic conditions.
Commodities and Currencies
Commodity prices can significantly impact currency values, particularly for countries that are major exporters or importers. For instance, rising oil prices can strengthen the currencies of oil-exporting nations.
Leading and Lagging Indicators
Leading Indicators
Leading indicators, such as commodity prices and bond yields, often change direction before the broader market. They provide early signals of potential market trends.
Lagging Indicators
Lagging indicators, like stock prices, confirm trends after they have started. These indicators help validate the signals from leading indicators.
Practical Application of InterMarket Analysis
Identifying Trends
Analyzing the relationships between different markets helps identify trends that might not be apparent when looking at a single market. For example, a rise in bond yields might signal future stock market weakness.
Confirming Signals
InterMarket Analysis can confirm signals from other technical indicators. If multiple markets point in the same direction, it increases the likelihood of a valid trend.
Risk Management
Understanding market correlations helps manage risk more effectively. For example, knowing that rising interest rates typically lead to lower stock prices allows traders to adjust their portfolios accordingly.
Techniques for InterMarket Analysis
Chart Patterns
Head and Shoulders
The head and shoulders pattern, a common reversal pattern, can appear across different markets. Analyzing this pattern in related markets can provide additional confirmation of a trend reversal.
Double Tops and Bottoms
Double tops and bottoms are also reversal patterns that signal the end of a trend. Observing these patterns in multiple markets can provide stronger signals.
Correlation Analysis
Positive Correlation
A positive correlation between two markets means they move in the same direction. For example, a positive correlation between stock prices and commodity prices might indicate a strong economy.
Negative Correlation
A negative correlation means two markets move in opposite directions. The inverse relationship between stocks and bonds is a classic example of negative correlation.
Using Technical Indicators
Moving Averages
Moving averages smooth out price data to identify trends. Applying moving averages to multiple markets can highlight broader market trends.
Relative Strength Index (RSI)
The RSI measures the speed and change of price movements. Comparing RSI values across different markets can provide insights into market strength and potential reversals.
Benefits of InterMarket Analysis
Enhanced Market Understanding
InterMarket Analysis offers a deeper understanding of market dynamics, enabling traders to make more informed decisions.
Improved Trading Strategies
Considering multiple markets allows traders to develop more robust trading strategies that account for broader economic trends.
Better Risk Management
Understanding intermarket relationships helps traders anticipate market movements and manage risk more effectively.
Challenges of InterMarket Analysis
Complexity
InterMarket Analysis requires broad knowledge of multiple markets and their interactions, which can be complex and time-consuming.
Data Interpretation
Accurate data interpretation is crucial. Misinterpreting correlations or signals can lead to incorrect trading decisions.
Advanced Techniques in InterMarket Analysis
Algorithmic Trading
Algorithmic trading uses computer programs to execute trades based on predefined criteria. This approach can enhance trading efficiency and accuracy.
Leveraging Data Analytics
Big data and analytics provide deeper insights into market trends and trader behavior. Use advanced analytics tools to refine your trading strategies.
Utilizing Modern Trading Tools
Modern trading platforms offer real-time data, advanced charting capabilities, and automated trading features, making it easier to apply InterMarket Analysis.
Conclusion
John J. Murphy’s “InterMarket Analysis” (Ed. 2004) remains a crucial resource for traders seeking to understand and anticipate market movements. By analyzing the relationships between different financial markets, traders can gain valuable insights, confirm signals, and manage risk more effectively. As with any trading strategy, continuous education and adaptation to changing market conditions are essential.
 with John J.Murphy")
FAQs
1. What is InterMarket Analysis?
InterMarket Analysis studies the relationships between different financial markets to predict market movements.
2. Why is InterMarket Analysis important?
It provides a comprehensive view of market behavior, helping traders identify trends and potential turning points.
3. How can InterMarket Analysis improve trading strategies?
It enhances market understanding, allowing for more informed trading decisions and better risk management.
4. What are the key tools used in InterMarket Analysis?
Key tools include chart patterns, correlation analysis, and technical indicators like moving averages and RSI.
5. What are the challenges of InterMarket Analysis?
The main challenges are its complexity and the need for accurate data interpretation.
Be the first to review “InterMarket Analysis (Ed.2004) with John J.Murphy”
You must be logged in to post a review.
Related products

Forex Trading
Original price was: $4,997.00.$27.00Current price is: $27.00.

Forex Trading
Original price was: $239.00.$8.00Current price is: $8.00.

Original price was: $1,200.00.$23.00Current price is: $23.00.

Forex Trading
Original price was: $125.00.$17.00Current price is: $17.00.
Original price was: $895.00.$15.00Current price is: $15.00.

Original price was: $2,120.00.$15.00Current price is: $15.00.

Forex Trading
Original price was: $499.00.$15.00Current price is: $15.00.

Original price was: $700.00.$39.00Current price is: $39.00.
Forex Trading
Original price was: $2,997.00.$23.00Current price is: $23.00.

Forex Trading
Original price was: $799.00.$15.00Current price is: $15.00.

Original price was: $139.00.$23.00Current price is: $23.00.

Original price was: $1,800.00.$54.00Current price is: $54.00.

Original price was: $999.00.$5.00Current price is: $5.00.

Forex Trading
Quantamentals – The Next Great Forefront Of Trading and Investing with Trading Markets
Original price was: $1,495.00.$8.00Current price is: $8.00.

Original price was: $649.00.$20.00Current price is: $20.00.

Forex Trading
Original price was: $2,000.00.$23.00Current price is: $23.00.
Original price was: $310.00.$23.00Current price is: $23.00.

Original price was: $799.00.$15.00Current price is: $15.00.

Original price was: $4,995.00.$15.00Current price is: $15.00.

Forex Trading
Original price was: $2,995.00.$31.00Current price is: $31.00.

Reviews
There are no reviews yet.