-
×
 All About Bonds & Mutual Funds with Esme Faerber
1 × $6.00
All About Bonds & Mutual Funds with Esme Faerber
1 × $6.00 -
×
 Myths of the Free Market with Kenneth Friedman
1 × $6.00
Myths of the Free Market with Kenneth Friedman
1 × $6.00 -
×
 $20 – 52k 20 pips a day challange with Rafał Zuchowicz - TopMasterTrader
1 × $5.00
$20 – 52k 20 pips a day challange with Rafał Zuchowicz - TopMasterTrader
1 × $5.00 -
×
 Crystal Ball Pack PLUS bonus Live Trade By Pat Mitchell - Trick Trades
1 × $20.00
Crystal Ball Pack PLUS bonus Live Trade By Pat Mitchell - Trick Trades
1 × $20.00 -
×
 CFA Level 3- Examination Morning Session – Essay (2004)
1 × $6.00
CFA Level 3- Examination Morning Session – Essay (2004)
1 × $6.00 -
×
 Dynamite TNT Forex System with Clarence Chee
1 × $6.00
Dynamite TNT Forex System with Clarence Chee
1 × $6.00 -
×
 Art & Science of Trend Trading Class with Jeff Bierman
1 × $6.00
Art & Science of Trend Trading Class with Jeff Bierman
1 × $6.00 -
×
 Increasing Vertical Spread Probabilities with Technical Analysis with Doc Severson
1 × $6.00
Increasing Vertical Spread Probabilities with Technical Analysis with Doc Severson
1 × $6.00 -
×
 Trading Floor Training
1 × $6.00
Trading Floor Training
1 × $6.00 -
×
 The Sweep Show with Scott Pulcini Trader
1 × $23.00
The Sweep Show with Scott Pulcini Trader
1 × $23.00 -
×
 The Orderflow Masterclass with PrimeTrading
1 × $17.00
The Orderflow Masterclass with PrimeTrading
1 × $17.00 -
×
 7 Figures Forex Course
1 × $15.00
7 Figures Forex Course
1 × $15.00 -
×
 Advanced Strategies for Option Trading Success with James Bittman
1 × $6.00
Advanced Strategies for Option Trading Success with James Bittman
1 × $6.00 -
×
 SQX Mentorship with Tip Toe Hippo
1 × $23.00
SQX Mentorship with Tip Toe Hippo
1 × $23.00 -
×
 A Treasure House of Bayer. 32 Articles and Forecasts with George Bayer
1 × $6.00
A Treasure House of Bayer. 32 Articles and Forecasts with George Bayer
1 × $6.00 -
×
 Right Line Trading IndicatorSuite (May 2015)
1 × $31.00
Right Line Trading IndicatorSuite (May 2015)
1 × $31.00 -
×
 Generative AI for Asset Managers Workshop Recording with Ernest Chan
1 × $55.00
Generative AI for Asset Managers Workshop Recording with Ernest Chan
1 × $55.00 -
×
 How To Trade Forex Using Support & Resistance Levels with Vic Noble
1 × $6.00
How To Trade Forex Using Support & Resistance Levels with Vic Noble
1 × $6.00 -
×
 Master Strategies of Super Achievers By Steven Scott
1 × $23.00
Master Strategies of Super Achievers By Steven Scott
1 × $23.00 -
×
 Carolyn Boroden Package
1 × $15.00
Carolyn Boroden Package
1 × $15.00 -
×
 Patterns of Speculation with Bertrand M.Roehner
1 × $6.00
Patterns of Speculation with Bertrand M.Roehner
1 × $6.00 -
×
 Supply and Demand Video Course with JamesFXS
1 × $13.00
Supply and Demand Video Course with JamesFXS
1 × $13.00 -
×
 Perfect Publishing System Elite with Johnny Andrews
1 × $6.00
Perfect Publishing System Elite with Johnny Andrews
1 × $6.00 -
×
 We Fund Traders - The Whale Order
1 × $5.00
We Fund Traders - The Whale Order
1 × $5.00 -
×
 How Stocks Work with David L.Scott
1 × $6.00
How Stocks Work with David L.Scott
1 × $6.00 -
×
 Who is Afraid of Word Trade Organization with Kent Jones
1 × $6.00
Who is Afraid of Word Trade Organization with Kent Jones
1 × $6.00 -
×
 Cecil Robles Advent Forex Course & Indicators with Adventforex
1 × $6.00
Cecil Robles Advent Forex Course & Indicators with Adventforex
1 × $6.00 -
×
 FuturesTrader71 - webinar series (4 webinars)
1 × $6.00
FuturesTrader71 - webinar series (4 webinars)
1 × $6.00 -
×
 ProfileTraders - Advanced Market Profile (May 2014)
1 × $6.00
ProfileTraders - Advanced Market Profile (May 2014)
1 × $6.00 -
×
 Best of the Best: Collars with Amy Meissner & Scott Ruble
1 × $15.00
Best of the Best: Collars with Amy Meissner & Scott Ruble
1 × $15.00 -
×
 Essentials in Quantitative Trading QT01 By HangukQuant's
1 × $23.00
Essentials in Quantitative Trading QT01 By HangukQuant's
1 × $23.00 -
×
 Sea Lanes & Pipelines with Bernard D.Cole
1 × $6.00
Sea Lanes & Pipelines with Bernard D.Cole
1 × $6.00 -
×
 TradeWithChris - TWC Forex Trading Course
1 × $6.00
TradeWithChris - TWC Forex Trading Course
1 × $6.00 -
×
 ActiveBeta Indexes. Capturing Systematic Sources of Active Equity Returns (HTML) with Andrew Lo
1 × $6.00
ActiveBeta Indexes. Capturing Systematic Sources of Active Equity Returns (HTML) with Andrew Lo
1 × $6.00 -
×
 The Fundamentals of Options Trading Basis with Joseph Frey
1 × $6.00
The Fundamentals of Options Trading Basis with Joseph Frey
1 × $6.00 -
×
 Deep Dive Butterfly Trading Strategy Class with SJG Trades
1 × $41.00
Deep Dive Butterfly Trading Strategy Class with SJG Trades
1 × $41.00 -
×
 Scalp Strategy and Flipping Small Accounts with Opes Trading Group
1 × $5.00
Scalp Strategy and Flipping Small Accounts with Opes Trading Group
1 × $5.00 -
×
 Sun Tzu and the Art of War for Traders with Dean Lundell
1 × $6.00
Sun Tzu and the Art of War for Traders with Dean Lundell
1 × $6.00 -
×
 Pristine Seminar - Options Trading the Pristine Way
1 × $6.00
Pristine Seminar - Options Trading the Pristine Way
1 × $6.00 -
×
 Timing Solution Terra Incognita Edition Build 24 (timingsolution.com)
1 × $6.00
Timing Solution Terra Incognita Edition Build 24 (timingsolution.com)
1 × $6.00 -
×
 The Random Character of Interest Rates with Joseph Murphy
1 × $6.00
The Random Character of Interest Rates with Joseph Murphy
1 × $6.00 -
×
 Futures Trading Secrets Home Study Course 2004 with Bill McCready
1 × $7.00
Futures Trading Secrets Home Study Course 2004 with Bill McCready
1 × $7.00 -
×
 Tradingmarkets - Introduction to AmiBroker Programming
1 × $15.00
Tradingmarkets - Introduction to AmiBroker Programming
1 × $15.00 -
×
 How to avoid the GAP
1 × $6.00
How to avoid the GAP
1 × $6.00 -
×
 Foundation of Successful Trading - 2 DVDs and Bonus Gann Time Factor 2 DVDs
1 × $31.00
Foundation of Successful Trading - 2 DVDs and Bonus Gann Time Factor 2 DVDs
1 × $31.00 -
×
 Algo Trading Masterclass with Ali Casey - StatOasis
1 × $23.00
Algo Trading Masterclass with Ali Casey - StatOasis
1 × $23.00 -
×
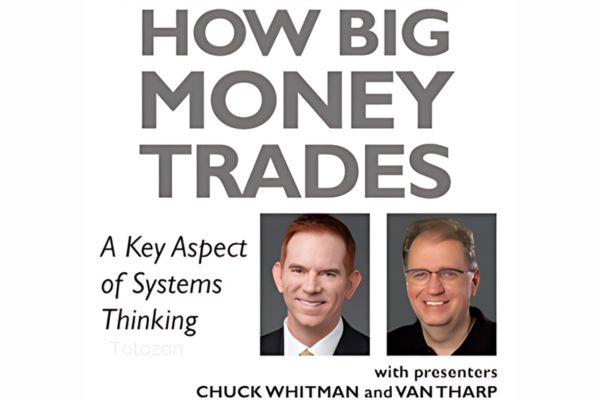 How Big Money Trades A Key Aspect of Systems Thinking - Van Tharp and Chuck Whitman – Van Tharp
1 × $46.00
How Big Money Trades A Key Aspect of Systems Thinking - Van Tharp and Chuck Whitman – Van Tharp
1 × $46.00 -
×
 Technical Analysis 101: A Comprehensive Guide to Becoming a Better Trader Class with Jeff Bierman
1 × $6.00
Technical Analysis 101: A Comprehensive Guide to Becoming a Better Trader Class with Jeff Bierman
1 × $6.00 -
×
 Forex Made Easy: 6 Ways to Trade the Dollar with James Dicks
1 × $6.00
Forex Made Easy: 6 Ways to Trade the Dollar with James Dicks
1 × $6.00 -
×
 All Weather Butterfly Program - A Deep Dive With Dan Sheridan
1 × $31.00
All Weather Butterfly Program - A Deep Dive With Dan Sheridan
1 × $31.00 -
×
 European Members - March 2023 with Stockbee
1 × $5.00
European Members - March 2023 with Stockbee
1 × $5.00 -
×
 The Box Strategy with Blue Capital Academy
1 × $23.00
The Box Strategy with Blue Capital Academy
1 × $23.00 -
×
 Power Price Action Trading - 8 Weeks Online Training
1 × $6.00
Power Price Action Trading - 8 Weeks Online Training
1 × $6.00 -
×
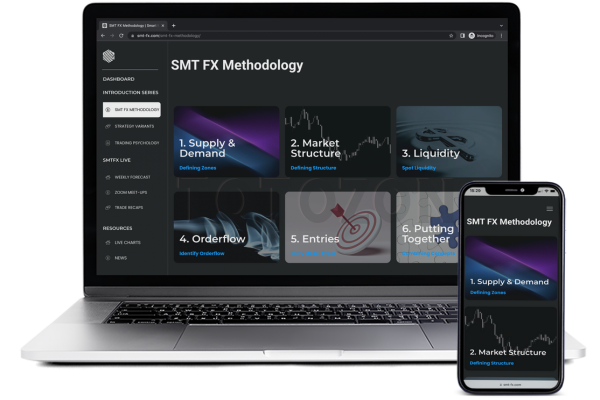 SMT FX Trading
1 × $5.00
SMT FX Trading
1 × $5.00 -
×
 How To Flip All Those “Hard To Flip” Deals
1 × $6.00
How To Flip All Those “Hard To Flip” Deals
1 × $6.00 -
×
 Profits In PJs - Profitably Selling Stock Options for Passive Income with Cam Tucker
1 × $6.00
Profits In PJs - Profitably Selling Stock Options for Passive Income with Cam Tucker
1 × $6.00 -
×
 Stupid Trader – Play Safe!
1 × $6.00
Stupid Trader – Play Safe!
1 × $6.00 -
×
 Live Online Masterclass with XSPY Trader
1 × $5.00
Live Online Masterclass with XSPY Trader
1 × $5.00 -
×
 Home Run Options Trading Course with Dave Aquino - Base Camp Trading
1 × $11.00
Home Run Options Trading Course with Dave Aquino - Base Camp Trading
1 × $11.00 -
×
 Ron Wagner - Creating a Profitable Trading & Investing Plan + Techniques to Perfect Your Intraday GAP
1 × $6.00
Ron Wagner - Creating a Profitable Trading & Investing Plan + Techniques to Perfect Your Intraday GAP
1 × $6.00 -
×
 Technical Analysis for Short-Term Traders
1 × $6.00
Technical Analysis for Short-Term Traders
1 × $6.00 -
×
 Day Trading and Swing Trading Futures with Price Action by Humberto Malaspina
1 × $5.00
Day Trading and Swing Trading Futures with Price Action by Humberto Malaspina
1 × $5.00 -
×
 WondaFX Signature Strategy with WondaFX
1 × $5.00
WondaFX Signature Strategy with WondaFX
1 × $5.00
 with John J.Murphy")
InterMarket Analysis (Ed.2004) with John J.Murphy
$6.00
File Size: Coming soon!
Delivery Time: 1–12 hours
Media Type: Online Course
Content Proof: Watch Here!
You may check content proof of “InterMarket Analysis (Ed.2004) with John J.Murphy” below:
 with John J.Murphy")
InterMarket Analysis (Ed. 2004) with John J. Murphy
In the complex world of financial trading, understanding the relationships between different markets is crucial. John J. Murphy’s “InterMarket Analysis” (Ed. 2004) provides a comprehensive guide to this approach, offering traders invaluable insights into market dynamics. This article explores the key concepts, tools, and techniques from Murphy’s work, helping you leverage InterMarket Analysis for better trading decisions.
What is InterMarket Analysis?
Definition
InterMarket Analysis involves studying the correlations between different financial markets, such as stocks, bonds, commodities, and currencies. By analyzing these relationships, traders can predict market trends and make informed decisions.
Historical Context
The concept of InterMarket Analysis gained popularity in the late 20th century, with John J. Murphy being one of its foremost proponents. His 2004 edition expands on these principles, incorporating modern market dynamics.
Key Concepts in InterMarket Analysis
Market Correlations
Stocks and Bonds
Typically, stocks and bonds have an inverse relationship. When stock prices rise, bond prices often fall, indicating shifts in investor sentiment and economic conditions.
Commodities and Currencies
Commodity prices can significantly impact currency values, particularly for countries that are major exporters or importers. For instance, rising oil prices can strengthen the currencies of oil-exporting nations.
Leading and Lagging Indicators
Leading Indicators
Leading indicators, such as commodity prices and bond yields, often change direction before the broader market. They provide early signals of potential market trends.
Lagging Indicators
Lagging indicators, like stock prices, confirm trends after they have started. These indicators help validate the signals from leading indicators.
Practical Application of InterMarket Analysis
Identifying Trends
Analyzing the relationships between different markets helps identify trends that might not be apparent when looking at a single market. For example, a rise in bond yields might signal future stock market weakness.
Confirming Signals
InterMarket Analysis can confirm signals from other technical indicators. If multiple markets point in the same direction, it increases the likelihood of a valid trend.
Risk Management
Understanding market correlations helps manage risk more effectively. For example, knowing that rising interest rates typically lead to lower stock prices allows traders to adjust their portfolios accordingly.
Techniques for InterMarket Analysis
Chart Patterns
Head and Shoulders
The head and shoulders pattern, a common reversal pattern, can appear across different markets. Analyzing this pattern in related markets can provide additional confirmation of a trend reversal.
Double Tops and Bottoms
Double tops and bottoms are also reversal patterns that signal the end of a trend. Observing these patterns in multiple markets can provide stronger signals.
Correlation Analysis
Positive Correlation
A positive correlation between two markets means they move in the same direction. For example, a positive correlation between stock prices and commodity prices might indicate a strong economy.
Negative Correlation
A negative correlation means two markets move in opposite directions. The inverse relationship between stocks and bonds is a classic example of negative correlation.
Using Technical Indicators
Moving Averages
Moving averages smooth out price data to identify trends. Applying moving averages to multiple markets can highlight broader market trends.
Relative Strength Index (RSI)
The RSI measures the speed and change of price movements. Comparing RSI values across different markets can provide insights into market strength and potential reversals.
Benefits of InterMarket Analysis
Enhanced Market Understanding
InterMarket Analysis offers a deeper understanding of market dynamics, enabling traders to make more informed decisions.
Improved Trading Strategies
Considering multiple markets allows traders to develop more robust trading strategies that account for broader economic trends.
Better Risk Management
Understanding intermarket relationships helps traders anticipate market movements and manage risk more effectively.
Challenges of InterMarket Analysis
Complexity
InterMarket Analysis requires broad knowledge of multiple markets and their interactions, which can be complex and time-consuming.
Data Interpretation
Accurate data interpretation is crucial. Misinterpreting correlations or signals can lead to incorrect trading decisions.
Advanced Techniques in InterMarket Analysis
Algorithmic Trading
Algorithmic trading uses computer programs to execute trades based on predefined criteria. This approach can enhance trading efficiency and accuracy.
Leveraging Data Analytics
Big data and analytics provide deeper insights into market trends and trader behavior. Use advanced analytics tools to refine your trading strategies.
Utilizing Modern Trading Tools
Modern trading platforms offer real-time data, advanced charting capabilities, and automated trading features, making it easier to apply InterMarket Analysis.
Conclusion
John J. Murphy’s “InterMarket Analysis” (Ed. 2004) remains a crucial resource for traders seeking to understand and anticipate market movements. By analyzing the relationships between different financial markets, traders can gain valuable insights, confirm signals, and manage risk more effectively. As with any trading strategy, continuous education and adaptation to changing market conditions are essential.
 with John J.Murphy")
FAQs
1. What is InterMarket Analysis?
InterMarket Analysis studies the relationships between different financial markets to predict market movements.
2. Why is InterMarket Analysis important?
It provides a comprehensive view of market behavior, helping traders identify trends and potential turning points.
3. How can InterMarket Analysis improve trading strategies?
It enhances market understanding, allowing for more informed trading decisions and better risk management.
4. What are the key tools used in InterMarket Analysis?
Key tools include chart patterns, correlation analysis, and technical indicators like moving averages and RSI.
5. What are the challenges of InterMarket Analysis?
The main challenges are its complexity and the need for accurate data interpretation.
Be the first to review “InterMarket Analysis (Ed.2004) with John J.Murphy”
You must be logged in to post a review.
Related products

Forex Trading
Original price was: $499.00.$15.00Current price is: $15.00.

Original price was: $997.00.$13.00Current price is: $13.00.

Forex Trading
Original price was: $249.00.$15.00Current price is: $15.00.
Original price was: $497.00.$11.00Current price is: $11.00.
Forex Trading
Original price was: $2,997.00.$23.00Current price is: $23.00.

Forex Trading
Original price was: $797.00.$10.00Current price is: $10.00.
Forex Trading
Original price was: $850.00.$23.00Current price is: $23.00.

Original price was: $497.00.$31.00Current price is: $31.00.
Forex Trading
Original price was: $2,000.00.$23.00Current price is: $23.00.

Forex Trading
Quantamentals – The Next Great Forefront Of Trading and Investing with Trading Markets
Original price was: $1,495.00.$8.00Current price is: $8.00.

Original price was: $1,849.00.$15.00Current price is: $15.00.

Original price was: $310.00.$23.00Current price is: $23.00.

Original price was: $139.00.$23.00Current price is: $23.00.

Original price was: $700.00.$39.00Current price is: $39.00.
Forex Trading
Original price was: $125.00.$17.00Current price is: $17.00.

Original price was: $4,995.00.$15.00Current price is: $15.00.

Forex Trading
Original price was: $4,997.00.$27.00Current price is: $27.00.

Original price was: $450.00.$23.00Current price is: $23.00.
Forex Trading
Original price was: $1,898.00.$10.00Current price is: $10.00.

Forex Trading
Original price was: $239.00.$8.00Current price is: $8.00.

Reviews
There are no reviews yet.