-
×
 New Market Mavericks with Geoff Cutmore
1 × $6.00
New Market Mavericks with Geoff Cutmore
1 × $6.00 -
×
 The Kiloby Inquiries Online with Scott Kiloby
1 × $39.00
The Kiloby Inquiries Online with Scott Kiloby
1 × $39.00 -
×
 High Probability Trading Using Elliott Wave And Fibonacci Analysis withVic Patel - Forex Training Group
1 × $10.00
High Probability Trading Using Elliott Wave And Fibonacci Analysis withVic Patel - Forex Training Group
1 × $10.00 -
×
 A Complete Beginner to Advanced Trading Mentorship Program with Habby Forex Trading Academy
1 × $5.00
A Complete Beginner to Advanced Trading Mentorship Program with Habby Forex Trading Academy
1 × $5.00 -
×
 Cash Flow Investing Course
1 × $20.00
Cash Flow Investing Course
1 × $20.00 -
×
 Peter Borish Online Trader Program
1 × $15.00
Peter Borish Online Trader Program
1 × $15.00 -
×
 Candlestick Charts with Clive Lambert
1 × $6.00
Candlestick Charts with Clive Lambert
1 × $6.00 -
×
 The Master Indicator 2023 with Lance Ippolito
1 × $101.00
The Master Indicator 2023 with Lance Ippolito
1 × $101.00 -
×
 Fierce 10 with Mandi Rafsendjani
1 × $5.00
Fierce 10 with Mandi Rafsendjani
1 × $5.00 -
×
 Connors on Advanced Trading Strategies with Larry Connors
1 × $6.00
Connors on Advanced Trading Strategies with Larry Connors
1 × $6.00 -
×
 Quantamentals - The Next Great Forefront Of Trading and Investing with Trading Markets
1 × $8.00
Quantamentals - The Next Great Forefront Of Trading and Investing with Trading Markets
1 × $8.00 -
×
 Advanced Ichimoku Kinkō Hyō - Ichimoku Cloud Strategy with Rafał Zuchowicz - TopMasterTrader
1 × $17.00
Advanced Ichimoku Kinkō Hyō - Ichimoku Cloud Strategy with Rafał Zuchowicz - TopMasterTrader
1 × $17.00 -
×
 Mutual Funds for Dummies (6th edition) with Eric Tyson
1 × $6.00
Mutual Funds for Dummies (6th edition) with Eric Tyson
1 × $6.00 -
×
 Simple Forex Profits with Rayy Bannzz
1 × $31.00
Simple Forex Profits with Rayy Bannzz
1 × $31.00 -
×
 HunterFX Video Course with HunterFX
1 × $6.00
HunterFX Video Course with HunterFX
1 × $6.00 -
×
 Forecasting Financial Markets (2nd Ed.)
1 × $6.00
Forecasting Financial Markets (2nd Ed.)
1 × $6.00 -
×
 Secrets of a Winning Trader with Gareth Soloway
1 × $871.00
Secrets of a Winning Trader with Gareth Soloway
1 × $871.00 -
×
 How to Value & Sell your Business with Andrew Heslop
1 × $6.00
How to Value & Sell your Business with Andrew Heslop
1 × $6.00 -
×
 Investment Illusions with Martin S.Fridson
1 × $6.00
Investment Illusions with Martin S.Fridson
1 × $6.00 -
×
 Weekly Diagonal Spreads for Consistent Income By Doc Severson
1 × $6.00
Weekly Diagonal Spreads for Consistent Income By Doc Severson
1 × $6.00 -
×
 Forecast 2024 Clarification with Larry Williams
1 × $15.00
Forecast 2024 Clarification with Larry Williams
1 × $15.00 -
×
 Advanced Cycles with Nick Santiago - InTheMoneyStocks
1 × $171.00
Advanced Cycles with Nick Santiago - InTheMoneyStocks
1 × $171.00 -
×
 Algohub 2023 Full Completed with Algohub
1 × $5.00
Algohub 2023 Full Completed with Algohub
1 × $5.00 -
×
 WondaFX Signature Strategy with WondaFX
1 × $5.00
WondaFX Signature Strategy with WondaFX
1 × $5.00 -
×
 Trade Like a Pro in Currency Trading with Don Schellenberg
1 × $6.00
Trade Like a Pro in Currency Trading with Don Schellenberg
1 × $6.00 -
×
 RSI Basic with Andrew Cardwell
1 × $54.00
RSI Basic with Andrew Cardwell
1 × $54.00 -
×
 Compass Trading System with Right Line Trading
1 × $39.00
Compass Trading System with Right Line Trading
1 × $39.00 -
×
 Profitable Strategies with Gemify Academy
1 × $10.00
Profitable Strategies with Gemify Academy
1 × $10.00 -
×
 Foreign Exchange
1 × $6.00
Foreign Exchange
1 × $6.00 -
×
 Traders Classroom Collection Volume 1-4 with Jeffrey Kennedy
1 × $15.00
Traders Classroom Collection Volume 1-4 with Jeffrey Kennedy
1 × $15.00 -
×
 Candlestick Charting Explained with Greg Morris
1 × $8.00
Candlestick Charting Explained with Greg Morris
1 × $8.00 -
×
 AllStreet Investing - Master the Market LEVEL 2 - DAYTRADING
1 × $23.00
AllStreet Investing - Master the Market LEVEL 2 - DAYTRADING
1 × $23.00 -
×
 The Indices Orderflow Masterclass with The Forex Scalpers
1 × $23.00
The Indices Orderflow Masterclass with The Forex Scalpers
1 × $23.00 -
×
 The Apple Way with Jeffrey Cruikshank
1 × $6.00
The Apple Way with Jeffrey Cruikshank
1 × $6.00 -
×
 Larry Williams Newsletters (1994-1997)
1 × $6.00
Larry Williams Newsletters (1994-1997)
1 × $6.00 -
×
 Candlestick and Pivot Point Trading Triggers with John Person
1 × $6.00
Candlestick and Pivot Point Trading Triggers with John Person
1 × $6.00 -
×
 ALGO™ Online Retail - Version 2.9
1 × $155.00
ALGO™ Online Retail - Version 2.9
1 × $155.00 -
×
 How To Read The Trend (Recorded Session) with TradeSmart
1 × $31.00
How To Read The Trend (Recorded Session) with TradeSmart
1 × $31.00 -
×
 Stock Trading Wizard
1 × $6.00
Stock Trading Wizard
1 × $6.00 -
×
 Investment Fables with Aswath Damodaran
1 × $6.00
Investment Fables with Aswath Damodaran
1 × $6.00 -
×
 LARGE CAP MOMENTUM STRATEGY with Nick Radge
1 × $179.00
LARGE CAP MOMENTUM STRATEGY with Nick Radge
1 × $179.00 -
×
 Outsmarting Wall Street (3rd Ed) with Daniel Alan Seiver
1 × $6.00
Outsmarting Wall Street (3rd Ed) with Daniel Alan Seiver
1 × $6.00 -
×
 Master Forex Fundamentals
1 × $15.00
Master Forex Fundamentals
1 × $15.00 -
×
 Precision Timing Your Options Trades Using Fibonacci with Trading Analysis
1 × $15.00
Precision Timing Your Options Trades Using Fibonacci with Trading Analysis
1 × $15.00 -
×
 ICT Prodigy Trading Course – $650K in Payouts with Alex Solignani
1 × $15.00
ICT Prodigy Trading Course – $650K in Payouts with Alex Solignani
1 × $15.00 -
×
 Evolution Course with Kevin Trades
1 × $15.00
Evolution Course with Kevin Trades
1 × $15.00 -
×
 YTC Price Action Trader
1 × $6.00
YTC Price Action Trader
1 × $6.00 -
×
 The Naked Eye: Raw Data Analytics with Edgar Torres - Raw Data Analytics
1 × $8.00
The Naked Eye: Raw Data Analytics with Edgar Torres - Raw Data Analytics
1 × $8.00 -
×
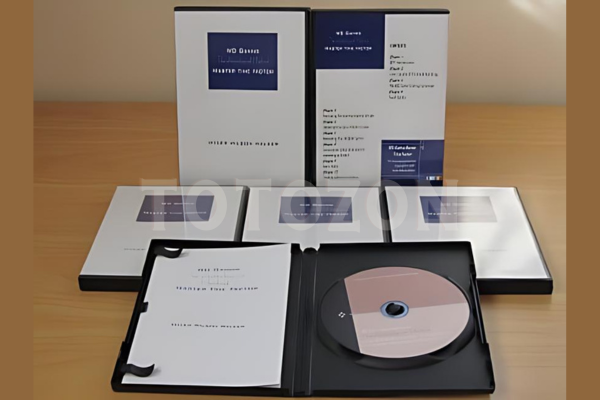 WD Gann’s Master Time Factor DVD With Miles Wilson Walker
1 × $6.00
WD Gann’s Master Time Factor DVD With Miles Wilson Walker
1 × $6.00 -
×
 Cycle Hunter Books 1-3 with Brian James Sklenka
1 × $6.00
Cycle Hunter Books 1-3 with Brian James Sklenka
1 × $6.00 -
×
 Crystal Ball Pack PLUS bonus Live Trade By Pat Mitchell - Trick Trades
1 × $20.00
Crystal Ball Pack PLUS bonus Live Trade By Pat Mitchell - Trick Trades
1 × $20.00 -
×
 Swift Trader, Perfecting the Art of DayTrading with Charles Kim
1 × $6.00
Swift Trader, Perfecting the Art of DayTrading with Charles Kim
1 × $6.00 -
×
 A Day In The Life Of A Forex Trader with Vic Noble & Shirley Hudson
1 × $23.00
A Day In The Life Of A Forex Trader with Vic Noble & Shirley Hudson
1 × $23.00 -
×
 Crypto Trading Academy with Cheeky Investor - Aussie Day Trader
1 × $13.00
Crypto Trading Academy with Cheeky Investor - Aussie Day Trader
1 × $13.00 -
×
 Power Index Method for Profitable Futures Trading with Harold Goldberg
1 × $6.00
Power Index Method for Profitable Futures Trading with Harold Goldberg
1 × $6.00 -
×
 Capital Asset Investment with Anthony F.Herbst
1 × $6.00
Capital Asset Investment with Anthony F.Herbst
1 × $6.00 -
×
 Advanced Strategies in Forex Trading with Don Schellenberg
1 × $6.00
Advanced Strategies in Forex Trading with Don Schellenberg
1 × $6.00 -
×
 How I Trade the QQQs with Don Miller
1 × $6.00
How I Trade the QQQs with Don Miller
1 × $6.00 -
×
 Trading Aplications of Japanese Candlestick Charting with Gary S.Wagner & Bradley L.Matheny
1 × $6.00
Trading Aplications of Japanese Candlestick Charting with Gary S.Wagner & Bradley L.Matheny
1 × $6.00 -
×
 Options 201: Vertical and Calendar Spread Essentials 5 Part Class with Don Kaufman On Demand Replay
1 × $6.00
Options 201: Vertical and Calendar Spread Essentials 5 Part Class with Don Kaufman On Demand Replay
1 × $6.00 -
×
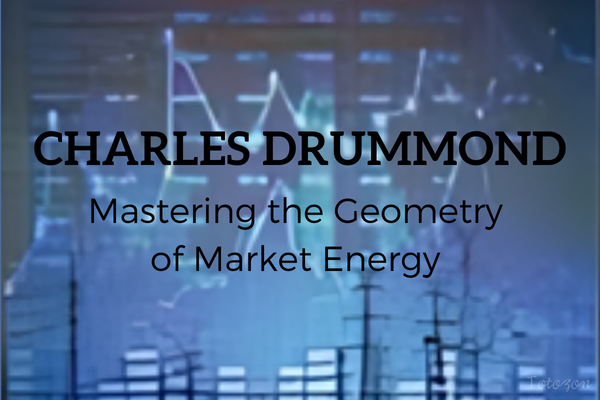 Mastering the Geometry of Market Energy with Charles Drummond
1 × $6.00
Mastering the Geometry of Market Energy with Charles Drummond
1 × $6.00 -
×
 The Prop Trading Code with Brannigan Barrett - Axia Futures
1 × $23.00
The Prop Trading Code with Brannigan Barrett - Axia Futures
1 × $23.00 -
×
 Algo Trading Strategies 2017 with Autotrading Academy
1 × $6.00
Algo Trading Strategies 2017 with Autotrading Academy
1 × $6.00 -
×
 Algo Trading Masterclass with Ali Casey - StatOasis
1 × $23.00
Algo Trading Masterclass with Ali Casey - StatOasis
1 × $23.00
 with John J.Murphy")
InterMarket Analysis (Ed.2004) with John J.Murphy
$6.00
File Size: Coming soon!
Delivery Time: 1–12 hours
Media Type: Online Course
Content Proof: Watch Here!
You may check content proof of “InterMarket Analysis (Ed.2004) with John J.Murphy” below:
 with John J.Murphy")
InterMarket Analysis (Ed. 2004) with John J. Murphy
In the complex world of financial trading, understanding the relationships between different markets is crucial. John J. Murphy’s “InterMarket Analysis” (Ed. 2004) provides a comprehensive guide to this approach, offering traders invaluable insights into market dynamics. This article explores the key concepts, tools, and techniques from Murphy’s work, helping you leverage InterMarket Analysis for better trading decisions.
What is InterMarket Analysis?
Definition
InterMarket Analysis involves studying the correlations between different financial markets, such as stocks, bonds, commodities, and currencies. By analyzing these relationships, traders can predict market trends and make informed decisions.
Historical Context
The concept of InterMarket Analysis gained popularity in the late 20th century, with John J. Murphy being one of its foremost proponents. His 2004 edition expands on these principles, incorporating modern market dynamics.
Key Concepts in InterMarket Analysis
Market Correlations
Stocks and Bonds
Typically, stocks and bonds have an inverse relationship. When stock prices rise, bond prices often fall, indicating shifts in investor sentiment and economic conditions.
Commodities and Currencies
Commodity prices can significantly impact currency values, particularly for countries that are major exporters or importers. For instance, rising oil prices can strengthen the currencies of oil-exporting nations.
Leading and Lagging Indicators
Leading Indicators
Leading indicators, such as commodity prices and bond yields, often change direction before the broader market. They provide early signals of potential market trends.
Lagging Indicators
Lagging indicators, like stock prices, confirm trends after they have started. These indicators help validate the signals from leading indicators.
Practical Application of InterMarket Analysis
Identifying Trends
Analyzing the relationships between different markets helps identify trends that might not be apparent when looking at a single market. For example, a rise in bond yields might signal future stock market weakness.
Confirming Signals
InterMarket Analysis can confirm signals from other technical indicators. If multiple markets point in the same direction, it increases the likelihood of a valid trend.
Risk Management
Understanding market correlations helps manage risk more effectively. For example, knowing that rising interest rates typically lead to lower stock prices allows traders to adjust their portfolios accordingly.
Techniques for InterMarket Analysis
Chart Patterns
Head and Shoulders
The head and shoulders pattern, a common reversal pattern, can appear across different markets. Analyzing this pattern in related markets can provide additional confirmation of a trend reversal.
Double Tops and Bottoms
Double tops and bottoms are also reversal patterns that signal the end of a trend. Observing these patterns in multiple markets can provide stronger signals.
Correlation Analysis
Positive Correlation
A positive correlation between two markets means they move in the same direction. For example, a positive correlation between stock prices and commodity prices might indicate a strong economy.
Negative Correlation
A negative correlation means two markets move in opposite directions. The inverse relationship between stocks and bonds is a classic example of negative correlation.
Using Technical Indicators
Moving Averages
Moving averages smooth out price data to identify trends. Applying moving averages to multiple markets can highlight broader market trends.
Relative Strength Index (RSI)
The RSI measures the speed and change of price movements. Comparing RSI values across different markets can provide insights into market strength and potential reversals.
Benefits of InterMarket Analysis
Enhanced Market Understanding
InterMarket Analysis offers a deeper understanding of market dynamics, enabling traders to make more informed decisions.
Improved Trading Strategies
Considering multiple markets allows traders to develop more robust trading strategies that account for broader economic trends.
Better Risk Management
Understanding intermarket relationships helps traders anticipate market movements and manage risk more effectively.
Challenges of InterMarket Analysis
Complexity
InterMarket Analysis requires broad knowledge of multiple markets and their interactions, which can be complex and time-consuming.
Data Interpretation
Accurate data interpretation is crucial. Misinterpreting correlations or signals can lead to incorrect trading decisions.
Advanced Techniques in InterMarket Analysis
Algorithmic Trading
Algorithmic trading uses computer programs to execute trades based on predefined criteria. This approach can enhance trading efficiency and accuracy.
Leveraging Data Analytics
Big data and analytics provide deeper insights into market trends and trader behavior. Use advanced analytics tools to refine your trading strategies.
Utilizing Modern Trading Tools
Modern trading platforms offer real-time data, advanced charting capabilities, and automated trading features, making it easier to apply InterMarket Analysis.
Conclusion
John J. Murphy’s “InterMarket Analysis” (Ed. 2004) remains a crucial resource for traders seeking to understand and anticipate market movements. By analyzing the relationships between different financial markets, traders can gain valuable insights, confirm signals, and manage risk more effectively. As with any trading strategy, continuous education and adaptation to changing market conditions are essential.
 with John J.Murphy")
FAQs
1. What is InterMarket Analysis?
InterMarket Analysis studies the relationships between different financial markets to predict market movements.
2. Why is InterMarket Analysis important?
It provides a comprehensive view of market behavior, helping traders identify trends and potential turning points.
3. How can InterMarket Analysis improve trading strategies?
It enhances market understanding, allowing for more informed trading decisions and better risk management.
4. What are the key tools used in InterMarket Analysis?
Key tools include chart patterns, correlation analysis, and technical indicators like moving averages and RSI.
5. What are the challenges of InterMarket Analysis?
The main challenges are its complexity and the need for accurate data interpretation.
Be the first to review “InterMarket Analysis (Ed.2004) with John J.Murphy”
You must be logged in to post a review.
Related products
Forex Trading
Quantamentals – The Next Great Forefront Of Trading and Investing with Trading Markets
Original price was: $1,495.00.$8.00Current price is: $8.00.

Original price was: $695.00.$41.00Current price is: $41.00.
Forex Trading
Original price was: $797.00.$10.00Current price is: $10.00.

Original price was: $895.00.$15.00Current price is: $15.00.
Original price was: $1,200.00.$23.00Current price is: $23.00.

Original price was: $700.00.$39.00Current price is: $39.00.
Original price was: $2,120.00.$15.00Current price is: $15.00.

Forex Trading
Original price was: $125.00.$17.00Current price is: $17.00.
Original price was: $450.00.$23.00Current price is: $23.00.

Original price was: $497.00.$11.00Current price is: $11.00.

Original price was: $497.00.$31.00Current price is: $31.00.

Original price was: $799.00.$15.00Current price is: $15.00.

Forex Trading
Original price was: $500.00.$5.00Current price is: $5.00.

Original price was: $4,995.00.$15.00Current price is: $15.00.

Original price was: $999.00.$5.00Current price is: $5.00.
Original price was: $649.00.$20.00Current price is: $20.00.

Original price was: $139.00.$23.00Current price is: $23.00.

Forex Trading
Original price was: $2,995.00.$31.00Current price is: $31.00.
Forex Trading
Original price was: $2,000.00.$23.00Current price is: $23.00.

Original price was: $299.00.$8.00Current price is: $8.00.

Reviews
There are no reviews yet.