-
×
 Investment Blunders with John Nofsinger
1 × $6.00
Investment Blunders with John Nofsinger
1 × $6.00 -
×
 Fibonacci Mastery Course: Complete Guide to Trading with Fib By Todd Gordon
1 × $62.00
Fibonacci Mastery Course: Complete Guide to Trading with Fib By Todd Gordon
1 × $62.00 -
×
 Fractal Markets SFX with Tyson Bieniek
1 × $5.00
Fractal Markets SFX with Tyson Bieniek
1 × $5.00 -
×
 Mastering Technical Analysis with Investi Share
1 × $23.00
Mastering Technical Analysis with Investi Share
1 × $23.00 -
×
 Deep Market Analysis Volume 1 with Fractal Flow Pro
1 × $6.00
Deep Market Analysis Volume 1 with Fractal Flow Pro
1 × $6.00 -
×
 Chart Pattern Profits
1 × $6.00
Chart Pattern Profits
1 × $6.00 -
×
 Special Bootcamp with Smart Earners Academy
1 × $5.00
Special Bootcamp with Smart Earners Academy
1 × $5.00 -
×
 The Complete Guide to Multiple Time Frame Analysis & Reading Price Action with Aiman Almansoori
1 × $13.00
The Complete Guide to Multiple Time Frame Analysis & Reading Price Action with Aiman Almansoori
1 × $13.00 -
×
 MotiveWave Ultimate v5.1.3 (OFA, OFA AlgoX), (Aug 2017)
1 × $101.00
MotiveWave Ultimate v5.1.3 (OFA, OFA AlgoX), (Aug 2017)
1 × $101.00 -
×
 DApp Mastermind (Crypto DApps) – Passive Income with DApps and SMART Contracts with Jason BTO
1 × $6.00
DApp Mastermind (Crypto DApps) – Passive Income with DApps and SMART Contracts with Jason BTO
1 × $6.00 -
×
 CFA Level 1,2,3 - Study Guides 2006
1 × $6.00
CFA Level 1,2,3 - Study Guides 2006
1 × $6.00 -
×
 Advanced Elliott Wave Analysis : Complex Patterns, Intermarket Relationships, and Global Cash Flow Analysis
1 × $6.00
Advanced Elliott Wave Analysis : Complex Patterns, Intermarket Relationships, and Global Cash Flow Analysis
1 × $6.00 -
×
 Deep Dive Butterfly Trading Strategy Class with SJG Trades
1 × $41.00
Deep Dive Butterfly Trading Strategy Class with SJG Trades
1 × $41.00 -
×
 Ichimoku Cloud Trading System Class with Jeff Bierman
1 × $6.00
Ichimoku Cloud Trading System Class with Jeff Bierman
1 × $6.00 -
×
 Tick By Tick By Alphonso Esposito - TradeSmart
1 × $6.00
Tick By Tick By Alphonso Esposito - TradeSmart
1 × $6.00 -
×
 Active Trading Course Notes with Alan Hull
1 × $6.00
Active Trading Course Notes with Alan Hull
1 × $6.00 -
×
 THE ART OF ADJUSTING IN 2017
1 × $6.00
THE ART OF ADJUSTING IN 2017
1 × $6.00 -
×
 Level II Profit System with Sammy Chua
1 × $6.00
Level II Profit System with Sammy Chua
1 × $6.00 -
×
 Game Plan of a Winning Trader with Mike Podwojski & Vic Noble
1 × $6.00
Game Plan of a Winning Trader with Mike Podwojski & Vic Noble
1 × $6.00 -
×
 Spotting Solid Short-Term Opportunities
1 × $6.00
Spotting Solid Short-Term Opportunities
1 × $6.00 -
×
 SO FX Educational Course with SO FX
1 × $5.00
SO FX Educational Course with SO FX
1 × $5.00 -
×
 Stock Trading Using Planetary Time Cycles – The Gann Method Volume I,II + Gann Astro Vol III Horoscopes and Trading Methods By Michael S. Jenkins – Stock Cycles Forecast
1 × $6.00
Stock Trading Using Planetary Time Cycles – The Gann Method Volume I,II + Gann Astro Vol III Horoscopes and Trading Methods By Michael S. Jenkins – Stock Cycles Forecast
1 × $6.00 -
×
 Corruption and Reform: Lessons from America's Economic History with Edward Glaeser & Claudia Goldin
1 × $6.00
Corruption and Reform: Lessons from America's Economic History with Edward Glaeser & Claudia Goldin
1 × $6.00 -
×
 Basic Astrotech
1 × $6.00
Basic Astrotech
1 × $6.00 -
×
 MorningSwing Method with Austin Passamonte
1 × $6.00
MorningSwing Method with Austin Passamonte
1 × $6.00 -
×
 Wyckoff Analytics Courses Collection
1 × $27.00
Wyckoff Analytics Courses Collection
1 × $27.00 -
×
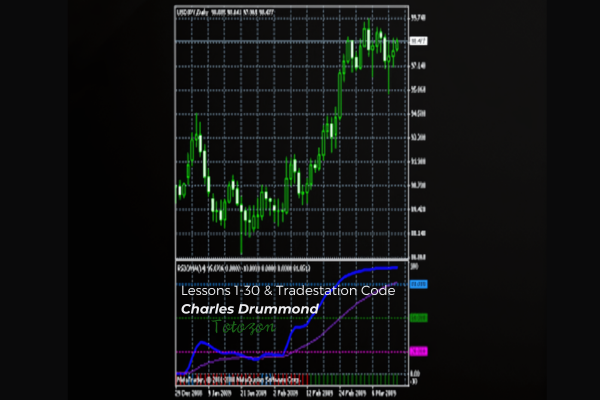 Lessons 1-30 & Tradestation Code with Charles Drummond
1 × $6.00
Lessons 1-30 & Tradestation Code with Charles Drummond
1 × $6.00 -
×
 Credit Spreads Deep Dive with Jay Bailey - Sheridan Options Mentoring
1 × $31.00
Credit Spreads Deep Dive with Jay Bailey - Sheridan Options Mentoring
1 × $31.00 -
×
 Forex Time Machine with Bill Poulos
1 × $6.00
Forex Time Machine with Bill Poulos
1 × $6.00 -
×
 Cyber Trading University - Power Trading 7 CD
1 × $8.00
Cyber Trading University - Power Trading 7 CD
1 × $8.00 -
×
 Charting the Major Forex Pairs: Focus on Major Currencies with James Bickford
1 × $6.00
Charting the Major Forex Pairs: Focus on Major Currencies with James Bickford
1 × $6.00 -
×
 Trade Like Warren Buffett with James Altucher
1 × $6.00
Trade Like Warren Buffett with James Altucher
1 × $6.00 -
×
 Evidence Based Technical Analysis with David Aronson
1 × $6.00
Evidence Based Technical Analysis with David Aronson
1 × $6.00 -
×
 Earnings Power Play with Dave Aquino
1 × $15.00
Earnings Power Play with Dave Aquino
1 × $15.00 -
×
 Forecast 2024 Clarification with Larry Williams
1 × $15.00
Forecast 2024 Clarification with Larry Williams
1 × $15.00 -
×
 PPC Lead Pro Training Program
1 × $31.00
PPC Lead Pro Training Program
1 × $31.00 -
×
 Newtonian Trading Strategy Video Course with Fractal Flow Pro
1 × $6.00
Newtonian Trading Strategy Video Course with Fractal Flow Pro
1 × $6.00 -
×
 Advanced Options Concepts - Probability, Greeks, Simulation
1 × $6.00
Advanced Options Concepts - Probability, Greeks, Simulation
1 × $6.00 -
×
 Levines Guide to Spss for Analysis of Variance with Melanie Page, Sanford Braver & David Mackinnon
1 × $6.00
Levines Guide to Spss for Analysis of Variance with Melanie Page, Sanford Braver & David Mackinnon
1 × $6.00 -
×
 Learn Plan Profit 2.0 with Ricky Gutierrez
1 × $39.00
Learn Plan Profit 2.0 with Ricky Gutierrez
1 × $39.00 -
×
 Forecast 2012 Report with Larry Williams
1 × $6.00
Forecast 2012 Report with Larry Williams
1 × $6.00 -
×
 Forex Courses Collection
1 × $55.00
Forex Courses Collection
1 × $55.00 -
×
 The Liquidity Theory of Asset Prices with Gordon Pepper & Michael Oliver
1 × $6.00
The Liquidity Theory of Asset Prices with Gordon Pepper & Michael Oliver
1 × $6.00 -
×
 The Art And Science Of Trading with Adam Grimes
1 × $6.00
The Art And Science Of Trading with Adam Grimes
1 × $6.00 -
×
 Euro Error with Jean-Jacques Rosa
1 × $6.00
Euro Error with Jean-Jacques Rosa
1 × $6.00 -
×
 VSA Advanced Mentorship Course
1 × $31.00
VSA Advanced Mentorship Course
1 × $31.00 -
×
 INVESTOPEDIA - BECOME A DAY TRADER
1 × $15.00
INVESTOPEDIA - BECOME A DAY TRADER
1 × $15.00 -
×
 AI For Traders with Trading Markets
1 × $31.00
AI For Traders with Trading Markets
1 × $31.00 -
×
 KP Trading Room w/ Paladin and JadeCapFX
1 × $5.00
KP Trading Room w/ Paladin and JadeCapFX
1 × $5.00 -
×
 Trading The Kaltbaum Seven-Step Methodology with Gary Kaltbaum
1 × $4.00
Trading The Kaltbaum Seven-Step Methodology with Gary Kaltbaum
1 × $4.00 -
×
 The Traders Battle Plan
1 × $6.00
The Traders Battle Plan
1 × $6.00 -
×
 FX Funding Mate Course
1 × $5.00
FX Funding Mate Course
1 × $5.00 -
×
 Field of Vision Program – Digital Download
1 × $31.00
Field of Vision Program – Digital Download
1 × $31.00 -
×
 Micro Bull Run Mentorship Program (Autumn 2023) with Brendan Viehman
1 × $23.00
Micro Bull Run Mentorship Program (Autumn 2023) with Brendan Viehman
1 × $23.00 -
×
 Options Wizardry from A to Z (Video 2.80 GB) with Don Fishback
1 × $6.00
Options Wizardry from A to Z (Video 2.80 GB) with Don Fishback
1 × $6.00 -
×
 Forex Fortune Factory with Nehemiah Douglass & Cottrell Phillip
1 × $5.00
Forex Fortune Factory with Nehemiah Douglass & Cottrell Phillip
1 × $5.00 -
×
 High Probability Trading with Marcel Link
1 × $6.00
High Probability Trading with Marcel Link
1 × $6.00 -
×
 Secrets of An Electronic Futures Trader with Larry Levin
1 × $6.00
Secrets of An Electronic Futures Trader with Larry Levin
1 × $6.00 -
×
 TRADING NFX Course with Andrew NFX
1 × $5.00
TRADING NFX Course with Andrew NFX
1 × $5.00 -
×
 WondaFX Signature Strategy with WondaFX
1 × $5.00
WondaFX Signature Strategy with WondaFX
1 × $5.00 -
×
 Scalp Strategy and Flipping Small Accounts with Opes Trading Group
1 × $5.00
Scalp Strategy and Flipping Small Accounts with Opes Trading Group
1 × $5.00
 with John J.Murphy")
InterMarket Analysis (Ed.2004) with John J.Murphy
$6.00
File Size: Coming soon!
Delivery Time: 1–12 hours
Media Type: Online Course
Content Proof: Watch Here!
You may check content proof of “InterMarket Analysis (Ed.2004) with John J.Murphy” below:
 with John J.Murphy")
InterMarket Analysis (Ed. 2004) with John J. Murphy
In the complex world of financial trading, understanding the relationships between different markets is crucial. John J. Murphy’s “InterMarket Analysis” (Ed. 2004) provides a comprehensive guide to this approach, offering traders invaluable insights into market dynamics. This article explores the key concepts, tools, and techniques from Murphy’s work, helping you leverage InterMarket Analysis for better trading decisions.
What is InterMarket Analysis?
Definition
InterMarket Analysis involves studying the correlations between different financial markets, such as stocks, bonds, commodities, and currencies. By analyzing these relationships, traders can predict market trends and make informed decisions.
Historical Context
The concept of InterMarket Analysis gained popularity in the late 20th century, with John J. Murphy being one of its foremost proponents. His 2004 edition expands on these principles, incorporating modern market dynamics.
Key Concepts in InterMarket Analysis
Market Correlations
Stocks and Bonds
Typically, stocks and bonds have an inverse relationship. When stock prices rise, bond prices often fall, indicating shifts in investor sentiment and economic conditions.
Commodities and Currencies
Commodity prices can significantly impact currency values, particularly for countries that are major exporters or importers. For instance, rising oil prices can strengthen the currencies of oil-exporting nations.
Leading and Lagging Indicators
Leading Indicators
Leading indicators, such as commodity prices and bond yields, often change direction before the broader market. They provide early signals of potential market trends.
Lagging Indicators
Lagging indicators, like stock prices, confirm trends after they have started. These indicators help validate the signals from leading indicators.
Practical Application of InterMarket Analysis
Identifying Trends
Analyzing the relationships between different markets helps identify trends that might not be apparent when looking at a single market. For example, a rise in bond yields might signal future stock market weakness.
Confirming Signals
InterMarket Analysis can confirm signals from other technical indicators. If multiple markets point in the same direction, it increases the likelihood of a valid trend.
Risk Management
Understanding market correlations helps manage risk more effectively. For example, knowing that rising interest rates typically lead to lower stock prices allows traders to adjust their portfolios accordingly.
Techniques for InterMarket Analysis
Chart Patterns
Head and Shoulders
The head and shoulders pattern, a common reversal pattern, can appear across different markets. Analyzing this pattern in related markets can provide additional confirmation of a trend reversal.
Double Tops and Bottoms
Double tops and bottoms are also reversal patterns that signal the end of a trend. Observing these patterns in multiple markets can provide stronger signals.
Correlation Analysis
Positive Correlation
A positive correlation between two markets means they move in the same direction. For example, a positive correlation between stock prices and commodity prices might indicate a strong economy.
Negative Correlation
A negative correlation means two markets move in opposite directions. The inverse relationship between stocks and bonds is a classic example of negative correlation.
Using Technical Indicators
Moving Averages
Moving averages smooth out price data to identify trends. Applying moving averages to multiple markets can highlight broader market trends.
Relative Strength Index (RSI)
The RSI measures the speed and change of price movements. Comparing RSI values across different markets can provide insights into market strength and potential reversals.
Benefits of InterMarket Analysis
Enhanced Market Understanding
InterMarket Analysis offers a deeper understanding of market dynamics, enabling traders to make more informed decisions.
Improved Trading Strategies
Considering multiple markets allows traders to develop more robust trading strategies that account for broader economic trends.
Better Risk Management
Understanding intermarket relationships helps traders anticipate market movements and manage risk more effectively.
Challenges of InterMarket Analysis
Complexity
InterMarket Analysis requires broad knowledge of multiple markets and their interactions, which can be complex and time-consuming.
Data Interpretation
Accurate data interpretation is crucial. Misinterpreting correlations or signals can lead to incorrect trading decisions.
Advanced Techniques in InterMarket Analysis
Algorithmic Trading
Algorithmic trading uses computer programs to execute trades based on predefined criteria. This approach can enhance trading efficiency and accuracy.
Leveraging Data Analytics
Big data and analytics provide deeper insights into market trends and trader behavior. Use advanced analytics tools to refine your trading strategies.
Utilizing Modern Trading Tools
Modern trading platforms offer real-time data, advanced charting capabilities, and automated trading features, making it easier to apply InterMarket Analysis.
Conclusion
John J. Murphy’s “InterMarket Analysis” (Ed. 2004) remains a crucial resource for traders seeking to understand and anticipate market movements. By analyzing the relationships between different financial markets, traders can gain valuable insights, confirm signals, and manage risk more effectively. As with any trading strategy, continuous education and adaptation to changing market conditions are essential.
 with John J.Murphy")
FAQs
1. What is InterMarket Analysis?
InterMarket Analysis studies the relationships between different financial markets to predict market movements.
2. Why is InterMarket Analysis important?
It provides a comprehensive view of market behavior, helping traders identify trends and potential turning points.
3. How can InterMarket Analysis improve trading strategies?
It enhances market understanding, allowing for more informed trading decisions and better risk management.
4. What are the key tools used in InterMarket Analysis?
Key tools include chart patterns, correlation analysis, and technical indicators like moving averages and RSI.
5. What are the challenges of InterMarket Analysis?
The main challenges are its complexity and the need for accurate data interpretation.
Be the first to review “InterMarket Analysis (Ed.2004) with John J.Murphy”
You must be logged in to post a review.
Related products

Forex Trading
Original price was: $4,997.00.$27.00Current price is: $27.00.

Forex Trading
Original price was: $125.00.$17.00Current price is: $17.00.

Forex Trading
Original price was: $850.00.$23.00Current price is: $23.00.
Forex Trading
Original price was: $249.00.$15.00Current price is: $15.00.

Forex Trading
Original price was: $697.00.$5.00Current price is: $5.00.
Original price was: $695.00.$41.00Current price is: $41.00.
Original price was: $999.00.$5.00Current price is: $5.00.

Original price was: $450.00.$23.00Current price is: $23.00.

Forex Trading
Original price was: $799.00.$15.00Current price is: $15.00.

Forex Trading
Original price was: $797.00.$10.00Current price is: $10.00.

Forex Trading
Quantamentals – The Next Great Forefront Of Trading and Investing with Trading Markets
Original price was: $1,495.00.$8.00Current price is: $8.00.
Forex Trading
Original price was: $2,995.00.$31.00Current price is: $31.00.

Original price was: $997.00.$13.00Current price is: $13.00.
Forex Trading
The Complete Guide to Multiple Time Frame Analysis & Reading Price Action with Aiman Almansoori
Original price was: $1,399.00.$13.00Current price is: $13.00.

Original price was: $1,800.00.$54.00Current price is: $54.00.

Original price was: $4,995.00.$15.00Current price is: $15.00.

Forex Trading
Original price was: $1,098.00.$39.00Current price is: $39.00.

Original price was: $799.00.$15.00Current price is: $15.00.

Original price was: $2,120.00.$15.00Current price is: $15.00.

Forex Trading
Original price was: $2,997.00.$23.00Current price is: $23.00.

Reviews
There are no reviews yet.