-
×
 Astro Gann Charting Software Wave59 V 3.6
1 × $6.00
Astro Gann Charting Software Wave59 V 3.6
1 × $6.00 -
×
 Seven Trading Systems for The S&P Futures with David Bean
1 × $6.00
Seven Trading Systems for The S&P Futures with David Bean
1 × $6.00 -
×
 A Forex System For Catching Pips All Day Long with Forex Pip Fishing
1 × $4.00
A Forex System For Catching Pips All Day Long with Forex Pip Fishing
1 × $4.00 -
×
 Matrix Spread Options Trading Course with Base Camp Trading
1 × $31.00
Matrix Spread Options Trading Course with Base Camp Trading
1 × $31.00 -
×
 WealthFRX Trading Mastery 3.0
1 × $5.00
WealthFRX Trading Mastery 3.0
1 × $5.00 -
×
 Self-Managed Trading with Stochastics By George Lane
1 × $4.00
Self-Managed Trading with Stochastics By George Lane
1 × $4.00 -
×
 The Heart Friendly Butterfly Options Trading System Four Part Video Series with Seth Freudberg
1 × $78.00
The Heart Friendly Butterfly Options Trading System Four Part Video Series with Seth Freudberg
1 × $78.00 -
×
 Big Profit Patterns Using Candlestick Signals & Gaps with Stephen W.Bigalow
1 × $6.00
Big Profit Patterns Using Candlestick Signals & Gaps with Stephen W.Bigalow
1 × $6.00 -
×
 VintagEducation - The Fast Track Forex Bootcamp
1 × $6.00
VintagEducation - The Fast Track Forex Bootcamp
1 × $6.00 -
×
 Hedges on Hedge Funds: How to Successfully Analyze and Select an Investment with James Hedges
1 × $6.00
Hedges on Hedge Funds: How to Successfully Analyze and Select an Investment with James Hedges
1 × $6.00 -
×
 The Orderflows Trade Opportunities Encyclopedia with Michael Valtos
1 × $8.00
The Orderflows Trade Opportunities Encyclopedia with Michael Valtos
1 × $8.00 -
×
 Volatility and Timing with Jay Kaeppel – The Option Trader’s Guide to Probability
1 × $6.00
Volatility and Timing with Jay Kaeppel – The Option Trader’s Guide to Probability
1 × $6.00 -
×
 Dan Sheridan Butterfly Course + Iron Condor Class Bundle Pack
1 × $23.00
Dan Sheridan Butterfly Course + Iron Condor Class Bundle Pack
1 × $23.00 -
×
 Nasdaq Scalper Complete Video Course with Vadym Graifer - RealityTrader
1 × $23.00
Nasdaq Scalper Complete Video Course with Vadym Graifer - RealityTrader
1 × $23.00 -
×
 MASTERING SWING TRADING May 2024 with Roman Bogomazov
1 × $194.00
MASTERING SWING TRADING May 2024 with Roman Bogomazov
1 × $194.00 -
×
 Ultimate Day Trading Program with Maroun4x
1 × $5.00
Ultimate Day Trading Program with Maroun4x
1 × $5.00 -
×
 Forex Trading Systems Elearning Course - Busted Breakout System with Van Tharp
1 × $6.00
Forex Trading Systems Elearning Course - Busted Breakout System with Van Tharp
1 × $6.00 -
×
 The M21 Strategy
1 × $15.00
The M21 Strategy
1 × $15.00 -
×
 Building a Better Trader with Glenn Ring
1 × $6.00
Building a Better Trader with Glenn Ring
1 × $6.00 -
×
 WondaFX Signature Strategy with WondaFX
1 × $5.00
WondaFX Signature Strategy with WondaFX
1 × $5.00 -
×
 Steidlmayer On Markets. Trading with Market Profile with J.Peter Steidlmayer
1 × $6.00
Steidlmayer On Markets. Trading with Market Profile with J.Peter Steidlmayer
1 × $6.00 -
×
 Trading by the Minute - Joe Ross
1 × $6.00
Trading by the Minute - Joe Ross
1 × $6.00 -
×
 AdjustMax
1 × $31.00
AdjustMax
1 × $31.00 -
×
 Simpler Options - Stock Trading Patterns
1 × $6.00
Simpler Options - Stock Trading Patterns
1 × $6.00 -
×
 Trading Blox Builder 4.3.2.1
1 × $31.00
Trading Blox Builder 4.3.2.1
1 × $31.00 -
×
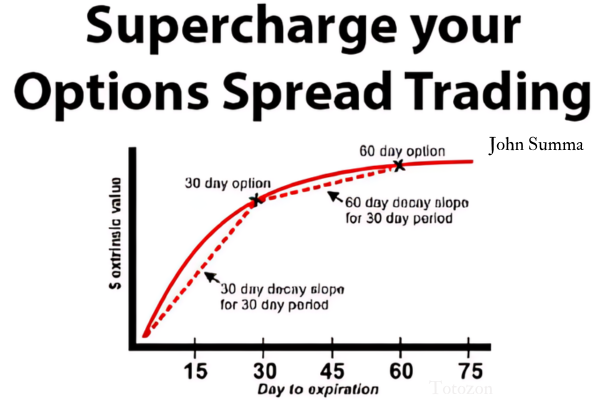 Supercharge your Options Spread Trading with John Summa
1 × $6.00
Supercharge your Options Spread Trading with John Summa
1 × $6.00 -
×
 Secret $100k Meeting with Russell Brunson
1 × $6.00
Secret $100k Meeting with Russell Brunson
1 × $6.00 -
×
 Mergers & Acquisitions From A to Z with Andrew J.Sherman
1 × $6.00
Mergers & Acquisitions From A to Z with Andrew J.Sherman
1 × $6.00 -
×
 Ultimate Trading Course with Dodgy's Dungeon
1 × $8.00
Ultimate Trading Course with Dodgy's Dungeon
1 × $8.00 -
×
 Investing Guide For New Investor with Alfred Scillitani
1 × $6.00
Investing Guide For New Investor with Alfred Scillitani
1 × $6.00 -
×
 TheVWAP with Zach Hurwitz
1 × $5.00
TheVWAP with Zach Hurwitz
1 × $5.00 -
×
 Power Combo with Random Walk Trading
1 × $15.00
Power Combo with Random Walk Trading
1 × $15.00 -
×
 The Ones That know
1 × $41.00
The Ones That know
1 × $41.00 -
×
 Pit Bull with Martin Schwartz
1 × $6.00
Pit Bull with Martin Schwartz
1 × $6.00 -
×
 D.A.T.E. Unlock Your Trading DNA Worskshop with Geoff Bysshe
1 × $6.00
D.A.T.E. Unlock Your Trading DNA Worskshop with Geoff Bysshe
1 × $6.00 -
×
 FOREX GENERATION MASTER COURSE
1 × $6.00
FOREX GENERATION MASTER COURSE
1 × $6.00 -
×
 Beginner's Guide to Ratio Butterflys Class with Don Kaufman
1 × $6.00
Beginner's Guide to Ratio Butterflys Class with Don Kaufman
1 × $6.00 -
×
 Options Mastery 32 DVDs
1 × $6.00
Options Mastery 32 DVDs
1 × $6.00 -
×
 Teresa Lo's PowerSwings EOD for eSignal (powerswings.com)
1 × $6.00
Teresa Lo's PowerSwings EOD for eSignal (powerswings.com)
1 × $6.00 -
×
 Quantifiable Edges - 3 Course Bundle
1 × $31.00
Quantifiable Edges - 3 Course Bundle
1 × $31.00 -
×
 TCG Educational Course Bundle Entries & Exits + Trading
1 × $23.00
TCG Educational Course Bundle Entries & Exits + Trading
1 × $23.00 -
×
 Redler Ultimate Access
1 × $54.00
Redler Ultimate Access
1 × $54.00 -
×
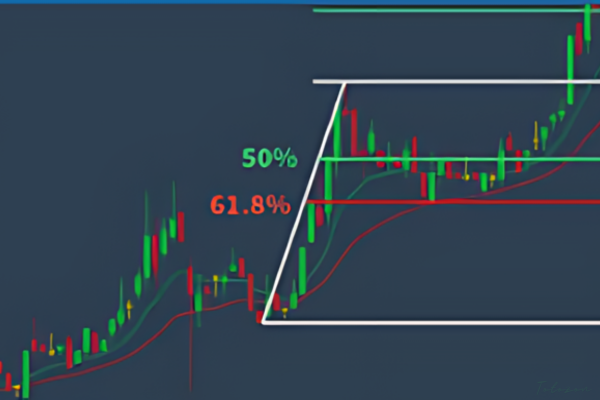 Advanced Fibonacci Course with Major League Trading
1 × $23.00
Advanced Fibonacci Course with Major League Trading
1 × $23.00 -
×
 Stock Patterns for DayTrading. Home Study Course
1 × $6.00
Stock Patterns for DayTrading. Home Study Course
1 × $6.00 -
×
 The Basics of the Wave Principle with Wayne Gorman
1 × $15.00
The Basics of the Wave Principle with Wayne Gorman
1 × $15.00 -
×
 Options Trading & Ultimate MasterClass With Tyrone Abela - FX Evolution
1 × $54.00
Options Trading & Ultimate MasterClass With Tyrone Abela - FX Evolution
1 × $54.00 -
×
 Forex Options Trading
1 × $6.00
Forex Options Trading
1 × $6.00 -
×
 Fibonacci – CCI Workshop Recording Series (2006 & 2008)
1 × $6.00
Fibonacci – CCI Workshop Recording Series (2006 & 2008)
1 × $6.00 -
×
 Catching the Bounce
1 × $6.00
Catching the Bounce
1 × $6.00 -
×
 Mastering Candlestick Charts I with Greg Capra
1 × $6.00
Mastering Candlestick Charts I with Greg Capra
1 × $6.00 -
×
 Chart Analysis Boot Camp Course Webinar with Mike Albright
1 × $6.00
Chart Analysis Boot Camp Course Webinar with Mike Albright
1 × $6.00 -
×
 Investing in Corporate Bonds and Credit Risk with Frank Hagenstein
1 × $6.00
Investing in Corporate Bonds and Credit Risk with Frank Hagenstein
1 × $6.00 -
×
 The Insured Portfolio: Your Gateway to Stress-Free Global Investments with Erika Nolan, Marc-Andre Sola & Shannon Crouch
1 × $6.00
The Insured Portfolio: Your Gateway to Stress-Free Global Investments with Erika Nolan, Marc-Andre Sola & Shannon Crouch
1 × $6.00 -
×
 Construction & Application of the MACD Indicator(video) with Gerald Appel
1 × $4.00
Construction & Application of the MACD Indicator(video) with Gerald Appel
1 × $4.00 -
×
 Trading Triggers - The Secrets to Profitable Trading with John Person
1 × $6.00
Trading Triggers - The Secrets to Profitable Trading with John Person
1 × $6.00 -
×
 The 2021 TraderLion Stock Trading Conference with Trader Lion
1 × $5.00
The 2021 TraderLion Stock Trading Conference with Trader Lion
1 × $5.00 -
×
 How To Read The Market Professionally with TradeSmart
1 × $27.00
How To Read The Market Professionally with TradeSmart
1 × $27.00
 with John J.Murphy")
InterMarket Analysis (Ed.2004) with John J.Murphy
$6.00
File Size: Coming soon!
Delivery Time: 1–12 hours
Media Type: Online Course
Content Proof: Watch Here!
You may check content proof of “InterMarket Analysis (Ed.2004) with John J.Murphy” below:
 with John J.Murphy")
InterMarket Analysis (Ed. 2004) with John J. Murphy
In the complex world of financial trading, understanding the relationships between different markets is crucial. John J. Murphy’s “InterMarket Analysis” (Ed. 2004) provides a comprehensive guide to this approach, offering traders invaluable insights into market dynamics. This article explores the key concepts, tools, and techniques from Murphy’s work, helping you leverage InterMarket Analysis for better trading decisions.
What is InterMarket Analysis?
Definition
InterMarket Analysis involves studying the correlations between different financial markets, such as stocks, bonds, commodities, and currencies. By analyzing these relationships, traders can predict market trends and make informed decisions.
Historical Context
The concept of InterMarket Analysis gained popularity in the late 20th century, with John J. Murphy being one of its foremost proponents. His 2004 edition expands on these principles, incorporating modern market dynamics.
Key Concepts in InterMarket Analysis
Market Correlations
Stocks and Bonds
Typically, stocks and bonds have an inverse relationship. When stock prices rise, bond prices often fall, indicating shifts in investor sentiment and economic conditions.
Commodities and Currencies
Commodity prices can significantly impact currency values, particularly for countries that are major exporters or importers. For instance, rising oil prices can strengthen the currencies of oil-exporting nations.
Leading and Lagging Indicators
Leading Indicators
Leading indicators, such as commodity prices and bond yields, often change direction before the broader market. They provide early signals of potential market trends.
Lagging Indicators
Lagging indicators, like stock prices, confirm trends after they have started. These indicators help validate the signals from leading indicators.
Practical Application of InterMarket Analysis
Identifying Trends
Analyzing the relationships between different markets helps identify trends that might not be apparent when looking at a single market. For example, a rise in bond yields might signal future stock market weakness.
Confirming Signals
InterMarket Analysis can confirm signals from other technical indicators. If multiple markets point in the same direction, it increases the likelihood of a valid trend.
Risk Management
Understanding market correlations helps manage risk more effectively. For example, knowing that rising interest rates typically lead to lower stock prices allows traders to adjust their portfolios accordingly.
Techniques for InterMarket Analysis
Chart Patterns
Head and Shoulders
The head and shoulders pattern, a common reversal pattern, can appear across different markets. Analyzing this pattern in related markets can provide additional confirmation of a trend reversal.
Double Tops and Bottoms
Double tops and bottoms are also reversal patterns that signal the end of a trend. Observing these patterns in multiple markets can provide stronger signals.
Correlation Analysis
Positive Correlation
A positive correlation between two markets means they move in the same direction. For example, a positive correlation between stock prices and commodity prices might indicate a strong economy.
Negative Correlation
A negative correlation means two markets move in opposite directions. The inverse relationship between stocks and bonds is a classic example of negative correlation.
Using Technical Indicators
Moving Averages
Moving averages smooth out price data to identify trends. Applying moving averages to multiple markets can highlight broader market trends.
Relative Strength Index (RSI)
The RSI measures the speed and change of price movements. Comparing RSI values across different markets can provide insights into market strength and potential reversals.
Benefits of InterMarket Analysis
Enhanced Market Understanding
InterMarket Analysis offers a deeper understanding of market dynamics, enabling traders to make more informed decisions.
Improved Trading Strategies
Considering multiple markets allows traders to develop more robust trading strategies that account for broader economic trends.
Better Risk Management
Understanding intermarket relationships helps traders anticipate market movements and manage risk more effectively.
Challenges of InterMarket Analysis
Complexity
InterMarket Analysis requires broad knowledge of multiple markets and their interactions, which can be complex and time-consuming.
Data Interpretation
Accurate data interpretation is crucial. Misinterpreting correlations or signals can lead to incorrect trading decisions.
Advanced Techniques in InterMarket Analysis
Algorithmic Trading
Algorithmic trading uses computer programs to execute trades based on predefined criteria. This approach can enhance trading efficiency and accuracy.
Leveraging Data Analytics
Big data and analytics provide deeper insights into market trends and trader behavior. Use advanced analytics tools to refine your trading strategies.
Utilizing Modern Trading Tools
Modern trading platforms offer real-time data, advanced charting capabilities, and automated trading features, making it easier to apply InterMarket Analysis.
Conclusion
John J. Murphy’s “InterMarket Analysis” (Ed. 2004) remains a crucial resource for traders seeking to understand and anticipate market movements. By analyzing the relationships between different financial markets, traders can gain valuable insights, confirm signals, and manage risk more effectively. As with any trading strategy, continuous education and adaptation to changing market conditions are essential.
 with John J.Murphy")
FAQs
1. What is InterMarket Analysis?
InterMarket Analysis studies the relationships between different financial markets to predict market movements.
2. Why is InterMarket Analysis important?
It provides a comprehensive view of market behavior, helping traders identify trends and potential turning points.
3. How can InterMarket Analysis improve trading strategies?
It enhances market understanding, allowing for more informed trading decisions and better risk management.
4. What are the key tools used in InterMarket Analysis?
Key tools include chart patterns, correlation analysis, and technical indicators like moving averages and RSI.
5. What are the challenges of InterMarket Analysis?
The main challenges are its complexity and the need for accurate data interpretation.
Be the first to review “InterMarket Analysis (Ed.2004) with John J.Murphy”
You must be logged in to post a review.
Related products

Forex Trading
Original price was: $1,098.00.$39.00Current price is: $39.00.

Original price was: $197.00.$5.00Current price is: $5.00.

Original price was: $799.00.$15.00Current price is: $15.00.

Original price was: $497.00.$11.00Current price is: $11.00.

Forex Trading
Original price was: $2,000.00.$23.00Current price is: $23.00.

Original price was: $649.00.$20.00Current price is: $20.00.
Forex Trading
Original price was: $239.00.$8.00Current price is: $8.00.

Forex Trading
Original price was: $697.00.$5.00Current price is: $5.00.

Forex Trading
Original price was: $2,995.00.$31.00Current price is: $31.00.

Forex Trading
Original price was: $500.00.$5.00Current price is: $5.00.

Original price was: $997.00.$8.00Current price is: $8.00.

Forex Trading
Original price was: $797.00.$10.00Current price is: $10.00.
Forex Trading
Original price was: $4,997.00.$27.00Current price is: $27.00.
Original price was: $299.00.$8.00Current price is: $8.00.
Forex Trading
Original price was: $1,898.00.$10.00Current price is: $10.00.

Forex Trading
Original price was: $125.00.$17.00Current price is: $17.00.

Forex Trading
The Complete Guide to Multiple Time Frame Analysis & Reading Price Action with Aiman Almansoori
Original price was: $1,399.00.$13.00Current price is: $13.00.

Forex Trading
Original price was: $999.00.$15.00Current price is: $15.00.

Forex Trading
Original price was: $850.00.$23.00Current price is: $23.00.

Original price was: $310.00.$23.00Current price is: $23.00.

Reviews
There are no reviews yet.