-
×
 Intra-day Trading Strategies. Proven Steps to Trading Profits
1 × $6.00
Intra-day Trading Strategies. Proven Steps to Trading Profits
1 × $6.00 -
×
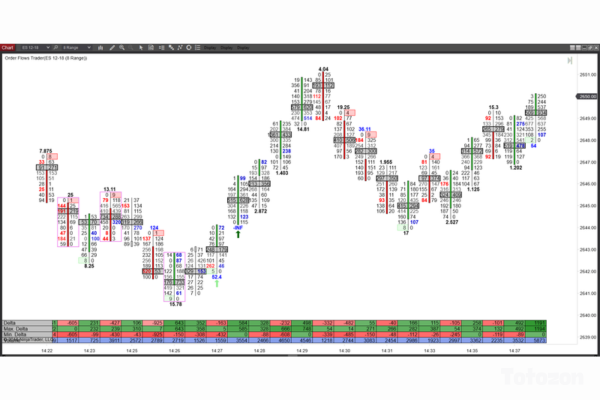 Orderflows - The Imbalance Course
1 × $8.00
Orderflows - The Imbalance Course
1 × $8.00 -
×
 SQX Mentorship with Tip Toe Hippo
1 × $23.00
SQX Mentorship with Tip Toe Hippo
1 × $23.00 -
×
 Algo Trading Masterclass with Ali Casey - StatOasis
1 × $23.00
Algo Trading Masterclass with Ali Casey - StatOasis
1 × $23.00 -
×
 ICinDER V2 Cycle Analysis and TrendGuide Pack and Bloodhound Ultimate (May 2015)
1 × $31.00
ICinDER V2 Cycle Analysis and TrendGuide Pack and Bloodhound Ultimate (May 2015)
1 × $31.00 -
×
 SOT Intermediate Course (May 2014)
1 × $23.00
SOT Intermediate Course (May 2014)
1 × $23.00 -
×
 Master NFTs in 7 Days with Ben Yu
1 × $23.00
Master NFTs in 7 Days with Ben Yu
1 × $23.00 -
×
 Newtonian Trading Strategy Video Course with Fractal Flow Pro
1 × $6.00
Newtonian Trading Strategy Video Course with Fractal Flow Pro
1 × $6.00 -
×
 Trading MasterMind Course
1 × $23.00
Trading MasterMind Course
1 × $23.00 -
×
 Intra-Day Trading Techniques CD with Greg Capra
1 × $6.00
Intra-Day Trading Techniques CD with Greg Capra
1 × $6.00 -
×
 Consistently Profitable Trader with Pollinate Trading
1 × $13.00
Consistently Profitable Trader with Pollinate Trading
1 × $13.00 -
×
 LIVE TRADERS - TECHNICAL STOCK TRADING
1 × $23.00
LIVE TRADERS - TECHNICAL STOCK TRADING
1 × $23.00 -
×
 Exploiting Volatility: Mastering Equity and Index Options with David Lerman
1 × $6.00
Exploiting Volatility: Mastering Equity and Index Options with David Lerman
1 × $6.00 -
×
 The Naked Eye: Raw Data Analytics with Edgar Torres - Raw Data Analytics
1 × $8.00
The Naked Eye: Raw Data Analytics with Edgar Torres - Raw Data Analytics
1 × $8.00 -
×
 Managing Risk in Alternative Investment Strategies with Lars Jaeger
1 × $6.00
Managing Risk in Alternative Investment Strategies with Lars Jaeger
1 × $6.00 -
×
 Developing the Psychological Trader’s Edge with Robin Dayne
1 × $6.00
Developing the Psychological Trader’s Edge with Robin Dayne
1 × $6.00 -
×
 Mastering Metatrader 4 in 90 Minutes & Members Site with Alan Benefield
1 × $15.00
Mastering Metatrader 4 in 90 Minutes & Members Site with Alan Benefield
1 × $15.00 -
×
 Zen8 Forex Hedging Program with Hugh Kimura - Trading Heroes
1 × $5.00
Zen8 Forex Hedging Program with Hugh Kimura - Trading Heroes
1 × $5.00 -
×
 The TradingKey - Mastering Elliott Wave by Rob Roy 2010 + Complete Workbooks with HUBB Financial
1 × $6.00
The TradingKey - Mastering Elliott Wave by Rob Roy 2010 + Complete Workbooks with HUBB Financial
1 × $6.00 -
×
 Measuring Market Risk (2nd Edition) with Kevin Dowd
1 × $6.00
Measuring Market Risk (2nd Edition) with Kevin Dowd
1 × $6.00 -
×
 Trading Option Greeks with Dan Passarelli
1 × $6.00
Trading Option Greeks with Dan Passarelli
1 × $6.00 -
×
 Manage By The Greeks 2016 with Sheridan
1 × $6.00
Manage By The Greeks 2016 with Sheridan
1 × $6.00 -
×
 The Orderflows Trade Opportunities Encyclopedia with Michael Valtos
1 × $8.00
The Orderflows Trade Opportunities Encyclopedia with Michael Valtos
1 × $8.00 -
×
 The House Always Wins with jasonbondpicks
1 × $6.00
The House Always Wins with jasonbondpicks
1 × $6.00 -
×
 Elliott Wave Street Course with Juan Maldonado
1 × $17.00
Elliott Wave Street Course with Juan Maldonado
1 × $17.00 -
×
 Forex Mastermind with FOREX4NOOBS
1 × $5.00
Forex Mastermind with FOREX4NOOBS
1 × $5.00 -
×
 Trading Day By Day & Code (chickgoslin.com) with Chick Goslin
1 × $6.00
Trading Day By Day & Code (chickgoslin.com) with Chick Goslin
1 × $6.00 -
×
 The Ultimate Investor with Dean LeBaron
1 × $4.00
The Ultimate Investor with Dean LeBaron
1 × $4.00 -
×
 Low Timeframe Supply and Demand with SMC Gelo
1 × $5.00
Low Timeframe Supply and Demand with SMC Gelo
1 × $5.00 -
×
 In Jeremy's Stock Market Brain
1 × $62.00
In Jeremy's Stock Market Brain
1 × $62.00 -
×
 Unlock the Millionaire Within with Dan Lok
1 × $15.00
Unlock the Millionaire Within with Dan Lok
1 × $15.00 -
×
 Deep Dive Butterfly Trading Strategy Class with SJG Trades
1 × $41.00
Deep Dive Butterfly Trading Strategy Class with SJG Trades
1 × $41.00 -
×
 Activedaytrader - Workshop Options For Income
1 × $15.00
Activedaytrader - Workshop Options For Income
1 × $15.00 -
×
 Intermediate to Advanced Intensive Q and A with Rob Hoffman
1 × $6.00
Intermediate to Advanced Intensive Q and A with Rob Hoffman
1 × $6.00 -
×
 0 DTE Options Trading Workshop with Aeromir Corporation
1 × $15.00
0 DTE Options Trading Workshop with Aeromir Corporation
1 × $15.00 -
×
 Charles Cottle Package ( Discount 50% )
1 × $23.00
Charles Cottle Package ( Discount 50% )
1 × $23.00 -
×
 Hustle Trading FX Course
1 × $10.00
Hustle Trading FX Course
1 × $10.00 -
×
 Option Hydra - June 2020 Edition - Basics By Rajandran R
1 × $23.00
Option Hydra - June 2020 Edition - Basics By Rajandran R
1 × $23.00 -
×
 Introduction to Fibonacci Time Analysis with Carolyn Boroden
1 × $6.00
Introduction to Fibonacci Time Analysis with Carolyn Boroden
1 × $6.00 -
×
 Commodity Trading Video Course with Bob Buran
1 × $6.00
Commodity Trading Video Course with Bob Buran
1 × $6.00 -
×
 Option Income Stream System 2004
1 × $6.00
Option Income Stream System 2004
1 × $6.00 -
×
 Wyckoff 2.0: Structures, Volume Profile and Order Flow (Trading and Investing Course: Advanced Technical Analysis) by Rubén Villahermosa
1 × $5.00
Wyckoff 2.0: Structures, Volume Profile and Order Flow (Trading and Investing Course: Advanced Technical Analysis) by Rubén Villahermosa
1 × $5.00 -
×
 Astro-Cycles and Speculative Markets with L.J.Jensen
1 × $6.00
Astro-Cycles and Speculative Markets with L.J.Jensen
1 × $6.00 -
×
 Advanced Daytrading Seminar with Ken Calhoun
1 × $155.00
Advanced Daytrading Seminar with Ken Calhoun
1 × $155.00 -
×
 Three Tricks, Two Traps, One Truth Real Help for Traders and Investors with D.R.Barton
1 × $6.00
Three Tricks, Two Traps, One Truth Real Help for Traders and Investors with D.R.Barton
1 × $6.00 -
×
 Getting Started in Technical Analysis with Jack Schwager
1 × $6.00
Getting Started in Technical Analysis with Jack Schwager
1 × $6.00 -
×
 Gann’s Secret with Jeanne Long
1 × $4.00
Gann’s Secret with Jeanne Long
1 × $4.00 -
×
 New Foundations for Auction Market Trading Course with Tom Alexander
1 × $54.00
New Foundations for Auction Market Trading Course with Tom Alexander
1 × $54.00 -
×
 Sharp Edge Institutional Trading Program 2022 (No indicators) with CompassFX
1 × $139.00
Sharp Edge Institutional Trading Program 2022 (No indicators) with CompassFX
1 × $139.00 -
×
 Winning System For Trading High-Performance Stocks with Tim Cho
1 × $6.00
Winning System For Trading High-Performance Stocks with Tim Cho
1 × $6.00 -
×
 Area 61 with BCFX
1 × $6.00
Area 61 with BCFX
1 × $6.00 -
×
 Forecast 2024 Clarification with Larry Williams
1 × $15.00
Forecast 2024 Clarification with Larry Williams
1 × $15.00 -
×
 Point and Figure Mentorship Course
1 × $54.00
Point and Figure Mentorship Course
1 × $54.00 -
×
 Team Candlecharts Trading Strategies with Candle Charts
1 × $31.00
Team Candlecharts Trading Strategies with Candle Charts
1 × $31.00 -
×
 Ultimate Trading Course with Dodgy's Dungeon
1 × $8.00
Ultimate Trading Course with Dodgy's Dungeon
1 × $8.00 -
×
 Getting Started With Options with Peter Titus - Marwood Research
1 × $6.00
Getting Started With Options with Peter Titus - Marwood Research
1 × $6.00 -
×
 High Probability Trading Using Elliott Wave And Fibonacci Analysis withVic Patel - Forex Training Group
1 × $10.00
High Probability Trading Using Elliott Wave And Fibonacci Analysis withVic Patel - Forex Training Group
1 × $10.00 -
×
 Yield Farming MasterClass Course (2022) with Boss Financial
1 × $5.00
Yield Farming MasterClass Course (2022) with Boss Financial
1 × $5.00 -
×
 The Complete Guide to Multiple Time Frame Analysis & Reading Price Action with Aiman Almansoori
1 × $13.00
The Complete Guide to Multiple Time Frame Analysis & Reading Price Action with Aiman Almansoori
1 × $13.00

Getting New Insights from Old Indicators with Martin Pring
$6.00
File Size: Coming soon!
Delivery Time: 1–12 hours
Media Type: Online Course
Content Proof: Watch Here!
You may check content proof of “Getting New Insights from Old Indicators with Martin Pring” below:

Getting New Insights from Old Indicators with Martin Pring
Introduction to Martin Pring’s Approach
When it comes to technical analysis, Martin Pring is a name that resonates with both seasoned traders and newcomers. His ability to derive new insights from traditional indicators has set him apart in the trading community. This article delves into Pring’s innovative methods for extracting fresh perspectives from established indicators, helping traders enhance their strategies and achieve better results.
Who is Martin Pring?
A Pioneer in Technical Analysis
Martin Pring is a renowned author, educator, and trader who has significantly influenced the field of technical analysis. With decades of experience, he has developed numerous tools and methodologies that have become staples in the trading world.
Contributions to Trading
Pring’s work extends beyond his books and seminars. He has created innovative indicators and analysis techniques that traders around the world rely on to navigate the financial markets.
Understanding Technical Indicators
What are Technical Indicators?
Technical indicators are mathematical calculations based on historical price, volume, or open interest information. They are used by traders to predict future market movements.
Types of Technical Indicators
- Trend Indicators: Identify the direction of the market.
- Momentum Indicators: Measure the speed of price movements.
- Volume Indicators: Analyze trading volume to gauge the strength of a move.
- Volatility Indicators: Assess the rate of price fluctuations.
The Value of Old Indicators
Why Old Indicators Matter
Traditional indicators have stood the test of time because they provide valuable insights into market behavior. Understanding their strengths and limitations is crucial for effective trading.
Examples of Old Indicators
- Moving Averages
- Relative Strength Index (RSI)
- Bollinger Bands
- MACD (Moving Average Convergence Divergence)
Martin Pring’s New Insights
Innovative Use of Moving Averages
Pring has developed new ways to interpret moving averages, such as combining different timeframes to better identify trend changes.
Combining Timeframes
Using short-term and long-term moving averages together can provide a clearer picture of market trends. For example, a crossover of a 50-day moving average with a 200-day moving average is a classic signal of a major trend shift.
Enhanced Relative Strength Index (RSI)
Pring’s approach to RSI involves adjusting the period settings and incorporating it with other indicators to confirm signals.
Adjusting Period Settings
Instead of the traditional 14-day period, Pring suggests experimenting with different periods to better match the market’s current volatility.
Reinterpreting Bollinger Bands
By modifying the standard deviation settings and analyzing the width of the bands, Pring offers deeper insights into market volatility and potential breakout points.
Modifying Standard Deviation
Using a 1.5 or 2.5 standard deviation instead of the typical 2 can highlight different market conditions and potential trade opportunities.
Advanced MACD Interpretations
Pring’s advanced interpretations of MACD focus on the histogram and its relation to price movements, offering a more nuanced view of market momentum.
Focus on Histogram
Analyzing the MACD histogram helps traders identify early signs of trend reversals and momentum shifts.
Applying Pring’s Methods
Step-by-Step Guide
- Identify the Indicator: Choose an indicator to analyze.
- Adjust Parameters: Modify the settings as suggested by Pring.
- Combine Indicators: Use multiple indicators for confirmation.
- Analyze Market Conditions: Consider current market trends and volatility.
- Make Informed Decisions: Use the insights gained to inform your trading strategy.
Practical Examples
Example 1: Moving Averages
Combine a 50-day and a 200-day moving average to identify long-term trends. Look for crossovers as signals for potential buy or sell opportunities.
Example 2: RSI
Adjust the RSI period to 20 days for a more sensitive reading. Combine it with volume indicators to confirm the strength of a trend.
The Importance of Continuous Learning
Staying Updated
The financial markets are constantly evolving. Staying informed about new techniques and continuously refining your approach is essential for success.
Educational Resources
Martin Pring offers a wealth of resources, including books, seminars, and online courses, to help traders stay ahead of the curve.
Conclusion
Martin Pring’s innovative approach to deriving new insights from old indicators provides traders with powerful tools to enhance their trading strategies. By reinterpreting traditional indicators like moving averages, RSI, Bollinger Bands, and MACD, Pring offers fresh perspectives that can lead to more informed trading decisions. Embracing these techniques and continuously learning can significantly improve trading performance.
FAQs
1. What are Martin Pring’s contributions to technical analysis?
Martin Pring has developed innovative indicators and analysis techniques that have become essential tools for traders. His work focuses on extracting new insights from traditional indicators.
2. How can I apply Pring’s methods to my trading strategy?
Start by choosing an indicator, adjusting its parameters as suggested by Pring, and combining it with other indicators for confirmation. Analyze market conditions and use the insights to make informed trading decisions.
3. Why are traditional indicators still relevant?
Traditional indicators have stood the test of time because they provide valuable insights into market behavior. Understanding their strengths and limitations is crucial for effective trading.
4. What is the importance of continuous learning in trading?
The financial markets are constantly evolving, making it essential for traders to stay informed about new techniques and continuously refine their approach to maintain a competitive edge.
5. Where can I find educational resources by Martin Pring?
Martin Pring offers a variety of resources, including books, seminars, and online courses, which can be found on his official website and other educational platforms.
Be the first to review “Getting New Insights from Old Indicators with Martin Pring”
You must be logged in to post a review.
Related products
Forex Trading
Original price was: $239.00.$8.00Current price is: $8.00.

Forex Trading
Original price was: $550.00.$5.00Current price is: $5.00.
Original price was: $695.00.$41.00Current price is: $41.00.

Original price was: $997.00.$13.00Current price is: $13.00.

Forex Trading
Original price was: $2,995.00.$31.00Current price is: $31.00.

Forex Trading
Original price was: $499.00.$15.00Current price is: $15.00.

Original price was: $700.00.$39.00Current price is: $39.00.

Original price was: $139.00.$23.00Current price is: $23.00.

Original price was: $895.00.$15.00Current price is: $15.00.

Forex Trading
Original price was: $397.00.$31.00Current price is: $31.00.
Forex Trading
The Complete Guide to Multiple Time Frame Analysis & Reading Price Action with Aiman Almansoori
Original price was: $1,399.00.$13.00Current price is: $13.00.

Original price was: $497.00.$31.00Current price is: $31.00.
Forex Trading
Original price was: $2,000.00.$23.00Current price is: $23.00.

Original price was: $310.00.$23.00Current price is: $23.00.

Forex Trading
Original price was: $125.00.$17.00Current price is: $17.00.

Original price was: $1,800.00.$54.00Current price is: $54.00.
Forex Trading
Original price was: $1,898.00.$10.00Current price is: $10.00.
Original price was: $997.00.$8.00Current price is: $8.00.

Forex Trading
Original price was: $799.00.$15.00Current price is: $15.00.

Original price was: $497.00.$11.00Current price is: $11.00.
Reviews
There are no reviews yet.