-
×
 0 DTE Options Trading Workshop with Aeromir Corporation
1 × $15.00
0 DTE Options Trading Workshop with Aeromir Corporation
1 × $15.00 -
×
 Options Trading & Ultimate MasterClass With Tyrone Abela - FX Evolution
1 × $54.00
Options Trading & Ultimate MasterClass With Tyrone Abela - FX Evolution
1 × $54.00 -
×
 Commodities Rising: The Reality Behind the Hype and How To Really Profit in the Commodities Market - Jeffrey Christian
1 × $6.00
Commodities Rising: The Reality Behind the Hype and How To Really Profit in the Commodities Market - Jeffrey Christian
1 × $6.00 -
×
 Traders Winning Edge with Adrienne Laris Toghraie
1 × $6.00
Traders Winning Edge with Adrienne Laris Toghraie
1 × $6.00 -
×
 The Best Option Trading Course with David Jaffee - Best Stock Strategy
1 × $15.00
The Best Option Trading Course with David Jaffee - Best Stock Strategy
1 × $15.00 -
×
 The Indices Orderflow Masterclass with The Forex Scalpers
1 × $23.00
The Indices Orderflow Masterclass with The Forex Scalpers
1 × $23.00 -
×
 Arjoio’s MMT - Essential Package
1 × $5.00
Arjoio’s MMT - Essential Package
1 × $5.00 -
×
 Risk Stop Loss and Position Size with Daryl Guppy
1 × $6.00
Risk Stop Loss and Position Size with Daryl Guppy
1 × $6.00 -
×
 A Really Friendly Guide to Wavelets with C.Vallens
1 × $6.00
A Really Friendly Guide to Wavelets with C.Vallens
1 × $6.00 -
×
 Getting Started in Forex Trading Strategies with Michael Duane Archer
1 × $6.00
Getting Started in Forex Trading Strategies with Michael Duane Archer
1 × $6.00 -
×
 30 Day Masterclass with Joe Elite Trader Hub ICT
1 × $6.00
30 Day Masterclass with Joe Elite Trader Hub ICT
1 × $6.00 -
×
 Artificial Neural Networks Technology with Dave Anderson, George McNeill
1 × $6.00
Artificial Neural Networks Technology with Dave Anderson, George McNeill
1 × $6.00 -
×
 Options Trading. The Hidden Reality Course with Charles Cottle
1 × $6.00
Options Trading. The Hidden Reality Course with Charles Cottle
1 × $6.00 -
×
 Order flow self-study training program with iMFtracker
1 × $10.00
Order flow self-study training program with iMFtracker
1 × $10.00 -
×
 3 Short Selling Strategies - Trading Strategy Bundles – Quantified Strategies
1 × $39.00
3 Short Selling Strategies - Trading Strategy Bundles – Quantified Strategies
1 × $39.00 -
×
 Smart Money Trading Course with Prosperity Academy
1 × $5.00
Smart Money Trading Course with Prosperity Academy
1 × $5.00 -
×
 A Game Plan for Investing in the 21st Century with Thomas J.Dorsey
1 × $6.00
A Game Plan for Investing in the 21st Century with Thomas J.Dorsey
1 × $6.00 -
×
 Market Tide indicator with Alphashark
1 × $54.00
Market Tide indicator with Alphashark
1 × $54.00 -
×
 Dow Theory for the 21st Century: Technical Indicators for Improving Your Investment Results with Jack Schannep
1 × $6.00
Dow Theory for the 21st Century: Technical Indicators for Improving Your Investment Results with Jack Schannep
1 × $6.00 -
×
 A Momentum Based Approach to Swing Trading with Dave Landry
1 × $6.00
A Momentum Based Approach to Swing Trading with Dave Landry
1 × $6.00 -
×
 Candlesticks Explained with Martin Pring
1 × $6.00
Candlesticks Explained with Martin Pring
1 × $6.00 -
×
 OFA - Intensive Boot Camp 5 Day Course
1 × $6.00
OFA - Intensive Boot Camp 5 Day Course
1 × $6.00 -
×
 A Comparison of Popular Trading Systems (2nd Ed.) with Lars Kestner
1 × $6.00
A Comparison of Popular Trading Systems (2nd Ed.) with Lars Kestner
1 × $6.00 -
×
 Fibonacci for the Active Trader with Derrik Hobbs
1 × $6.00
Fibonacci for the Active Trader with Derrik Hobbs
1 × $6.00 -
×
 Keynes & The Market with Justyn Walsh
1 × $6.00
Keynes & The Market with Justyn Walsh
1 × $6.00 -
×
 The Complete Guide to Multiple Time Frame Analysis & Reading Price Action with Aiman Almansoori
1 × $13.00
The Complete Guide to Multiple Time Frame Analysis & Reading Price Action with Aiman Almansoori
1 × $13.00 -
×
 All About Bonds & Mutual Funds with Esme Faerber
1 × $6.00
All About Bonds & Mutual Funds with Esme Faerber
1 × $6.00 -
×
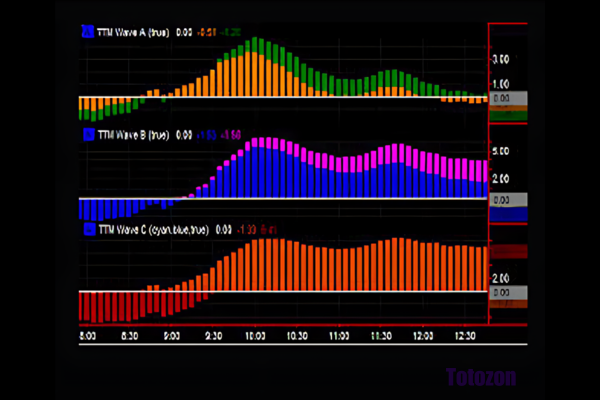 ABC Waves TOS Indicator & Live Class with Simpler Options
1 × $6.00
ABC Waves TOS Indicator & Live Class with Simpler Options
1 × $6.00 -
×
 CAT 2007 Seminar with Stephen W.Bigalow
1 × $6.00
CAT 2007 Seminar with Stephen W.Bigalow
1 × $6.00 -
×
 Technical Analysis Applications in the Global Currency Markets (2nd Ed.) with Cornelius Luca
1 × $6.00
Technical Analysis Applications in the Global Currency Markets (2nd Ed.) with Cornelius Luca
1 × $6.00 -
×
 Applications of Abstract Algebra with Maple - Richard E.Kline, Neil Sigmon, Ernst Stitzinger
1 × $6.00
Applications of Abstract Algebra with Maple - Richard E.Kline, Neil Sigmon, Ernst Stitzinger
1 × $6.00 -
×
 Adx Mastery Complete Course
1 × $6.00
Adx Mastery Complete Course
1 × $6.00 -
×
 The Raptor 10 Momentum Methodology Course
1 × $6.00
The Raptor 10 Momentum Methodology Course
1 × $6.00 -
×
 Shawn Sharma Mentorship Program
1 × $34.00
Shawn Sharma Mentorship Program
1 × $34.00 -
×
 Simulating Continuous Fuzzy Systems with James Buckley & Leonard Jowers
1 × $6.00
Simulating Continuous Fuzzy Systems with James Buckley & Leonard Jowers
1 × $6.00 -
×
 Capital with Charles D.Ellis
1 × $6.00
Capital with Charles D.Ellis
1 × $6.00 -
×
 TRADING NFX Course with Andrew NFX
1 × $5.00
TRADING NFX Course with Andrew NFX
1 × $5.00 -
×
 Stock Market Rules (3rd Ed.) with Michael Sheimo
1 × $6.00
Stock Market Rules (3rd Ed.) with Michael Sheimo
1 × $6.00 -
×
 3 Technical Indicators to Help You Ride the Elliott Wave Trend with Chris Carolan
1 × $6.00
3 Technical Indicators to Help You Ride the Elliott Wave Trend with Chris Carolan
1 × $6.00 -
×
 Simpler Options - Insider’s Guide to Generating Income using Options Strategies Course (Oct 2014)
1 × $6.00
Simpler Options - Insider’s Guide to Generating Income using Options Strategies Course (Oct 2014)
1 × $6.00 -
×
 ENG Renko Mastery with International Scalpers
1 × $10.00
ENG Renko Mastery with International Scalpers
1 × $10.00 -
×
 AI For Traders with Trading Markets
1 × $31.00
AI For Traders with Trading Markets
1 × $31.00 -
×
 Altucher’s Top 1% Advisory Newsletter 2016 with James Altucher
1 × $6.00
Altucher’s Top 1% Advisory Newsletter 2016 with James Altucher
1 × $6.00 -
×
 The Psychology of Investing with John Nofsinger
1 × $6.00
The Psychology of Investing with John Nofsinger
1 × $6.00 -
×
 Five Trading Trends of 2005 with Dan Denning
1 × $6.00
Five Trading Trends of 2005 with Dan Denning
1 × $6.00 -
×
 5 Basic Elliott Wave Patterns + Technical Tools = Trading Success with Jeffrey Kennedy
1 × $15.00
5 Basic Elliott Wave Patterns + Technical Tools = Trading Success with Jeffrey Kennedy
1 × $15.00 -
×
 Lepus Proprietary Trading with Richard Jackson
1 × $6.00
Lepus Proprietary Trading with Richard Jackson
1 × $6.00 -
×
 All Candlestick Patterns Tested And Ranked with Quantified Strategies
1 × $8.00
All Candlestick Patterns Tested And Ranked with Quantified Strategies
1 × $8.00 -
×
 Master Class Recording 2019 with Oil Trading Academy
1 × $17.00
Master Class Recording 2019 with Oil Trading Academy
1 × $17.00 -
×
 Predators & Profits with Martin Howell & John Bogle
1 × $6.00
Predators & Profits with Martin Howell & John Bogle
1 × $6.00 -
×
 KP Trading Room w/ Paladin and JadeCapFX
1 × $5.00
KP Trading Room w/ Paladin and JadeCapFX
1 × $5.00 -
×
 Home Run Options Trading Course with Dave Aquino - Base Camp Trading
1 × $11.00
Home Run Options Trading Course with Dave Aquino - Base Camp Trading
1 × $11.00 -
×
 The Orderflows Trade Opportunities Encyclopedia with Michael Valtos
1 × $8.00
The Orderflows Trade Opportunities Encyclopedia with Michael Valtos
1 × $8.00 -
×
 Forecast 2012 Report with Larry Williams
1 × $6.00
Forecast 2012 Report with Larry Williams
1 × $6.00 -
×
 Stock Detective Investor: Finding Market Gems Online with Kevin Lichtman & Lynn Duke
1 × $6.00
Stock Detective Investor: Finding Market Gems Online with Kevin Lichtman & Lynn Duke
1 × $6.00 -
×
 Fierce 10 On Demand Coaching Program with High Performance Trading
1 × $5.00
Fierce 10 On Demand Coaching Program with High Performance Trading
1 × $5.00 -
×
 Trading Short TermSame Day Trades Sep 2023 with Dan Sheridan & Mark Fenton - Sheridan Options Mentoring
1 × $31.00
Trading Short TermSame Day Trades Sep 2023 with Dan Sheridan & Mark Fenton - Sheridan Options Mentoring
1 × $31.00 -
×
 Momentum Signals Training Course with Fulcum Trader
1 × $5.00
Momentum Signals Training Course with Fulcum Trader
1 × $5.00 -
×
 Advanced Course with Jtrader
1 × $6.00
Advanced Course with Jtrader
1 × $6.00 -
×
 How I Make A Living Daytrading Stocks with David Floyd
1 × $4.00
How I Make A Living Daytrading Stocks with David Floyd
1 × $4.00 -
×
 SE ELITE COURSE with SE TRADINGX
1 × $5.00
SE ELITE COURSE with SE TRADINGX
1 × $5.00 -
×
 Market Making Scalping Manual with Gary Norden - Jigsaw Trading
1 × $69.00
Market Making Scalping Manual with Gary Norden - Jigsaw Trading
1 × $69.00 -
×
 Compass Trading System with Right Line Trading
1 × $39.00
Compass Trading System with Right Line Trading
1 × $39.00

Forex Shockwave Analysis with James Bickford
$6.00
File Size: Coming soon!
Delivery Time: 1–12 hours
Media Type: Online Course
Content Proof: Watch Here!
You may check content proof of “Forex Shockwave Analysis with James Bickford” below:

Forex Shockwave Analysis with James Bickford
Navigating the turbulent waters of forex trading can be a daunting task. James Bickford’s “Forex Shockwave Analysis” provides traders with a powerful tool to decipher market movements and make informed trading decisions. This article will guide you through the key concepts and practical applications of Forex Shockwave Analysis, helping you enhance your trading strategy.
Understanding Forex Shockwave Analysis
What is Forex Shockwave Analysis?
Forex Shockwave Analysis is a method of analyzing forex market movements by identifying and interpreting significant price shocks. These shocks often precede major market trends and can be used to predict future price movements.
The Genesis of Shockwave Analysis
James Bickford developed this analysis technique to help traders identify market disruptions that lead to significant price changes. It combines elements of technical and fundamental analysis to provide a comprehensive view of the market.
Key Components of Shockwave Analysis
Identifying Price Shocks
Price shocks are sudden, unexpected changes in the price of a currency pair. These shocks can be caused by various factors, including economic data releases, geopolitical events, and market sentiment shifts.
Analyzing Shockwave Patterns
Shockwave patterns are formed by the price movements following a shock. These patterns can be categorized into different types, such as continuation patterns, reversal patterns, and consolidation patterns.
Applying Shockwave Analysis to Forex Trading
Spotting Shockwave Patterns
To spot shockwave patterns, traders need to monitor the market for sudden price changes and analyze the subsequent price movements. Tools like candlestick charts and moving averages can be helpful in this process.
Using Shockwave Analysis for Entry and Exit Points
Shockwave Analysis can help traders identify optimal entry and exit points. For example, a strong continuation pattern following a price shock can indicate a good entry point, while a reversal pattern may signal an exit point.
Technical Tools for Shockwave Analysis
Candlestick Charts
Candlestick charts are essential for identifying shockwave patterns. They provide a visual representation of price movements and help traders spot key patterns like hammers, dojis, and engulfing patterns.
Moving Averages
Moving averages smooth out price data and help identify the overall trend. They can also be used to confirm shockwave patterns and provide additional entry and exit signals.
Relative Strength Index (RSI)
The RSI measures the speed and change of price movements. It can help traders identify overbought or oversold conditions, which are often associated with price shocks.
Fundamental Factors Influencing Price Shocks
Economic Data Releases
Economic indicators such as GDP growth, employment figures, and inflation rates can cause significant price shocks. Traders need to stay informed about upcoming data releases and their potential impact on the market.
Geopolitical Events
Geopolitical events, including elections, trade negotiations, and conflicts, can lead to sudden market movements. Understanding these events and their potential implications is crucial for successful shockwave analysis.
Shockwave Analysis in Different Market Conditions
Bullish Markets
In bullish markets, shockwave patterns often indicate strong continuation trends. Traders can use these patterns to identify buying opportunities and ride the upward momentum.
Bearish Markets
In bearish markets, shockwave patterns may signal potential reversals or continuation of downward trends. Traders should be cautious and look for confirmation before entering trades.
Sideways Markets
In sideways markets, shockwave patterns can indicate potential breakouts or breakdowns. Traders should be prepared for increased volatility and adjust their strategies accordingly.
Case Studies of Shockwave Analysis
Case Study 1: Economic Data Release
A trader identifies a price shock following a strong employment report. Using shockwave analysis, the trader spots a continuation pattern and enters a long position, capitalizing on the upward trend.
Case Study 2: Geopolitical Event
A sudden geopolitical event causes a price shock in the forex market. The trader identifies a reversal pattern using shockwave analysis and exits a short position, avoiding potential losses.
Common Mistakes in Shockwave Analysis
Overlooking Market Context
One common mistake is ignoring the broader market context when analyzing price shocks. Traders should consider other technical indicators and fundamental factors to avoid false signals.
Relying Solely on Shockwave Patterns
While shockwave patterns are powerful, they should not be used in isolation. Combining them with other analysis techniques can improve accuracy and trading outcomes.
Advanced Shockwave Analysis Techniques
Multiple Time Frame Analysis
Analyzing price shocks across different time frames can provide a more comprehensive view of the market. This technique helps traders identify long-term trends and short-term entry points.
Volume Analysis
Volume analysis can confirm the strength of a price shock. High trading volume following a price shock indicates strong market participation and can validate the shockwave pattern.
Psychological Aspects of Shockwave Trading
Managing Emotional Reactions
Price shocks can evoke strong emotional reactions. Traders need to remain calm and stick to their analysis to avoid impulsive decisions.
Building Confidence
Confidence in shockwave analysis comes with experience. Practicing the identification and interpretation of shockwave patterns will improve trading skills and outcomes.
Conclusion
Forex Shockwave Analysis, as pioneered by James Bickford, offers a unique approach to understanding market movements. By identifying and interpreting price shocks, traders can enhance their trading strategies and make informed decisions. Remember, combining shockwave analysis with other technical and fundamental tools, and maintaining emotional discipline, is key to successful trading.
FAQs
1. What makes Forex Shockwave Analysis unique?
Forex Shockwave Analysis focuses on identifying and interpreting sudden price shocks, providing a unique perspective on market movements.
2. Can shockwave analysis be used for all currency pairs?
Yes, shockwave analysis can be applied to any currency pair. However, the effectiveness may vary depending on market conditions and the specific pair.
3. How do economic data releases impact shockwave patterns?
Economic data releases often cause significant price shocks, leading to the formation of shockwave patterns. Traders should monitor these releases closely.
4. Is it necessary to use other technical indicators with shockwave analysis?
While shockwave analysis is powerful, using it in conjunction with other technical indicators can improve accuracy and trading outcomes.
5. How can I improve my skills in shockwave analysis?
Regular practice, continuous learning, and analyzing historical price shocks can help improve your skills in shockwave analysis.
Be the first to review “Forex Shockwave Analysis with James Bickford”
You must be logged in to post a review.
Related products
Forex Trading
Original price was: $500.00.$5.00Current price is: $5.00.
Forex Trading
Original price was: $1,898.00.$10.00Current price is: $10.00.

Forex Trading
Original price was: $125.00.$17.00Current price is: $17.00.

Original price was: $799.00.$15.00Current price is: $15.00.

Original price was: $695.00.$41.00Current price is: $41.00.

Original price was: $997.00.$13.00Current price is: $13.00.

Original price was: $139.00.$23.00Current price is: $23.00.

Original price was: $197.00.$5.00Current price is: $5.00.
Original price was: $299.00.$8.00Current price is: $8.00.

Forex Trading
Original price was: $797.00.$10.00Current price is: $10.00.
Original price was: $1,800.00.$54.00Current price is: $54.00.

Forex Trading
Original price was: $799.00.$15.00Current price is: $15.00.

Original price was: $999.00.$5.00Current price is: $5.00.
Original price was: $1,849.00.$15.00Current price is: $15.00.

Original price was: $310.00.$23.00Current price is: $23.00.

Forex Trading
Original price was: $2,997.00.$23.00Current price is: $23.00.

Forex Trading
Original price was: $2,000.00.$23.00Current price is: $23.00.

Original price was: $497.00.$31.00Current price is: $31.00.
Forex Trading
The Complete Guide to Multiple Time Frame Analysis & Reading Price Action with Aiman Almansoori
Original price was: $1,399.00.$13.00Current price is: $13.00.
Original price was: $450.00.$23.00Current price is: $23.00.
Reviews
There are no reviews yet.