-
×
 Trading For Busy People with Josias Kere
1 × $6.00
Trading For Busy People with Josias Kere
1 × $6.00 -
×
 Advanced Trading Techniques 2 CDs with Sammy Chua
1 × $6.00
Advanced Trading Techniques 2 CDs with Sammy Chua
1 × $6.00 -
×
 The Prop Trading Code with Brannigan Barrett - Axia Futures
1 × $23.00
The Prop Trading Code with Brannigan Barrett - Axia Futures
1 × $23.00 -
×
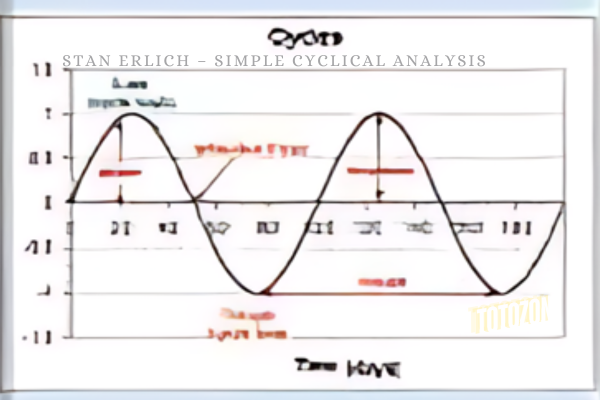 Simple Cyclical Analysis with Stan Erlich
1 × $6.00
Simple Cyclical Analysis with Stan Erlich
1 × $6.00 -
×
 Trading Short TermSame Day Trades Sep 2023 with Dan Sheridan & Mark Fenton - Sheridan Options Mentoring
1 × $31.00
Trading Short TermSame Day Trades Sep 2023 with Dan Sheridan & Mark Fenton - Sheridan Options Mentoring
1 × $31.00 -
×
 Forecast 2024 Clarification with Larry Williams
1 × $15.00
Forecast 2024 Clarification with Larry Williams
1 × $15.00 -
×
 The Best Option Trading Course with David Jaffee - Best Stock Strategy
1 × $15.00
The Best Option Trading Course with David Jaffee - Best Stock Strategy
1 × $15.00 -
×
 A Convicted Stock Manipulators Guide to Investing with Marino Specogna
1 × $6.00
A Convicted Stock Manipulators Guide to Investing with Marino Specogna
1 × $6.00 -
×
 5 Technical Signals You Should Not Trade Without (4 CDs) with Toni Hansen
1 × $6.00
5 Technical Signals You Should Not Trade Without (4 CDs) with Toni Hansen
1 × $6.00 -
×
 Ultimate Trading Course with Dodgy's Dungeon
1 × $8.00
Ultimate Trading Course with Dodgy's Dungeon
1 × $8.00 -
×
 FTMO Academy Course
1 × $5.00
FTMO Academy Course
1 × $5.00 -
×
 Charting the Major Forex Pairs: Focus on Major Currencies with James Bickford
1 × $6.00
Charting the Major Forex Pairs: Focus on Major Currencies with James Bickford
1 × $6.00 -
×
 A+ Setups Big Caps Options with Jtrader
1 × $6.00
A+ Setups Big Caps Options with Jtrader
1 × $6.00 -
×
 Investing in 401k Plans with Cliffsnotes
1 × $6.00
Investing in 401k Plans with Cliffsnotes
1 × $6.00 -
×
 Investment Fables with Aswath Damodaran
1 × $6.00
Investment Fables with Aswath Damodaran
1 × $6.00 -
×
 How to Call the Top in a Stock (To the Penny!) and Earn 9-11% Annualized Cash Yields Doing It with Dan Ferris
1 × $6.00
How to Call the Top in a Stock (To the Penny!) and Earn 9-11% Annualized Cash Yields Doing It with Dan Ferris
1 × $6.00 -
×
 Confessions of a Street Addict with James Cramer
1 × $6.00
Confessions of a Street Addict with James Cramer
1 × $6.00 -
×
 White Phoenix’s The Smart (Money) Approach to Trading with Jayson Casper
1 × $39.00
White Phoenix’s The Smart (Money) Approach to Trading with Jayson Casper
1 × $39.00 -
×
 How Do You See Risk? A Guide to Evaluating & Applying Technical Volatility Indicators class with Theotrade
1 × $4.00
How Do You See Risk? A Guide to Evaluating & Applying Technical Volatility Indicators class with Theotrade
1 × $4.00 -
×
 Follow the Leader Trading System with Anthony Gibson
1 × $6.00
Follow the Leader Trading System with Anthony Gibson
1 × $6.00 -
×
 Crystal Ball Pack PLUS bonus Live Trade By Pat Mitchell - Trick Trades
1 × $20.00
Crystal Ball Pack PLUS bonus Live Trade By Pat Mitchell - Trick Trades
1 × $20.00 -
×
 5-Step-Trading Stocks II - Avoid Common Trading Mistakes - Online Course (April 2014)
1 × $23.00
5-Step-Trading Stocks II - Avoid Common Trading Mistakes - Online Course (April 2014)
1 × $23.00 -
×
 TRADING NFX Course with Andrew NFX
1 × $5.00
TRADING NFX Course with Andrew NFX
1 × $5.00 -
×
 Forex Trading Education Program (Apr-June 2010) with Jimmy Young
1 × $6.00
Forex Trading Education Program (Apr-June 2010) with Jimmy Young
1 × $6.00 -
×
 501 Stock Market Tips & Guidelines with Arshad Khan
1 × $6.00
501 Stock Market Tips & Guidelines with Arshad Khan
1 × $6.00 -
×
 Investment Strategies for the 21th Century with Frank Amstrong
1 × $6.00
Investment Strategies for the 21th Century with Frank Amstrong
1 × $6.00 -
×
 The Complete Guide to Multiple Time Frame Analysis & Reading Price Action with Aiman Almansoori
1 × $13.00
The Complete Guide to Multiple Time Frame Analysis & Reading Price Action with Aiman Almansoori
1 × $13.00 -
×
 The Master Indicator 2023 with Lance Ippolito
1 × $101.00
The Master Indicator 2023 with Lance Ippolito
1 × $101.00 -
×
 Options Trading & Ultimate MasterClass With Tyrone Abela - FX Evolution
1 × $54.00
Options Trading & Ultimate MasterClass With Tyrone Abela - FX Evolution
1 × $54.00 -
×
 The A14 Weekly Option Strategy Workshop with Amy Meissner
1 × $23.00
The A14 Weekly Option Strategy Workshop with Amy Meissner
1 × $23.00 -
×
 Fixed Income Securities (2nd Ed.) with Bruce Tuckman
1 × $10.00
Fixed Income Securities (2nd Ed.) with Bruce Tuckman
1 × $10.00 -
×
 ProfileTraders - Advanced Market Profile (May 2014)
1 × $6.00
ProfileTraders - Advanced Market Profile (May 2014)
1 × $6.00 -
×
 Traders: Risks, Decisions, and Management in Financial Markets - Mark Fenton-O’Creevy, Nigel Nicholson, Emma Soane & Paul Willman
1 × $6.00
Traders: Risks, Decisions, and Management in Financial Markets - Mark Fenton-O’Creevy, Nigel Nicholson, Emma Soane & Paul Willman
1 × $6.00 -
×
 Order flow self-study training program with iMFtracker
1 × $10.00
Order flow self-study training program with iMFtracker
1 × $10.00 -
×
 Market Tide indicator with Alphashark
1 × $54.00
Market Tide indicator with Alphashark
1 × $54.00 -
×
 WondaFX Signature Strategy with WondaFX
1 × $5.00
WondaFX Signature Strategy with WondaFX
1 × $5.00 -
×
 Crypto Trading Academy with Cheeky Investor - Aussie Day Trader
1 × $13.00
Crypto Trading Academy with Cheeky Investor - Aussie Day Trader
1 × $13.00 -
×
 The Orderflow Masterclass with PrimeTrading
1 × $17.00
The Orderflow Masterclass with PrimeTrading
1 × $17.00 -
×
 Pattern Picking with Charles Drummond
1 × $6.00
Pattern Picking with Charles Drummond
1 × $6.00 -
×
 Gann Trade Real Time with Larry B.Jacobs
1 × $6.00
Gann Trade Real Time with Larry B.Jacobs
1 × $6.00 -
×
 Optionetics 2007 - Home Study Course, MP3
1 × $6.00
Optionetics 2007 - Home Study Course, MP3
1 × $6.00 -
×
 Capital with Charles D.Ellis
1 × $6.00
Capital with Charles D.Ellis
1 × $6.00 -
×
 Better Trading with the Guppy Multiple Moving Average WorkBook with Daryl Guppy
1 × $6.00
Better Trading with the Guppy Multiple Moving Average WorkBook with Daryl Guppy
1 × $6.00 -
×
 Art & Science of Trend Trading Class with Jeff Bierman
1 × $6.00
Art & Science of Trend Trading Class with Jeff Bierman
1 × $6.00 -
×
 AI For Traders with Trading Markets
1 × $31.00
AI For Traders with Trading Markets
1 × $31.00 -
×
 Multi Asset Class Investment Strategy with Guy Fraser-Sampson
1 × $6.00
Multi Asset Class Investment Strategy with Guy Fraser-Sampson
1 × $6.00 -
×
 Hedged Strategy Series in Volatile Markets All 4 with Dan Sheridan
1 × $15.00
Hedged Strategy Series in Volatile Markets All 4 with Dan Sheridan
1 × $15.00 -
×
 The Complete Turtle Trader with Michael Covel
1 × $6.00
The Complete Turtle Trader with Michael Covel
1 × $6.00 -
×
 Directional Calendars in 2023 with Dan Sheridan & Mark Fenton - Sheridan Options Mentoring
1 × $85.00
Directional Calendars in 2023 with Dan Sheridan & Mark Fenton - Sheridan Options Mentoring
1 × $85.00 -
×
 7 Day FX Mastery Course with Market Masters
1 × $6.00
7 Day FX Mastery Course with Market Masters
1 × $6.00 -
×
 Altucher’s Top 1% Advisory Newsletter 2016 with James Altucher
1 × $6.00
Altucher’s Top 1% Advisory Newsletter 2016 with James Altucher
1 × $6.00 -
×
 The Best of the Professional Traders Journal. Market Timing with Larry Connors
1 × $6.00
The Best of the Professional Traders Journal. Market Timing with Larry Connors
1 × $6.00 -
×
 The Taylor Trading Technique with G.Douglas Taylor
1 × $6.00
The Taylor Trading Technique with G.Douglas Taylor
1 × $6.00 -
×
 5-Week Portfolio (No Bonus) - Criticaltrading
1 × $39.00
5-Week Portfolio (No Bonus) - Criticaltrading
1 × $39.00 -
×
 Planetary Stock Trading with Bill Meridian
1 × $6.00
Planetary Stock Trading with Bill Meridian
1 × $6.00 -
×
 Simple Sector Trading Strategies with John Murphy
1 × $6.00
Simple Sector Trading Strategies with John Murphy
1 × $6.00 -
×
 The Best (Public) Trading Methods I’ve Found for Futures & Equities with Perry J.Kaufman
1 × $6.00
The Best (Public) Trading Methods I’ve Found for Futures & Equities with Perry J.Kaufman
1 × $6.00 -
×
 0 DTE Options Trading Workshop with Aeromir Corporation
1 × $15.00
0 DTE Options Trading Workshop with Aeromir Corporation
1 × $15.00 -
×
 Simpler Options - Weekly Butterflies for Income
1 × $6.00
Simpler Options - Weekly Butterflies for Income
1 × $6.00 -
×
 The Practical Handbook of Genetic Algorithms with Lance Chambers
1 × $6.00
The Practical Handbook of Genetic Algorithms with Lance Chambers
1 × $6.00 -
×
 Option Trading: Pricing and Volatility Strategies and Techniques with Euan Sinclair
1 × $6.00
Option Trading: Pricing and Volatility Strategies and Techniques with Euan Sinclair
1 × $6.00 -
×
 Catching the Big Moves with Jack Bernstein
1 × $6.00
Catching the Big Moves with Jack Bernstein
1 × $6.00 -
×
 Learn To Profit From The Forex Market with FX Hustle
1 × $6.00
Learn To Profit From The Forex Market with FX Hustle
1 × $6.00 -
×
 $20 – 52k 20 pips a day challange with Rafał Zuchowicz - TopMasterTrader
1 × $5.00
$20 – 52k 20 pips a day challange with Rafał Zuchowicz - TopMasterTrader
1 × $5.00 -
×
 Fractal Markets SFX with Tyson Bieniek
1 × $5.00
Fractal Markets SFX with Tyson Bieniek
1 × $5.00 -
×
 Fierce 10 On Demand Coaching Program with High Performance Trading
1 × $5.00
Fierce 10 On Demand Coaching Program with High Performance Trading
1 × $5.00 -
×
 The Trading Blueprint with Brad Goh - The Trading Geek
1 × $5.00
The Trading Blueprint with Brad Goh - The Trading Geek
1 × $5.00 -
×
 30 Trading Classics with 3T Live
1 × $5.00
30 Trading Classics with 3T Live
1 × $5.00 -
×
 Range Trading with D.Singleton
1 × $6.00
Range Trading with D.Singleton
1 × $6.00 -
×
 Volatility Position Risk Management with Cynthia Kase
1 × $6.00
Volatility Position Risk Management with Cynthia Kase
1 × $6.00 -
×
 Sensitivity Analysis in Practice
1 × $6.00
Sensitivity Analysis in Practice
1 × $6.00 -
×
 Advanced Spread Trading with Guy Bower - MasterClass Trader
1 × $15.00
Advanced Spread Trading with Guy Bower - MasterClass Trader
1 × $15.00 -
×
 SOT Advanced Course (May 2014)
1 × $23.00
SOT Advanced Course (May 2014)
1 × $23.00 -
×
 Butterfly and Condor Workshop with Aeromir
1 × $15.00
Butterfly and Condor Workshop with Aeromir
1 × $15.00

Forex Shockwave Analysis with James Bickford
$6.00
File Size: Coming soon!
Delivery Time: 1–12 hours
Media Type: Online Course
Content Proof: Watch Here!
You may check content proof of “Forex Shockwave Analysis with James Bickford” below:

Forex Shockwave Analysis with James Bickford
Navigating the turbulent waters of forex trading can be a daunting task. James Bickford’s “Forex Shockwave Analysis” provides traders with a powerful tool to decipher market movements and make informed trading decisions. This article will guide you through the key concepts and practical applications of Forex Shockwave Analysis, helping you enhance your trading strategy.
Understanding Forex Shockwave Analysis
What is Forex Shockwave Analysis?
Forex Shockwave Analysis is a method of analyzing forex market movements by identifying and interpreting significant price shocks. These shocks often precede major market trends and can be used to predict future price movements.
The Genesis of Shockwave Analysis
James Bickford developed this analysis technique to help traders identify market disruptions that lead to significant price changes. It combines elements of technical and fundamental analysis to provide a comprehensive view of the market.
Key Components of Shockwave Analysis
Identifying Price Shocks
Price shocks are sudden, unexpected changes in the price of a currency pair. These shocks can be caused by various factors, including economic data releases, geopolitical events, and market sentiment shifts.
Analyzing Shockwave Patterns
Shockwave patterns are formed by the price movements following a shock. These patterns can be categorized into different types, such as continuation patterns, reversal patterns, and consolidation patterns.
Applying Shockwave Analysis to Forex Trading
Spotting Shockwave Patterns
To spot shockwave patterns, traders need to monitor the market for sudden price changes and analyze the subsequent price movements. Tools like candlestick charts and moving averages can be helpful in this process.
Using Shockwave Analysis for Entry and Exit Points
Shockwave Analysis can help traders identify optimal entry and exit points. For example, a strong continuation pattern following a price shock can indicate a good entry point, while a reversal pattern may signal an exit point.
Technical Tools for Shockwave Analysis
Candlestick Charts
Candlestick charts are essential for identifying shockwave patterns. They provide a visual representation of price movements and help traders spot key patterns like hammers, dojis, and engulfing patterns.
Moving Averages
Moving averages smooth out price data and help identify the overall trend. They can also be used to confirm shockwave patterns and provide additional entry and exit signals.
Relative Strength Index (RSI)
The RSI measures the speed and change of price movements. It can help traders identify overbought or oversold conditions, which are often associated with price shocks.
Fundamental Factors Influencing Price Shocks
Economic Data Releases
Economic indicators such as GDP growth, employment figures, and inflation rates can cause significant price shocks. Traders need to stay informed about upcoming data releases and their potential impact on the market.
Geopolitical Events
Geopolitical events, including elections, trade negotiations, and conflicts, can lead to sudden market movements. Understanding these events and their potential implications is crucial for successful shockwave analysis.
Shockwave Analysis in Different Market Conditions
Bullish Markets
In bullish markets, shockwave patterns often indicate strong continuation trends. Traders can use these patterns to identify buying opportunities and ride the upward momentum.
Bearish Markets
In bearish markets, shockwave patterns may signal potential reversals or continuation of downward trends. Traders should be cautious and look for confirmation before entering trades.
Sideways Markets
In sideways markets, shockwave patterns can indicate potential breakouts or breakdowns. Traders should be prepared for increased volatility and adjust their strategies accordingly.
Case Studies of Shockwave Analysis
Case Study 1: Economic Data Release
A trader identifies a price shock following a strong employment report. Using shockwave analysis, the trader spots a continuation pattern and enters a long position, capitalizing on the upward trend.
Case Study 2: Geopolitical Event
A sudden geopolitical event causes a price shock in the forex market. The trader identifies a reversal pattern using shockwave analysis and exits a short position, avoiding potential losses.
Common Mistakes in Shockwave Analysis
Overlooking Market Context
One common mistake is ignoring the broader market context when analyzing price shocks. Traders should consider other technical indicators and fundamental factors to avoid false signals.
Relying Solely on Shockwave Patterns
While shockwave patterns are powerful, they should not be used in isolation. Combining them with other analysis techniques can improve accuracy and trading outcomes.
Advanced Shockwave Analysis Techniques
Multiple Time Frame Analysis
Analyzing price shocks across different time frames can provide a more comprehensive view of the market. This technique helps traders identify long-term trends and short-term entry points.
Volume Analysis
Volume analysis can confirm the strength of a price shock. High trading volume following a price shock indicates strong market participation and can validate the shockwave pattern.
Psychological Aspects of Shockwave Trading
Managing Emotional Reactions
Price shocks can evoke strong emotional reactions. Traders need to remain calm and stick to their analysis to avoid impulsive decisions.
Building Confidence
Confidence in shockwave analysis comes with experience. Practicing the identification and interpretation of shockwave patterns will improve trading skills and outcomes.
Conclusion
Forex Shockwave Analysis, as pioneered by James Bickford, offers a unique approach to understanding market movements. By identifying and interpreting price shocks, traders can enhance their trading strategies and make informed decisions. Remember, combining shockwave analysis with other technical and fundamental tools, and maintaining emotional discipline, is key to successful trading.
FAQs
1. What makes Forex Shockwave Analysis unique?
Forex Shockwave Analysis focuses on identifying and interpreting sudden price shocks, providing a unique perspective on market movements.
2. Can shockwave analysis be used for all currency pairs?
Yes, shockwave analysis can be applied to any currency pair. However, the effectiveness may vary depending on market conditions and the specific pair.
3. How do economic data releases impact shockwave patterns?
Economic data releases often cause significant price shocks, leading to the formation of shockwave patterns. Traders should monitor these releases closely.
4. Is it necessary to use other technical indicators with shockwave analysis?
While shockwave analysis is powerful, using it in conjunction with other technical indicators can improve accuracy and trading outcomes.
5. How can I improve my skills in shockwave analysis?
Regular practice, continuous learning, and analyzing historical price shocks can help improve your skills in shockwave analysis.
Be the first to review “Forex Shockwave Analysis with James Bickford”
You must be logged in to post a review.
Related products
Forex Trading
Original price was: $239.00.$8.00Current price is: $8.00.
Forex Trading
Original price was: $1,898.00.$10.00Current price is: $10.00.
Original price was: $1,200.00.$23.00Current price is: $23.00.

Original price was: $695.00.$41.00Current price is: $41.00.
Forex Trading
The Complete Guide to Multiple Time Frame Analysis & Reading Price Action with Aiman Almansoori
Original price was: $1,399.00.$13.00Current price is: $13.00.
Forex Trading
Original price was: $799.00.$15.00Current price is: $15.00.

Original price was: $799.00.$15.00Current price is: $15.00.

Original price was: $497.00.$31.00Current price is: $31.00.
Original price was: $1,800.00.$54.00Current price is: $54.00.

Forex Trading
Original price was: $797.00.$10.00Current price is: $10.00.
Original price was: $997.00.$13.00Current price is: $13.00.

Original price was: $497.00.$11.00Current price is: $11.00.
Original price was: $310.00.$23.00Current price is: $23.00.
Forex Trading
Original price was: $697.00.$5.00Current price is: $5.00.
Original price was: $1,849.00.$15.00Current price is: $15.00.
Forex Trading
Original price was: $249.00.$15.00Current price is: $15.00.
Forex Trading
Original price was: $999.00.$15.00Current price is: $15.00.

Original price was: $997.00.$8.00Current price is: $8.00.
Original price was: $895.00.$15.00Current price is: $15.00.

Forex Trading
Original price was: $850.00.$23.00Current price is: $23.00.
Reviews
There are no reviews yet.