-
×
 Momentum Mastery with Traderlion Richard Moglen & Ben Bennett
1 × $15.00
Momentum Mastery with Traderlion Richard Moglen & Ben Bennett
1 × $15.00 -
×
 W. D Gann 's Square Of 9 Applied To Modern Markets with Sean Avidar - Hexatrade350
1 × $23.00
W. D Gann 's Square Of 9 Applied To Modern Markets with Sean Avidar - Hexatrade350
1 × $23.00 -
×
 Proven Swing Trading Strat & Multiple Time Frame Analysis - Robert Krausz & Thom Hartle
1 × $6.00
Proven Swing Trading Strat & Multiple Time Frame Analysis - Robert Krausz & Thom Hartle
1 × $6.00 -
×
 Algo Trading Masterclass with Ali Casey - StatOasis
1 × $23.00
Algo Trading Masterclass with Ali Casey - StatOasis
1 × $23.00 -
×
 Crystal Ball Pack PLUS bonus Live Trade By Pat Mitchell - Trick Trades
1 × $20.00
Crystal Ball Pack PLUS bonus Live Trade By Pat Mitchell - Trick Trades
1 × $20.00 -
×
 The A14 Weekly Option Strategy Workshop with Amy Meissner
1 × $23.00
The A14 Weekly Option Strategy Workshop with Amy Meissner
1 × $23.00 -
×
 Trading Short TermSame Day Trades Sep 2023 with Dan Sheridan & Mark Fenton - Sheridan Options Mentoring
1 × $31.00
Trading Short TermSame Day Trades Sep 2023 with Dan Sheridan & Mark Fenton - Sheridan Options Mentoring
1 × $31.00 -
×
 Essentials in Quantitative Trading QT01 By HangukQuant's
1 × $23.00
Essentials in Quantitative Trading QT01 By HangukQuant's
1 × $23.00 -
×
 Matrix Spread Options Trading Course with Base Camp Trading
1 × $31.00
Matrix Spread Options Trading Course with Base Camp Trading
1 × $31.00 -
×
 The Complete Guide to Multiple Time Frame Analysis & Reading Price Action with Aiman Almansoori
1 × $13.00
The Complete Guide to Multiple Time Frame Analysis & Reading Price Action with Aiman Almansoori
1 × $13.00 -
×
 Scalp Strategy and Flipping Small Accounts with Opes Trading Group
1 × $5.00
Scalp Strategy and Flipping Small Accounts with Opes Trading Group
1 × $5.00 -
×
 Rise Precision Latest Course
1 × $10.00
Rise Precision Latest Course
1 × $10.00 -
×
 The Naked Eye: Raw Data Analytics with Edgar Torres - Raw Data Analytics
1 × $8.00
The Naked Eye: Raw Data Analytics with Edgar Torres - Raw Data Analytics
1 × $8.00 -
×
 Technical Timing Patterns
1 × $6.00
Technical Timing Patterns
1 × $6.00 -
×
 Order flow self-study training program with iMFtracker
1 × $10.00
Order flow self-study training program with iMFtracker
1 × $10.00 -
×
 Predicting Next Weeks’s Range with Charles Drummond
1 × $6.00
Predicting Next Weeks’s Range with Charles Drummond
1 × $6.00 -
×
 Fundamentals of Futures & Options Markets (4th Ed.)
1 × $6.00
Fundamentals of Futures & Options Markets (4th Ed.)
1 × $6.00 -
×
 Advanced Spread Trading with Guy Bower - MasterClass Trader
1 × $15.00
Advanced Spread Trading with Guy Bower - MasterClass Trader
1 × $15.00 -
×
 Astro Models (techedgecycles.com) with Yuri Shramenko
1 × $6.00
Astro Models (techedgecycles.com) with Yuri Shramenko
1 × $6.00 -
×
 The Trading Blueprint with Brad Goh - The Trading Geek
1 × $5.00
The Trading Blueprint with Brad Goh - The Trading Geek
1 × $5.00 -
×
 Multi Squeeze Pro Indicator (PREMIUM)
1 × $69.00
Multi Squeeze Pro Indicator (PREMIUM)
1 × $69.00 -
×
 Natural Squares Calculator with Lambert-Gann Educators
1 × $6.00
Natural Squares Calculator with Lambert-Gann Educators
1 × $6.00 -
×
 What Products to Watch and Why Class with Don Kaufman
1 × $6.00
What Products to Watch and Why Class with Don Kaufman
1 × $6.00 -
×
 Precision Pattern Trading Workbook with Daryl Guppy
1 × $6.00
Precision Pattern Trading Workbook with Daryl Guppy
1 × $6.00 -
×
 TRADING NFX Course with Andrew NFX
1 × $5.00
TRADING NFX Course with Andrew NFX
1 × $5.00 -
×
 Game Plan of a Winning Trader with Mike Podwojski & Vic Noble
1 × $6.00
Game Plan of a Winning Trader with Mike Podwojski & Vic Noble
1 × $6.00 -
×
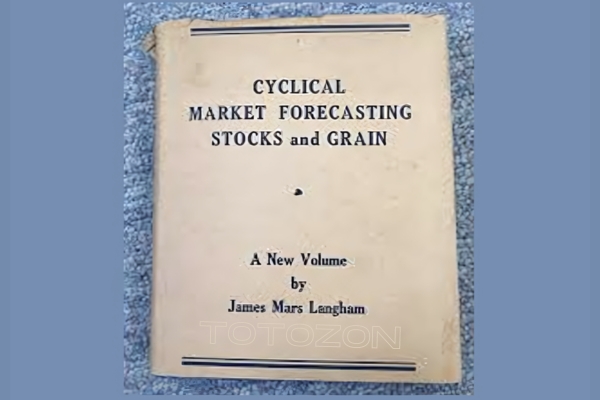 Market Forecasting. Stocks and Grain
1 × $6.00
Market Forecasting. Stocks and Grain
1 × $6.00 -
×
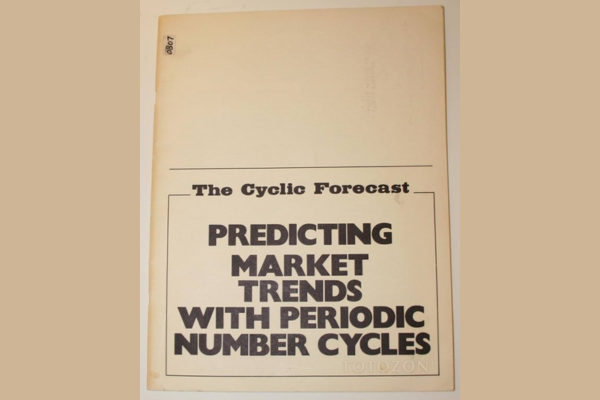 Predicting Market Trends with Periodic Number Cycle
1 × $6.00
Predicting Market Trends with Periodic Number Cycle
1 × $6.00 -
×
 Reminiscences of a Stock Operator (75th Aniversary Ed.) with Edwin Lefevre
1 × $6.00
Reminiscences of a Stock Operator (75th Aniversary Ed.) with Edwin Lefevre
1 × $6.00 -
×
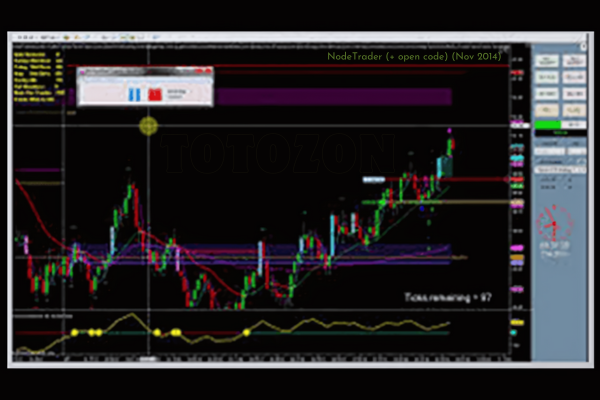 NodeTrader (+ open code) (Nov 2014)
1 × $6.00
NodeTrader (+ open code) (Nov 2014)
1 × $6.00 -
×
 Options Trading with Nick & Gareth - Nick Santiago & Gareth Soloway - InTheMoneyStocks
1 × $31.00
Options Trading with Nick & Gareth - Nick Santiago & Gareth Soloway - InTheMoneyStocks
1 × $31.00 -
×
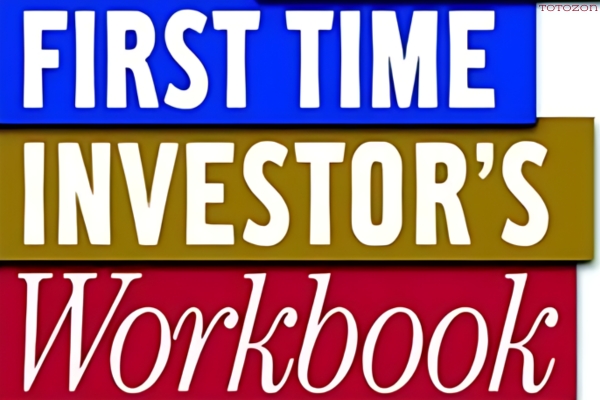 The First Time Investors Workbook with Joe Jonh Duran & Larry Chambers
1 × $6.00
The First Time Investors Workbook with Joe Jonh Duran & Larry Chambers
1 × $6.00 -
×
 IBD Home Study Course Package with Investor's Business Daily
1 × $17.00
IBD Home Study Course Package with Investor's Business Daily
1 × $17.00 -
×
 Learning Track: Quantitative Approach in Options Trading
1 × $39.00
Learning Track: Quantitative Approach in Options Trading
1 × $39.00 -
×
 Marber on Markets – How to Make Money from Charts with Brian Marber
1 × $6.00
Marber on Markets – How to Make Money from Charts with Brian Marber
1 × $6.00 -
×
 Introduction to Futures & Options Markets (2nd Ed.)
1 × $6.00
Introduction to Futures & Options Markets (2nd Ed.)
1 × $6.00 -
×
 Ultimate Trading Course with Dodgy's Dungeon
1 × $8.00
Ultimate Trading Course with Dodgy's Dungeon
1 × $8.00 -
×
 Forex Mentor - FX Winning Strategies
1 × $15.00
Forex Mentor - FX Winning Strategies
1 × $15.00 -
×
 Speculating with Futures and Traditional Commodities with Liverpool Group
1 × $6.00
Speculating with Futures and Traditional Commodities with Liverpool Group
1 × $6.00 -
×
 Pro Tradeciety FOREX TRADING ACADEMY
1 × $31.00
Pro Tradeciety FOREX TRADING ACADEMY
1 × $31.00 -
×
 The Indices Orderflow Masterclass with The Forex Scalpers
1 × $23.00
The Indices Orderflow Masterclass with The Forex Scalpers
1 × $23.00 -
×
 Compound Stock Earnings Advanced Charting (Video 1.19 GB)
1 × $15.00
Compound Stock Earnings Advanced Charting (Video 1.19 GB)
1 × $15.00 -
×
 KASH-FX JOURNAL
1 × $10.00
KASH-FX JOURNAL
1 × $10.00 -
×
 $20 – 52k 20 pips a day challange with Rafał Zuchowicz - TopMasterTrader
1 × $5.00
$20 – 52k 20 pips a day challange with Rafał Zuchowicz - TopMasterTrader
1 × $5.00 -
×
 Butterfly and Condor Workshop with Aeromir
1 × $15.00
Butterfly and Condor Workshop with Aeromir
1 × $15.00 -
×
 Crypto Trading Academy with Cheeky Investor - Aussie Day Trader
1 × $13.00
Crypto Trading Academy with Cheeky Investor - Aussie Day Trader
1 × $13.00 -
×
 The Prop Trading Code with Brannigan Barrett - Axia Futures
1 × $23.00
The Prop Trading Code with Brannigan Barrett - Axia Futures
1 × $23.00 -
×
 TradeCraft: Your Path to Peak Performance Trading By Adam Grimes
1 × $15.00
TradeCraft: Your Path to Peak Performance Trading By Adam Grimes
1 × $15.00 -
×
 The Best Option Trading Course with David Jaffee - Best Stock Strategy
1 × $15.00
The Best Option Trading Course with David Jaffee - Best Stock Strategy
1 × $15.00 -
×
 SQX Mentorship with Tip Toe Hippo
1 × $23.00
SQX Mentorship with Tip Toe Hippo
1 × $23.00 -
×
 Compass Trading System with Right Line Trading
1 × $39.00
Compass Trading System with Right Line Trading
1 × $39.00 -
×
 High Probability Trading Using Elliott Wave And Fibonacci Analysis withVic Patel - Forex Training Group
1 × $10.00
High Probability Trading Using Elliott Wave And Fibonacci Analysis withVic Patel - Forex Training Group
1 × $10.00 -
×
 Be Smart, Act Fast, Get Rich with Charles Payne
1 × $6.00
Be Smart, Act Fast, Get Rich with Charles Payne
1 × $6.00 -
×
 Pete Fader VSA Course
1 × $6.00
Pete Fader VSA Course
1 × $6.00 -
×
 Right Line Trading IndicatorSuite (May 2015)
1 × $31.00
Right Line Trading IndicatorSuite (May 2015)
1 × $31.00 -
×
 FlowRider Trading Course with Boris Schlossberg and Kathy Lien - Bkforex
1 × $15.00
FlowRider Trading Course with Boris Schlossberg and Kathy Lien - Bkforex
1 × $15.00 -
×
 Essential Skills for Consistency in Trading Class with Don Kaufman
1 × $6.00
Essential Skills for Consistency in Trading Class with Don Kaufman
1 × $6.00 -
×
 Quantitative Trading and Money Management, Revised Edition (5th Edition) with Fred Gehm
1 × $6.00
Quantitative Trading and Money Management, Revised Edition (5th Edition) with Fred Gehm
1 × $6.00 -
×
 Elite Mentorship Home Study - 3T Live with Sami Abusaad
1 × $5.00
Elite Mentorship Home Study - 3T Live with Sami Abusaad
1 × $5.00 -
×
 90 Days To Trade MasterClass with Jerremy Newsome & Matt Delong - Real Life Trading
1 × $104.00
90 Days To Trade MasterClass with Jerremy Newsome & Matt Delong - Real Life Trading
1 × $104.00 -
×
 Million Dollar Bond Strategies Video with Paul Judd
1 × $6.00
Million Dollar Bond Strategies Video with Paul Judd
1 × $6.00 -
×
 MAP. Moving Average Patterns CD with David Elliott
1 × $6.00
MAP. Moving Average Patterns CD with David Elliott
1 × $6.00 -
×
 Defending Options with Simpler Options
1 × $6.00
Defending Options with Simpler Options
1 × $6.00 -
×
 The 30-Day Cash Flow Blueprint with Andy Tanner
1 × $31.00
The 30-Day Cash Flow Blueprint with Andy Tanner
1 × $31.00 -
×
 Zap Seminar - Ablesys
1 × $6.00
Zap Seminar - Ablesys
1 × $6.00 -
×
 Original Curriculum with Home Options Trading Course
1 × $6.00
Original Curriculum with Home Options Trading Course
1 × $6.00 -
×
 How To Develop A Winning Trading System That Fits You Home Study + Audio - 2020 with Van Tharp
1 × $62.00
How To Develop A Winning Trading System That Fits You Home Study + Audio - 2020 with Van Tharp
1 × $62.00 -
×
 HunterFX Video Course with HunterFX
1 × $6.00
HunterFX Video Course with HunterFX
1 × $6.00 -
×
 Smart Money Course with Forex XL
1 × $6.00
Smart Money Course with Forex XL
1 × $6.00 -
×
 Ron Wagner - Creating a Profitable Trading & Investing Plan + Techniques to Perfect Your Intraday GAP
1 × $6.00
Ron Wagner - Creating a Profitable Trading & Investing Plan + Techniques to Perfect Your Intraday GAP
1 × $6.00 -
×
 Market Tide indicator with Alphashark
1 × $54.00
Market Tide indicator with Alphashark
1 × $54.00 -
×
 Investing Smart. How to Pick Stocks with Investors Business Daily By Dhun H.Sethna
1 × $4.00
Investing Smart. How to Pick Stocks with Investors Business Daily By Dhun H.Sethna
1 × $4.00 -
×
 Quantamentals - The Next Great Forefront Of Trading and Investing with Trading Markets
1 × $8.00
Quantamentals - The Next Great Forefront Of Trading and Investing with Trading Markets
1 × $8.00 -
×
 FOREX Master Blueprint 2010 - 1 DVD + Manual with Forexmentor Frank Paul
1 × $6.00
FOREX Master Blueprint 2010 - 1 DVD + Manual with Forexmentor Frank Paul
1 × $6.00 -
×
 The Complete Guide to Option Selling, 2nd 2009 with James Cordier & Michael Gross
1 × $6.00
The Complete Guide to Option Selling, 2nd 2009 with James Cordier & Michael Gross
1 × $6.00 -
×
 0 DTE Options Trading Workshop with Aeromir Corporation
1 × $15.00
0 DTE Options Trading Workshop with Aeromir Corporation
1 × $15.00 -
×
 Home Run Options Trading Course with Dave Aquino - Base Camp Trading
1 × $11.00
Home Run Options Trading Course with Dave Aquino - Base Camp Trading
1 × $11.00 -
×
 The Orderflow Masterclass with PrimeTrading
1 × $17.00
The Orderflow Masterclass with PrimeTrading
1 × $17.00

Forex Shockwave Analysis with James Bickford
$6.00
File Size: Coming soon!
Delivery Time: 1–12 hours
Media Type: Online Course
Content Proof: Watch Here!
You may check content proof of “Forex Shockwave Analysis with James Bickford” below:

Forex Shockwave Analysis with James Bickford
Navigating the turbulent waters of forex trading can be a daunting task. James Bickford’s “Forex Shockwave Analysis” provides traders with a powerful tool to decipher market movements and make informed trading decisions. This article will guide you through the key concepts and practical applications of Forex Shockwave Analysis, helping you enhance your trading strategy.
Understanding Forex Shockwave Analysis
What is Forex Shockwave Analysis?
Forex Shockwave Analysis is a method of analyzing forex market movements by identifying and interpreting significant price shocks. These shocks often precede major market trends and can be used to predict future price movements.
The Genesis of Shockwave Analysis
James Bickford developed this analysis technique to help traders identify market disruptions that lead to significant price changes. It combines elements of technical and fundamental analysis to provide a comprehensive view of the market.
Key Components of Shockwave Analysis
Identifying Price Shocks
Price shocks are sudden, unexpected changes in the price of a currency pair. These shocks can be caused by various factors, including economic data releases, geopolitical events, and market sentiment shifts.
Analyzing Shockwave Patterns
Shockwave patterns are formed by the price movements following a shock. These patterns can be categorized into different types, such as continuation patterns, reversal patterns, and consolidation patterns.
Applying Shockwave Analysis to Forex Trading
Spotting Shockwave Patterns
To spot shockwave patterns, traders need to monitor the market for sudden price changes and analyze the subsequent price movements. Tools like candlestick charts and moving averages can be helpful in this process.
Using Shockwave Analysis for Entry and Exit Points
Shockwave Analysis can help traders identify optimal entry and exit points. For example, a strong continuation pattern following a price shock can indicate a good entry point, while a reversal pattern may signal an exit point.
Technical Tools for Shockwave Analysis
Candlestick Charts
Candlestick charts are essential for identifying shockwave patterns. They provide a visual representation of price movements and help traders spot key patterns like hammers, dojis, and engulfing patterns.
Moving Averages
Moving averages smooth out price data and help identify the overall trend. They can also be used to confirm shockwave patterns and provide additional entry and exit signals.
Relative Strength Index (RSI)
The RSI measures the speed and change of price movements. It can help traders identify overbought or oversold conditions, which are often associated with price shocks.
Fundamental Factors Influencing Price Shocks
Economic Data Releases
Economic indicators such as GDP growth, employment figures, and inflation rates can cause significant price shocks. Traders need to stay informed about upcoming data releases and their potential impact on the market.
Geopolitical Events
Geopolitical events, including elections, trade negotiations, and conflicts, can lead to sudden market movements. Understanding these events and their potential implications is crucial for successful shockwave analysis.
Shockwave Analysis in Different Market Conditions
Bullish Markets
In bullish markets, shockwave patterns often indicate strong continuation trends. Traders can use these patterns to identify buying opportunities and ride the upward momentum.
Bearish Markets
In bearish markets, shockwave patterns may signal potential reversals or continuation of downward trends. Traders should be cautious and look for confirmation before entering trades.
Sideways Markets
In sideways markets, shockwave patterns can indicate potential breakouts or breakdowns. Traders should be prepared for increased volatility and adjust their strategies accordingly.
Case Studies of Shockwave Analysis
Case Study 1: Economic Data Release
A trader identifies a price shock following a strong employment report. Using shockwave analysis, the trader spots a continuation pattern and enters a long position, capitalizing on the upward trend.
Case Study 2: Geopolitical Event
A sudden geopolitical event causes a price shock in the forex market. The trader identifies a reversal pattern using shockwave analysis and exits a short position, avoiding potential losses.
Common Mistakes in Shockwave Analysis
Overlooking Market Context
One common mistake is ignoring the broader market context when analyzing price shocks. Traders should consider other technical indicators and fundamental factors to avoid false signals.
Relying Solely on Shockwave Patterns
While shockwave patterns are powerful, they should not be used in isolation. Combining them with other analysis techniques can improve accuracy and trading outcomes.
Advanced Shockwave Analysis Techniques
Multiple Time Frame Analysis
Analyzing price shocks across different time frames can provide a more comprehensive view of the market. This technique helps traders identify long-term trends and short-term entry points.
Volume Analysis
Volume analysis can confirm the strength of a price shock. High trading volume following a price shock indicates strong market participation and can validate the shockwave pattern.
Psychological Aspects of Shockwave Trading
Managing Emotional Reactions
Price shocks can evoke strong emotional reactions. Traders need to remain calm and stick to their analysis to avoid impulsive decisions.
Building Confidence
Confidence in shockwave analysis comes with experience. Practicing the identification and interpretation of shockwave patterns will improve trading skills and outcomes.
Conclusion
Forex Shockwave Analysis, as pioneered by James Bickford, offers a unique approach to understanding market movements. By identifying and interpreting price shocks, traders can enhance their trading strategies and make informed decisions. Remember, combining shockwave analysis with other technical and fundamental tools, and maintaining emotional discipline, is key to successful trading.
FAQs
1. What makes Forex Shockwave Analysis unique?
Forex Shockwave Analysis focuses on identifying and interpreting sudden price shocks, providing a unique perspective on market movements.
2. Can shockwave analysis be used for all currency pairs?
Yes, shockwave analysis can be applied to any currency pair. However, the effectiveness may vary depending on market conditions and the specific pair.
3. How do economic data releases impact shockwave patterns?
Economic data releases often cause significant price shocks, leading to the formation of shockwave patterns. Traders should monitor these releases closely.
4. Is it necessary to use other technical indicators with shockwave analysis?
While shockwave analysis is powerful, using it in conjunction with other technical indicators can improve accuracy and trading outcomes.
5. How can I improve my skills in shockwave analysis?
Regular practice, continuous learning, and analyzing historical price shocks can help improve your skills in shockwave analysis.
Be the first to review “Forex Shockwave Analysis with James Bickford”
You must be logged in to post a review.
Related products

Forex Trading
Original price was: $4,997.00.$27.00Current price is: $27.00.
Forex Trading
Original price was: $1,098.00.$39.00Current price is: $39.00.
Forex Trading
The Complete Guide to Multiple Time Frame Analysis & Reading Price Action with Aiman Almansoori
Original price was: $1,399.00.$13.00Current price is: $13.00.
Original price was: $310.00.$23.00Current price is: $23.00.

Original price was: $700.00.$39.00Current price is: $39.00.
Forex Trading
Original price was: $397.00.$31.00Current price is: $31.00.
Original price was: $497.00.$11.00Current price is: $11.00.
Original price was: $997.00.$13.00Current price is: $13.00.
Forex Trading
Original price was: $2,000.00.$23.00Current price is: $23.00.
Forex Trading
Quantamentals – The Next Great Forefront Of Trading and Investing with Trading Markets
Original price was: $1,495.00.$8.00Current price is: $8.00.
Original price was: $895.00.$15.00Current price is: $15.00.
Original price was: $450.00.$23.00Current price is: $23.00.

Original price was: $695.00.$41.00Current price is: $41.00.

Forex Trading
Original price was: $550.00.$5.00Current price is: $5.00.
Original price was: $4,995.00.$15.00Current price is: $15.00.
Forex Trading
Original price was: $125.00.$17.00Current price is: $17.00.
Original price was: $497.00.$31.00Current price is: $31.00.

Original price was: $1,800.00.$54.00Current price is: $54.00.
Original price was: $139.00.$23.00Current price is: $23.00.

Original price was: $299.00.$8.00Current price is: $8.00.
Reviews
There are no reviews yet.