-
×
 CrewFX Group Course Package with Language Of The Markets
1 × $6.00
CrewFX Group Course Package with Language Of The Markets
1 × $6.00 -
×
 Options Trading & Ultimate MasterClass With Tyrone Abela - FX Evolution
1 × $54.00
Options Trading & Ultimate MasterClass With Tyrone Abela - FX Evolution
1 × $54.00 -
×
 Price Action Trading Manual 2010
1 × $6.00
Price Action Trading Manual 2010
1 × $6.00 -
×
 Physicists on Wall Street and Other Essays on Science and Society with Jeremy Bernstein
1 × $6.00
Physicists on Wall Street and Other Essays on Science and Society with Jeremy Bernstein
1 × $6.00 -
×
 Home Run Options Trading Course with Dave Aquino - Base Camp Trading
1 × $11.00
Home Run Options Trading Course with Dave Aquino - Base Camp Trading
1 × $11.00 -
×
 Super CD Companion for Metastock with Martin Pring
1 × $6.00
Super CD Companion for Metastock with Martin Pring
1 × $6.00 -
×
 AI For Traders with Trading Markets
1 × $31.00
AI For Traders with Trading Markets
1 × $31.00 -
×
 Bird Watching in Lion Country. Retail Forex Explained with Dirk Du Toit
1 × $4.00
Bird Watching in Lion Country. Retail Forex Explained with Dirk Du Toit
1 × $4.00 -
×
 Pattern- Price & Time. Using Gann Theory in Trading Systems (2nd Ed.)
1 × $6.00
Pattern- Price & Time. Using Gann Theory in Trading Systems (2nd Ed.)
1 × $6.00 -
×
 ETF Trading Strategies Revealed with David Vomund
1 × $6.00
ETF Trading Strategies Revealed with David Vomund
1 × $6.00 -
×
 Forex Education Trading System (Video 469 MB)
1 × $23.00
Forex Education Trading System (Video 469 MB)
1 × $23.00 -
×
 Essential Stock Picking Strategies with Daniel Strachman
1 × $6.00
Essential Stock Picking Strategies with Daniel Strachman
1 × $6.00 -
×
 Essentials in Quantitative Trading QT01 By HangukQuant's
1 × $23.00
Essentials in Quantitative Trading QT01 By HangukQuant's
1 × $23.00 -
×
 The Orderflow Masterclass with PrimeTrading
1 × $17.00
The Orderflow Masterclass with PrimeTrading
1 × $17.00 -
×
 How to Find the Most Profitable Stocks with Mubarak Shah
1 × $6.00
How to Find the Most Profitable Stocks with Mubarak Shah
1 × $6.00 -
×
 Dominate Stocks (Swing Trading) 2023 with J. Bravo
1 × $5.00
Dominate Stocks (Swing Trading) 2023 with J. Bravo
1 × $5.00 -
×
 How To Trade Forex Using Support & Resistance Levels with Vic Noble
1 × $6.00
How To Trade Forex Using Support & Resistance Levels with Vic Noble
1 × $6.00 -
×
 Fundamentals of the Securities Industry with William A.Rini
1 × $6.00
Fundamentals of the Securities Industry with William A.Rini
1 × $6.00 -
×
 High Probability Trading Using Elliott Wave And Fibonacci Analysis withVic Patel - Forex Training Group
1 × $10.00
High Probability Trading Using Elliott Wave And Fibonacci Analysis withVic Patel - Forex Training Group
1 × $10.00 -
×
 SQX Mentorship with Tip Toe Hippo
1 × $23.00
SQX Mentorship with Tip Toe Hippo
1 × $23.00 -
×
 How to Trade the New Single Stock Futures with Jack Bernstein
1 × $6.00
How to Trade the New Single Stock Futures with Jack Bernstein
1 × $6.00 -
×
 The Investors Guide to Active Asset Allocation with Martin Pring
1 × $6.00
The Investors Guide to Active Asset Allocation with Martin Pring
1 × $6.00 -
×
 Commodities and Commodity Derivatives: Modeling and Pricing for Agriculturals, Metals and Energy - Helyette Geman
1 × $6.00
Commodities and Commodity Derivatives: Modeling and Pricing for Agriculturals, Metals and Energy - Helyette Geman
1 × $6.00 -
×
 Pro Trading Blueprint with Limitless Forex Academy
1 × $5.00
Pro Trading Blueprint with Limitless Forex Academy
1 × $5.00 -
×
 High Powered Investing with Amine Bouchentouf
1 × $6.00
High Powered Investing with Amine Bouchentouf
1 × $6.00 -
×
 The Prop Trading Code with Brannigan Barrett - Axia Futures
1 × $23.00
The Prop Trading Code with Brannigan Barrett - Axia Futures
1 × $23.00 -
×
 Formula to a Fortune with Steve Briese, Glen Ring
1 × $6.00
Formula to a Fortune with Steve Briese, Glen Ring
1 × $6.00 -
×
 Dynamic Time Cycles with Peter Eliades
1 × $6.00
Dynamic Time Cycles with Peter Eliades
1 × $6.00 -
×
 Candlestick Patterns to Master Forex Trading Price Action with Federico Sellitti
1 × $6.00
Candlestick Patterns to Master Forex Trading Price Action with Federico Sellitti
1 × $6.00 -
×
 YTC Price Action Trader
1 × $6.00
YTC Price Action Trader
1 × $6.00 -
×
 China & the World Trading System with Deborah Cass, Brett Williams & George Barker
1 × $6.00
China & the World Trading System with Deborah Cass, Brett Williams & George Barker
1 × $6.00 -
×
 How to Lose Money Profitably with Mark D.Cook
1 × $6.00
How to Lose Money Profitably with Mark D.Cook
1 × $6.00 -
×
 FOREX UNLIMITED WEALTH EA
1 × $6.00
FOREX UNLIMITED WEALTH EA
1 × $6.00 -
×
 Simple Methods for Detecting Buying and Selling Points in Securities with James Liveright
1 × $6.00
Simple Methods for Detecting Buying and Selling Points in Securities with James Liveright
1 × $6.00 -
×
 Advanced Iron Condors, Trading Concepts with Todd Mitchell
1 × $31.00
Advanced Iron Condors, Trading Concepts with Todd Mitchell
1 × $31.00 -
×
 Slapped by the Invisible Hand: The Panic of 2007 with Gary Gorton
1 × $6.00
Slapped by the Invisible Hand: The Panic of 2007 with Gary Gorton
1 × $6.00 -
×
 Investment Science with David G.Luenberger
1 × $6.00
Investment Science with David G.Luenberger
1 × $6.00 -
×
 Candlestick Secrets For Profiting In Options
1 × $23.00
Candlestick Secrets For Profiting In Options
1 × $23.00 -
×
 How To Flip All Those “Hard To Flip” Deals
1 × $6.00
How To Flip All Those “Hard To Flip” Deals
1 × $6.00 -
×
 $20 – 52k 20 pips a day challange with Rafał Zuchowicz - TopMasterTrader
1 × $5.00
$20 – 52k 20 pips a day challange with Rafał Zuchowicz - TopMasterTrader
1 × $5.00 -
×
 Synthetic and Structured Assets: A Practical Guide to Investment and Risk with Erik Banks
1 × $6.00
Synthetic and Structured Assets: A Practical Guide to Investment and Risk with Erik Banks
1 × $6.00 -
×
 The Kiloby Inquiries Online with Scott Kiloby
1 × $39.00
The Kiloby Inquiries Online with Scott Kiloby
1 × $39.00 -
×
 Financial Markets Online – VIP Membership with James Bentley
1 × $6.00
Financial Markets Online – VIP Membership with James Bentley
1 × $6.00 -
×
 S&P 500 Secrets + Next Level Risk Management with Tradacc
1 × $8.00
S&P 500 Secrets + Next Level Risk Management with Tradacc
1 × $8.00 -
×
 Jim Rickards Intelligence Triggers with Agora Financial
1 × $5.00
Jim Rickards Intelligence Triggers with Agora Financial
1 × $5.00 -
×
 0 DTE Options Trading Workshop with Aeromir Corporation
1 × $15.00
0 DTE Options Trading Workshop with Aeromir Corporation
1 × $15.00 -
×
 Cheat Code Trading System
1 × $13.00
Cheat Code Trading System
1 × $13.00 -
×
 CFA Level 2 - Sample Item Sets 2003
1 × $6.00
CFA Level 2 - Sample Item Sets 2003
1 × $6.00 -
×
 Sensitivity Analysis in Practice
1 × $6.00
Sensitivity Analysis in Practice
1 × $6.00 -
×
 Investment Leadership & Portfolio Management with Brian Singer
1 × $6.00
Investment Leadership & Portfolio Management with Brian Singer
1 × $6.00 -
×
 The Reducing Risk and Maximizing Returns Blueprint (Atomic Hedge Strategy) with Don Kaufman
1 × $6.00
The Reducing Risk and Maximizing Returns Blueprint (Atomic Hedge Strategy) with Don Kaufman
1 × $6.00 -
×
 Option Insanity Strategy with PDS Trader
1 × $69.00
Option Insanity Strategy with PDS Trader
1 × $69.00 -
×
 AbleTrend with John Wang & Grace Wang
1 × $6.00
AbleTrend with John Wang & Grace Wang
1 × $6.00 -
×
 Setups of a Winning Trader with Gareth Soloway
1 × $521.00
Setups of a Winning Trader with Gareth Soloway
1 × $521.00 -
×
 Covered Calls Income Generation for Your Stocks With Don Kaufman
1 × $6.00
Covered Calls Income Generation for Your Stocks With Don Kaufman
1 × $6.00 -
×
 The Best Option Trading Course with David Jaffee - Best Stock Strategy
1 × $15.00
The Best Option Trading Course with David Jaffee - Best Stock Strategy
1 × $15.00 -
×
 Elite Trader Package
1 × $31.00
Elite Trader Package
1 × $31.00 -
×
 ICT Prodigy Trading Course – $650K in Payouts with Alex Solignani
1 × $15.00
ICT Prodigy Trading Course – $650K in Payouts with Alex Solignani
1 × $15.00 -
×
 Trading Aplications of Japanese Candlestick Charting with Gary S.Wagner & Bradley L.Matheny
1 × $6.00
Trading Aplications of Japanese Candlestick Charting with Gary S.Wagner & Bradley L.Matheny
1 × $6.00 -
×
 Option Express Plugin
1 × $6.00
Option Express Plugin
1 × $6.00 -
×
 What Products to Watch and Why Class with Don Kaufman
1 × $6.00
What Products to Watch and Why Class with Don Kaufman
1 × $6.00 -
×
 Applications of Abstract Algebra with Maple - Richard E.Kline, Neil Sigmon, Ernst Stitzinger
1 × $6.00
Applications of Abstract Algebra with Maple - Richard E.Kline, Neil Sigmon, Ernst Stitzinger
1 × $6.00 -
×
 Sacredscience - Edward Johndro – Collected Articles
1 × $6.00
Sacredscience - Edward Johndro – Collected Articles
1 × $6.00 -
×
 A Comparison of Popular Trading Systems (2nd Ed.) with Lars Kestner
1 × $6.00
A Comparison of Popular Trading Systems (2nd Ed.) with Lars Kestner
1 × $6.00 -
×
 Options 101 - The Basics and Beyond Class A 5-Part Course with Don Kaufman
1 × $6.00
Options 101 - The Basics and Beyond Class A 5-Part Course with Don Kaufman
1 × $6.00 -
×
 PFAZoneSuite [Trading Indicator] 2017
1 × $109.00
PFAZoneSuite [Trading Indicator] 2017
1 × $109.00 -
×
 Candlestick Trading for Maximum Profitsn with B.M.Davis
1 × $6.00
Candlestick Trading for Maximum Profitsn with B.M.Davis
1 × $6.00 -
×
 Foundational Chart Analysis Series: Support / Resistance Techniques of Professional Traders 6 DVD Home Study Course
1 × $54.00
Foundational Chart Analysis Series: Support / Resistance Techniques of Professional Traders 6 DVD Home Study Course
1 × $54.00 -
×
 Exchange Traded Funds & E-Mini Stock Index Futures with David Lerman
1 × $6.00
Exchange Traded Funds & E-Mini Stock Index Futures with David Lerman
1 × $6.00 -
×
 Capital Flows and Crises with Barry Eichengreen
1 × $6.00
Capital Flows and Crises with Barry Eichengreen
1 × $6.00 -
×
 Spread Trading E-Trading Stagionale (Italian) with Joe Ross
1 × $6.00
Spread Trading E-Trading Stagionale (Italian) with Joe Ross
1 × $6.00 -
×
 The Psychology Of Trading with Brett N.Steenbarger
1 × $6.00
The Psychology Of Trading with Brett N.Steenbarger
1 × $6.00 -
×
 Geometry of Markets I with Bruce Gilmore
1 × $6.00
Geometry of Markets I with Bruce Gilmore
1 × $6.00 -
×
 The Master Indicator 2023 with Lance Ippolito
1 × $101.00
The Master Indicator 2023 with Lance Ippolito
1 × $101.00 -
×
 W. D Gann 's Square Of 9 Applied To Modern Markets with Sean Avidar - Hexatrade350
1 × $23.00
W. D Gann 's Square Of 9 Applied To Modern Markets with Sean Avidar - Hexatrade350
1 × $23.00

Forex Shockwave Analysis with James Bickford
$6.00
File Size: Coming soon!
Delivery Time: 1–12 hours
Media Type: Online Course
Content Proof: Watch Here!
You may check content proof of “Forex Shockwave Analysis with James Bickford” below:

Forex Shockwave Analysis with James Bickford
Navigating the turbulent waters of forex trading can be a daunting task. James Bickford’s “Forex Shockwave Analysis” provides traders with a powerful tool to decipher market movements and make informed trading decisions. This article will guide you through the key concepts and practical applications of Forex Shockwave Analysis, helping you enhance your trading strategy.
Understanding Forex Shockwave Analysis
What is Forex Shockwave Analysis?
Forex Shockwave Analysis is a method of analyzing forex market movements by identifying and interpreting significant price shocks. These shocks often precede major market trends and can be used to predict future price movements.
The Genesis of Shockwave Analysis
James Bickford developed this analysis technique to help traders identify market disruptions that lead to significant price changes. It combines elements of technical and fundamental analysis to provide a comprehensive view of the market.
Key Components of Shockwave Analysis
Identifying Price Shocks
Price shocks are sudden, unexpected changes in the price of a currency pair. These shocks can be caused by various factors, including economic data releases, geopolitical events, and market sentiment shifts.
Analyzing Shockwave Patterns
Shockwave patterns are formed by the price movements following a shock. These patterns can be categorized into different types, such as continuation patterns, reversal patterns, and consolidation patterns.
Applying Shockwave Analysis to Forex Trading
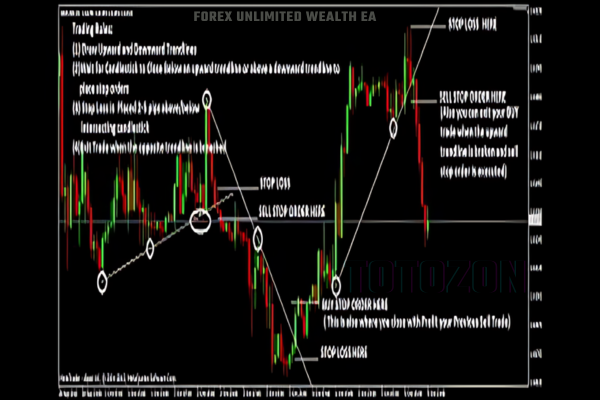
Spotting Shockwave Patterns
To spot shockwave patterns, traders need to monitor the market for sudden price changes and analyze the subsequent price movements. Tools like candlestick charts and moving averages can be helpful in this process.
Using Shockwave Analysis for Entry and Exit Points
Shockwave Analysis can help traders identify optimal entry and exit points. For example, a strong continuation pattern following a price shock can indicate a good entry point, while a reversal pattern may signal an exit point.
Technical Tools for Shockwave Analysis
Candlestick Charts
Candlestick charts are essential for identifying shockwave patterns. They provide a visual representation of price movements and help traders spot key patterns like hammers, dojis, and engulfing patterns.
Moving Averages
Moving averages smooth out price data and help identify the overall trend. They can also be used to confirm shockwave patterns and provide additional entry and exit signals.
Relative Strength Index (RSI)
The RSI measures the speed and change of price movements. It can help traders identify overbought or oversold conditions, which are often associated with price shocks.
Fundamental Factors Influencing Price Shocks
Economic Data Releases
Economic indicators such as GDP growth, employment figures, and inflation rates can cause significant price shocks. Traders need to stay informed about upcoming data releases and their potential impact on the market.
Geopolitical Events
Geopolitical events, including elections, trade negotiations, and conflicts, can lead to sudden market movements. Understanding these events and their potential implications is crucial for successful shockwave analysis.
Shockwave Analysis in Different Market Conditions
Bullish Markets
In bullish markets, shockwave patterns often indicate strong continuation trends. Traders can use these patterns to identify buying opportunities and ride the upward momentum.
Bearish Markets
In bearish markets, shockwave patterns may signal potential reversals or continuation of downward trends. Traders should be cautious and look for confirmation before entering trades.
Sideways Markets
In sideways markets, shockwave patterns can indicate potential breakouts or breakdowns. Traders should be prepared for increased volatility and adjust their strategies accordingly.
Case Studies of Shockwave Analysis
Case Study 1: Economic Data Release
A trader identifies a price shock following a strong employment report. Using shockwave analysis, the trader spots a continuation pattern and enters a long position, capitalizing on the upward trend.
Case Study 2: Geopolitical Event
A sudden geopolitical event causes a price shock in the forex market. The trader identifies a reversal pattern using shockwave analysis and exits a short position, avoiding potential losses.
Common Mistakes in Shockwave Analysis
Overlooking Market Context
One common mistake is ignoring the broader market context when analyzing price shocks. Traders should consider other technical indicators and fundamental factors to avoid false signals.
Relying Solely on Shockwave Patterns
While shockwave patterns are powerful, they should not be used in isolation. Combining them with other analysis techniques can improve accuracy and trading outcomes.
Advanced Shockwave Analysis Techniques
Multiple Time Frame Analysis
Analyzing price shocks across different time frames can provide a more comprehensive view of the market. This technique helps traders identify long-term trends and short-term entry points.
Volume Analysis
Volume analysis can confirm the strength of a price shock. High trading volume following a price shock indicates strong market participation and can validate the shockwave pattern.
Psychological Aspects of Shockwave Trading
Managing Emotional Reactions
Price shocks can evoke strong emotional reactions. Traders need to remain calm and stick to their analysis to avoid impulsive decisions.
Building Confidence
Confidence in shockwave analysis comes with experience. Practicing the identification and interpretation of shockwave patterns will improve trading skills and outcomes.
Conclusion
Forex Shockwave Analysis, as pioneered by James Bickford, offers a unique approach to understanding market movements. By identifying and interpreting price shocks, traders can enhance their trading strategies and make informed decisions. Remember, combining shockwave analysis with other technical and fundamental tools, and maintaining emotional discipline, is key to successful trading.
FAQs
1. What makes Forex Shockwave Analysis unique?
Forex Shockwave Analysis focuses on identifying and interpreting sudden price shocks, providing a unique perspective on market movements.
2. Can shockwave analysis be used for all currency pairs?
Yes, shockwave analysis can be applied to any currency pair. However, the effectiveness may vary depending on market conditions and the specific pair.
3. How do economic data releases impact shockwave patterns?
Economic data releases often cause significant price shocks, leading to the formation of shockwave patterns. Traders should monitor these releases closely.
4. Is it necessary to use other technical indicators with shockwave analysis?
While shockwave analysis is powerful, using it in conjunction with other technical indicators can improve accuracy and trading outcomes.
5. How can I improve my skills in shockwave analysis?
Regular practice, continuous learning, and analyzing historical price shocks can help improve your skills in shockwave analysis.
Be the first to review “Forex Shockwave Analysis with James Bickford”
You must be logged in to post a review.
Related products

Forex Trading
Quantamentals – The Next Great Forefront Of Trading and Investing with Trading Markets
Original price was: $1,495.00.$8.00Current price is: $8.00.

Forex Trading
Original price was: $500.00.$5.00Current price is: $5.00.
Original price was: $2,120.00.$15.00Current price is: $15.00.

Forex Trading
Original price was: $397.00.$31.00Current price is: $31.00.
Original price was: $1,849.00.$15.00Current price is: $15.00.

Forex Trading
Original price was: $1,098.00.$39.00Current price is: $39.00.
Original price was: $497.00.$11.00Current price is: $11.00.

Forex Trading
Original price was: $239.00.$8.00Current price is: $8.00.
Forex Trading
Original price was: $999.00.$15.00Current price is: $15.00.

Original price was: $999.00.$5.00Current price is: $5.00.

Original price was: $450.00.$23.00Current price is: $23.00.

Original price was: $4,995.00.$15.00Current price is: $15.00.
Forex Trading
Original price was: $2,997.00.$23.00Current price is: $23.00.
Forex Trading
Original price was: $1,898.00.$10.00Current price is: $10.00.

Original price was: $997.00.$13.00Current price is: $13.00.

Forex Trading
The Complete Guide to Multiple Time Frame Analysis & Reading Price Action with Aiman Almansoori
Original price was: $1,399.00.$13.00Current price is: $13.00.
Forex Trading
Original price was: $850.00.$23.00Current price is: $23.00.

Original price was: $310.00.$23.00Current price is: $23.00.

Original price was: $649.00.$20.00Current price is: $20.00.
Forex Trading
Original price was: $2,995.00.$31.00Current price is: $31.00.
Reviews
There are no reviews yet.