-
×
 VintagEducation - The Fast Track Forex Bootcamp
1 × $6.00
VintagEducation - The Fast Track Forex Bootcamp
1 × $6.00 -
×
 The Definitive Guide to Forecasting Using W.D.Gann’s Square of Nine
1 × $6.00
The Definitive Guide to Forecasting Using W.D.Gann’s Square of Nine
1 × $6.00 -
×
 Getting Started in Options with Michael Thomsett
1 × $6.00
Getting Started in Options with Michael Thomsett
1 × $6.00 -
×
 Foundation & Application of the Market with Jim Dalton - JimDalton Trading
1 × $5.00
Foundation & Application of the Market with Jim Dalton - JimDalton Trading
1 × $5.00 -
×
 Sami Abusaad Elite Mentorship
1 × $31.00
Sami Abusaad Elite Mentorship
1 × $31.00 -
×
 Learn Before you Loose
1 × $6.00
Learn Before you Loose
1 × $6.00 -
×
 Quantitative Finance & Algorithmic Trading in Python with Holczer Balazs
1 × $4.00
Quantitative Finance & Algorithmic Trading in Python with Holczer Balazs
1 × $4.00 -
×
 How to Profit in Gold with Jonathan Spall
1 × $6.00
How to Profit in Gold with Jonathan Spall
1 × $6.00 -
×
 Dow Theory Redux with Michael Sheimo
1 × $6.00
Dow Theory Redux with Michael Sheimo
1 × $6.00 -
×
 Investing in stocks: Avoid stock market loss
1 × $15.00
Investing in stocks: Avoid stock market loss
1 × $15.00 -
×
 How to Use Gann Techniques to Implement a Trading System
1 × $6.00
How to Use Gann Techniques to Implement a Trading System
1 × $6.00 -
×
 George Bayer Soft 1.02
1 × $6.00
George Bayer Soft 1.02
1 × $6.00 -
×
 Investment Titans: Investment Insights from the Minds that Move Wall Street with Jonathan Burton
1 × $6.00
Investment Titans: Investment Insights from the Minds that Move Wall Street with Jonathan Burton
1 × $6.00 -
×
 HYDRA 3 Day Bootcamp
1 × $5.00
HYDRA 3 Day Bootcamp
1 × $5.00 -
×
 Management Consultancy & Banking in a Era of Globalization
1 × $6.00
Management Consultancy & Banking in a Era of Globalization
1 × $6.00 -
×
 Graphs, Application to Speculation with George Cole
1 × $6.00
Graphs, Application to Speculation with George Cole
1 × $6.00 -
×
 MTI - Basics UTP
1 × $6.00
MTI - Basics UTP
1 × $6.00 -
×
 How I Trade Options with Jon Najarian
1 × $4.00
How I Trade Options with Jon Najarian
1 × $4.00 -
×
 Myths of the Free Market with Kenneth Friedman
1 × $6.00
Myths of the Free Market with Kenneth Friedman
1 × $6.00 -
×
 Sacredscience - Sepharial – Your Personal Diurnal Chart
1 × $6.00
Sacredscience - Sepharial – Your Personal Diurnal Chart
1 × $6.00 -
×
 Our 3 Bread and Butter Trades In This Low IV Market Advanced Class with Day Trading Zones
1 × $39.00
Our 3 Bread and Butter Trades In This Low IV Market Advanced Class with Day Trading Zones
1 × $39.00 -
×
 Getting Started in Options (3rd Ed.) with Michael Thomsett
1 × $6.00
Getting Started in Options (3rd Ed.) with Michael Thomsett
1 × $6.00 -
×
 Create Your Own ETF Hedge Fund: A Do-It-Yourself ETF Strategy for Private Wealth Management with David Fry
1 × $6.00
Create Your Own ETF Hedge Fund: A Do-It-Yourself ETF Strategy for Private Wealth Management with David Fry
1 × $6.00 -
×
 Learn To Trade Markets with Karl Richards
1 × $6.00
Learn To Trade Markets with Karl Richards
1 × $6.00 -
×
 Flipping Markets Video Course (2022)
1 × $5.00
Flipping Markets Video Course (2022)
1 × $5.00 -
×
 Options Professional Online Webinar (2010-01 – 2010-02) with J.L.Lord
1 × $6.00
Options Professional Online Webinar (2010-01 – 2010-02) with J.L.Lord
1 × $6.00 -
×
 NY 6 - Jason McDonald – Why Shorts are Hard to Find and How You Can Find Great Shorts
1 × $6.00
NY 6 - Jason McDonald – Why Shorts are Hard to Find and How You Can Find Great Shorts
1 × $6.00 -
×
 Mastermind Bootcamp + Core Concepts Mastery with DreamsFX
1 × $6.00
Mastermind Bootcamp + Core Concepts Mastery with DreamsFX
1 × $6.00 -
×
 Introduction to Fibonacci Time Analysis with Carolyn Boroden
1 × $6.00
Introduction to Fibonacci Time Analysis with Carolyn Boroden
1 × $6.00 -
×
 Rob’s 6 Day 21 Set-up Course with Rob Hoffman
1 × $85.00
Rob’s 6 Day 21 Set-up Course with Rob Hoffman
1 × $85.00 -
×
 Sample and Mock Exams 2008 with CFA Institute
1 × $6.00
Sample and Mock Exams 2008 with CFA Institute
1 × $6.00 -
×
 Smart Money with Chart Engineers
1 × $7.00
Smart Money with Chart Engineers
1 × $7.00 -
×
 New York Institute of Finance – Futures. A Personal Seminar
1 × $6.00
New York Institute of Finance – Futures. A Personal Seminar
1 × $6.00 -
×
 Futures Day Trading And Order Flow Course with Trade Pro Academy
1 × $15.00
Futures Day Trading And Order Flow Course with Trade Pro Academy
1 × $15.00 -
×
 Survive and Thrive in Extreme Volatility Class with Don Kaufman
1 × $6.00
Survive and Thrive in Extreme Volatility Class with Don Kaufman
1 × $6.00 -
×
 Intro To Short Selling with Madaz Money
1 × $31.00
Intro To Short Selling with Madaz Money
1 × $31.00 -
×
 Private Seminars
1 × $23.00
Private Seminars
1 × $23.00 -
×
 Brian James Sklenka Package
1 × $31.00
Brian James Sklenka Package
1 × $31.00 -
×
 Trend Trading Techniques with Rob Hoffman
1 × $6.00
Trend Trading Techniques with Rob Hoffman
1 × $6.00 -
×
 Techical Analysis with Charles D.Kirkpatrick
1 × $6.00
Techical Analysis with Charles D.Kirkpatrick
1 × $6.00 -
×
 Investing in Corporate Bonds and Credit Risk with Frank Hagenstein
1 × $6.00
Investing in Corporate Bonds and Credit Risk with Frank Hagenstein
1 × $6.00 -
×
 Penny Stock Mastery
1 × $31.00
Penny Stock Mastery
1 × $31.00 -
×
 Intro to Fibonacci Trading with Neal Hughes
1 × $6.00
Intro to Fibonacci Trading with Neal Hughes
1 × $6.00 -
×
 The 1st Leveraged ETF Trading Strategies Workshop
1 × $54.00
The 1st Leveraged ETF Trading Strategies Workshop
1 × $54.00 -
×
 How to Make the Stock Market Make Money For You with Ted Warren
1 × $6.00
How to Make the Stock Market Make Money For You with Ted Warren
1 × $6.00 -
×
 Linda Raschke Short Term Trading Strategies with David Vomund
1 × $6.00
Linda Raschke Short Term Trading Strategies with David Vomund
1 × $6.00 -
×
 Evolved Trader with Mark Croock
1 × $69.00
Evolved Trader with Mark Croock
1 × $69.00 -
×
 6-2-4 Winning Strategies & Systems with Jack Bernstein
1 × $6.00
6-2-4 Winning Strategies & Systems with Jack Bernstein
1 × $6.00 -
×
 Mastering the Stock Market with Andrew Baxter
1 × $6.00
Mastering the Stock Market with Andrew Baxter
1 × $6.00 -
×
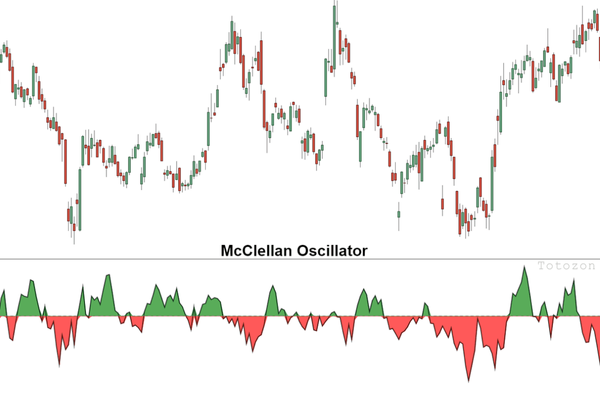 The McClellan Oscillator and Other Tools for with Tom McClellan
1 × $6.00
The McClellan Oscillator and Other Tools for with Tom McClellan
1 × $6.00 -
×
 Jtrader - A+ Setups Small Caps
1 × $23.00
Jtrader - A+ Setups Small Caps
1 × $23.00 -
×
 The Late-Start Investor with John Wasik
1 × $6.00
The Late-Start Investor with John Wasik
1 × $6.00 -
×
 Finding Astrocycles with an Ephemeris - Hans Hannula
1 × $6.00
Finding Astrocycles with an Ephemeris - Hans Hannula
1 × $6.00 -
×
 AI For Traders with Trading Markets
1 × $31.00
AI For Traders with Trading Markets
1 × $31.00 -
×
 How to Make Money with Real State Options with Thomas Lucier
1 × $6.00
How to Make Money with Real State Options with Thomas Lucier
1 × $6.00 -
×
 0 DTE Options Trading Workshop with Aeromir Corporation
1 × $15.00
0 DTE Options Trading Workshop with Aeromir Corporation
1 × $15.00 -
×
 Advanced Spread Trading with Guy Bower - MasterClass Trader
1 × $15.00
Advanced Spread Trading with Guy Bower - MasterClass Trader
1 × $15.00 -
×
 Jtrader - Risk Management 1on1
1 × $23.00
Jtrader - Risk Management 1on1
1 × $23.00 -
×
 SQX Mentorship with Tip Toe Hippo
1 × $23.00
SQX Mentorship with Tip Toe Hippo
1 × $23.00 -
×
 Bond Market Course with The Macro Compass
1 × $15.00
Bond Market Course with The Macro Compass
1 × $15.00 -
×
 Options Trading & Ultimate MasterClass With Tyrone Abela - FX Evolution
1 × $54.00
Options Trading & Ultimate MasterClass With Tyrone Abela - FX Evolution
1 × $54.00 -
×
 How to Trade a Vertical Market
1 × $93.00
How to Trade a Vertical Market
1 × $93.00 -
×
 Seven Trading Systems for The S&P Futures with David Bean
1 × $6.00
Seven Trading Systems for The S&P Futures with David Bean
1 × $6.00 -
×
 Matrix Spread Options Trading Course with Base Camp Trading
1 × $31.00
Matrix Spread Options Trading Course with Base Camp Trading
1 × $31.00 -
×
 Order flow self-study training program with iMFtracker
1 × $10.00
Order flow self-study training program with iMFtracker
1 × $10.00 -
×
 Compass Trading System with Right Line Trading
1 × $39.00
Compass Trading System with Right Line Trading
1 × $39.00 -
×
 The Naked Eye: Raw Data Analytics with Edgar Torres - Raw Data Analytics
1 × $8.00
The Naked Eye: Raw Data Analytics with Edgar Torres - Raw Data Analytics
1 × $8.00 -
×
 Home Run Options Trading Course with Dave Aquino - Base Camp Trading
1 × $11.00
Home Run Options Trading Course with Dave Aquino - Base Camp Trading
1 × $11.00 -
×
 Options Course - 4 CD Course + PDF Workbook with VectorVest
1 × $54.00
Options Course - 4 CD Course + PDF Workbook with VectorVest
1 × $54.00 -
×
 W. D Gann 's Square Of 9 Applied To Modern Markets with Sean Avidar - Hexatrade350
1 × $23.00
W. D Gann 's Square Of 9 Applied To Modern Markets with Sean Avidar - Hexatrade350
1 × $23.00 -
×
 Scalping Betfair For Daily Profits
1 × $6.00
Scalping Betfair For Daily Profits
1 × $6.00 -
×
 The Prop Trading Code with Brannigan Barrett - Axia Futures
1 × $23.00
The Prop Trading Code with Brannigan Barrett - Axia Futures
1 × $23.00 -
×
 Quantamentals - The Next Great Forefront Of Trading and Investing with Trading Markets
1 × $8.00
Quantamentals - The Next Great Forefront Of Trading and Investing with Trading Markets
1 × $8.00 -
×
 TRADING NFX Course with Andrew NFX
1 × $5.00
TRADING NFX Course with Andrew NFX
1 × $5.00 -
×
 The Trading Blueprint with Brad Goh - The Trading Geek
1 × $5.00
The Trading Blueprint with Brad Goh - The Trading Geek
1 × $5.00 -
×
 Yarimi University Course
1 × $56.00
Yarimi University Course
1 × $56.00 -
×
 Essentials Of Payroll Management & Accounting with Steven M.Bragg
1 × $6.00
Essentials Of Payroll Management & Accounting with Steven M.Bragg
1 × $6.00 -
×
 Scalp Strategy and Flipping Small Accounts with Opes Trading Group
1 × $5.00
Scalp Strategy and Flipping Small Accounts with Opes Trading Group
1 × $5.00 -
×
 How To Read The Market Professionally with TradeSmart
1 × $27.00
How To Read The Market Professionally with TradeSmart
1 × $27.00

Forex Shockwave Analysis with James Bickford
$6.00
File Size: Coming soon!
Delivery Time: 1–12 hours
Media Type: Online Course
Content Proof: Watch Here!
You may check content proof of “Forex Shockwave Analysis with James Bickford” below:

Forex Shockwave Analysis with James Bickford
Navigating the turbulent waters of forex trading can be a daunting task. James Bickford’s “Forex Shockwave Analysis” provides traders with a powerful tool to decipher market movements and make informed trading decisions. This article will guide you through the key concepts and practical applications of Forex Shockwave Analysis, helping you enhance your trading strategy.
Understanding Forex Shockwave Analysis
What is Forex Shockwave Analysis?
Forex Shockwave Analysis is a method of analyzing forex market movements by identifying and interpreting significant price shocks. These shocks often precede major market trends and can be used to predict future price movements.
The Genesis of Shockwave Analysis
James Bickford developed this analysis technique to help traders identify market disruptions that lead to significant price changes. It combines elements of technical and fundamental analysis to provide a comprehensive view of the market.
Key Components of Shockwave Analysis
Identifying Price Shocks
Price shocks are sudden, unexpected changes in the price of a currency pair. These shocks can be caused by various factors, including economic data releases, geopolitical events, and market sentiment shifts.
Analyzing Shockwave Patterns
Shockwave patterns are formed by the price movements following a shock. These patterns can be categorized into different types, such as continuation patterns, reversal patterns, and consolidation patterns.
Applying Shockwave Analysis to Forex Trading
Spotting Shockwave Patterns
To spot shockwave patterns, traders need to monitor the market for sudden price changes and analyze the subsequent price movements. Tools like candlestick charts and moving averages can be helpful in this process.
Using Shockwave Analysis for Entry and Exit Points
Shockwave Analysis can help traders identify optimal entry and exit points. For example, a strong continuation pattern following a price shock can indicate a good entry point, while a reversal pattern may signal an exit point.
Technical Tools for Shockwave Analysis
Candlestick Charts
Candlestick charts are essential for identifying shockwave patterns. They provide a visual representation of price movements and help traders spot key patterns like hammers, dojis, and engulfing patterns.
Moving Averages
Moving averages smooth out price data and help identify the overall trend. They can also be used to confirm shockwave patterns and provide additional entry and exit signals.
Relative Strength Index (RSI)
The RSI measures the speed and change of price movements. It can help traders identify overbought or oversold conditions, which are often associated with price shocks.
Fundamental Factors Influencing Price Shocks
Economic Data Releases
Economic indicators such as GDP growth, employment figures, and inflation rates can cause significant price shocks. Traders need to stay informed about upcoming data releases and their potential impact on the market.
Geopolitical Events
Geopolitical events, including elections, trade negotiations, and conflicts, can lead to sudden market movements. Understanding these events and their potential implications is crucial for successful shockwave analysis.
Shockwave Analysis in Different Market Conditions
Bullish Markets
In bullish markets, shockwave patterns often indicate strong continuation trends. Traders can use these patterns to identify buying opportunities and ride the upward momentum.
Bearish Markets
In bearish markets, shockwave patterns may signal potential reversals or continuation of downward trends. Traders should be cautious and look for confirmation before entering trades.
Sideways Markets
In sideways markets, shockwave patterns can indicate potential breakouts or breakdowns. Traders should be prepared for increased volatility and adjust their strategies accordingly.
Case Studies of Shockwave Analysis
Case Study 1: Economic Data Release
A trader identifies a price shock following a strong employment report. Using shockwave analysis, the trader spots a continuation pattern and enters a long position, capitalizing on the upward trend.
Case Study 2: Geopolitical Event
A sudden geopolitical event causes a price shock in the forex market. The trader identifies a reversal pattern using shockwave analysis and exits a short position, avoiding potential losses.
Common Mistakes in Shockwave Analysis
Overlooking Market Context
One common mistake is ignoring the broader market context when analyzing price shocks. Traders should consider other technical indicators and fundamental factors to avoid false signals.
Relying Solely on Shockwave Patterns
While shockwave patterns are powerful, they should not be used in isolation. Combining them with other analysis techniques can improve accuracy and trading outcomes.
Advanced Shockwave Analysis Techniques
Multiple Time Frame Analysis
Analyzing price shocks across different time frames can provide a more comprehensive view of the market. This technique helps traders identify long-term trends and short-term entry points.
Volume Analysis
Volume analysis can confirm the strength of a price shock. High trading volume following a price shock indicates strong market participation and can validate the shockwave pattern.
Psychological Aspects of Shockwave Trading
Managing Emotional Reactions
Price shocks can evoke strong emotional reactions. Traders need to remain calm and stick to their analysis to avoid impulsive decisions.
Building Confidence
Confidence in shockwave analysis comes with experience. Practicing the identification and interpretation of shockwave patterns will improve trading skills and outcomes.
Conclusion
Forex Shockwave Analysis, as pioneered by James Bickford, offers a unique approach to understanding market movements. By identifying and interpreting price shocks, traders can enhance their trading strategies and make informed decisions. Remember, combining shockwave analysis with other technical and fundamental tools, and maintaining emotional discipline, is key to successful trading.
FAQs
1. What makes Forex Shockwave Analysis unique?
Forex Shockwave Analysis focuses on identifying and interpreting sudden price shocks, providing a unique perspective on market movements.
2. Can shockwave analysis be used for all currency pairs?
Yes, shockwave analysis can be applied to any currency pair. However, the effectiveness may vary depending on market conditions and the specific pair.
3. How do economic data releases impact shockwave patterns?
Economic data releases often cause significant price shocks, leading to the formation of shockwave patterns. Traders should monitor these releases closely.
4. Is it necessary to use other technical indicators with shockwave analysis?
While shockwave analysis is powerful, using it in conjunction with other technical indicators can improve accuracy and trading outcomes.
5. How can I improve my skills in shockwave analysis?
Regular practice, continuous learning, and analyzing historical price shocks can help improve your skills in shockwave analysis.
Be the first to review “Forex Shockwave Analysis with James Bickford”
You must be logged in to post a review.
Related products
Original price was: $895.00.$15.00Current price is: $15.00.

Forex Trading
Original price was: $397.00.$31.00Current price is: $31.00.
Original price was: $497.00.$11.00Current price is: $11.00.

Forex Trading
Original price was: $797.00.$10.00Current price is: $10.00.
Forex Trading
Original price was: $499.00.$15.00Current price is: $15.00.

Original price was: $450.00.$23.00Current price is: $23.00.

Forex Trading
Original price was: $249.00.$15.00Current price is: $15.00.

Original price was: $799.00.$15.00Current price is: $15.00.

Forex Trading
Original price was: $125.00.$17.00Current price is: $17.00.

Original price was: $700.00.$39.00Current price is: $39.00.

Forex Trading
Original price was: $850.00.$23.00Current price is: $23.00.
Original price was: $497.00.$31.00Current price is: $31.00.

Original price was: $1,849.00.$15.00Current price is: $15.00.

Original price was: $997.00.$13.00Current price is: $13.00.

Forex Trading
The Complete Guide to Multiple Time Frame Analysis & Reading Price Action with Aiman Almansoori
Original price was: $1,399.00.$13.00Current price is: $13.00.
Original price was: $997.00.$8.00Current price is: $8.00.
Forex Trading
Original price was: $999.00.$15.00Current price is: $15.00.

Forex Trading
Original price was: $239.00.$8.00Current price is: $8.00.

Original price was: $310.00.$23.00Current price is: $23.00.

Original price was: $695.00.$41.00Current price is: $41.00.
Reviews
There are no reviews yet.