-
×
 Mastering Amibroker Formula Language
1 × $15.00
Mastering Amibroker Formula Language
1 × $15.00 -
×
 Scalp Trading Mini Course with Jayson Casper
1 × $23.00
Scalp Trading Mini Course with Jayson Casper
1 × $23.00 -
×
 Trading System Building Blocks with John Hill
1 × $6.00
Trading System Building Blocks with John Hill
1 × $6.00 -
×
 The Psychology of Investing with John Nofsinger
1 × $6.00
The Psychology of Investing with John Nofsinger
1 × $6.00 -
×
 All About Stocks (3rd Ed.) withEsme E.Faerber
1 × $6.00
All About Stocks (3rd Ed.) withEsme E.Faerber
1 × $6.00 -
×
 Algo Trading Masterclass with Ali Casey - StatOasis
1 × $23.00
Algo Trading Masterclass with Ali Casey - StatOasis
1 × $23.00 -
×
 Mathematical Problems in Image Processing with Charles E.Chidume
1 × $6.00
Mathematical Problems in Image Processing with Charles E.Chidume
1 × $6.00 -
×
 The A14 Weekly Option Strategy Workshop with Amy Meissner
1 × $23.00
The A14 Weekly Option Strategy Workshop with Amy Meissner
1 × $23.00 -
×
 Sample Item Sets 2003 - CFA Level 3
1 × $6.00
Sample Item Sets 2003 - CFA Level 3
1 × $6.00 -
×
 Bond Market Course with The Macro Compass
1 × $15.00
Bond Market Course with The Macro Compass
1 × $15.00 -
×
 Consistently Profitable Trader with Pollinate Trading
1 × $13.00
Consistently Profitable Trader with Pollinate Trading
1 × $13.00 -
×
 The Naked Eye: Raw Data Analytics with Edgar Torres - Raw Data Analytics
1 × $8.00
The Naked Eye: Raw Data Analytics with Edgar Torres - Raw Data Analytics
1 × $8.00 -
×
 Pattern, Price & Time: Using Gann Theory in Trading Systems (1st Edition) with James Hyerczyk
1 × $6.00
Pattern, Price & Time: Using Gann Theory in Trading Systems (1st Edition) with James Hyerczyk
1 × $6.00 -
×
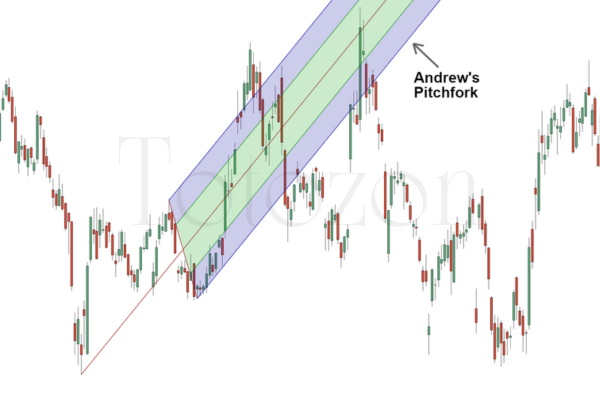 Andrews Pitchfork Basic
1 × $6.00
Andrews Pitchfork Basic
1 × $6.00 -
×
 Investing In KLSE Stocks and Futures With Japanese Candlestick with Fred Tam
1 × $6.00
Investing In KLSE Stocks and Futures With Japanese Candlestick with Fred Tam
1 × $6.00 -
×
 Project Manager’s Spotlight on Risk Management with Kim Heldman
1 × $5.00
Project Manager’s Spotlight on Risk Management with Kim Heldman
1 × $5.00 -
×
 Simple Trade Strategies
1 × $31.00
Simple Trade Strategies
1 × $31.00 -
×
 TradeCraft: Your Path to Peak Performance Trading By Adam Grimes
1 × $15.00
TradeCraft: Your Path to Peak Performance Trading By Adam Grimes
1 × $15.00 -
×
 Activedaytrader - Workshop: Practical Money Management
1 × $23.00
Activedaytrader - Workshop: Practical Money Management
1 × $23.00 -
×
 Yarimi University Course
1 × $56.00
Yarimi University Course
1 × $56.00 -
×
 Evolve MasterClass with Irek Piekarski
1 × $13.00
Evolve MasterClass with Irek Piekarski
1 × $13.00 -
×
 EFT – The Art of Delivery with Gary Craig
1 × $5.00
EFT – The Art of Delivery with Gary Craig
1 × $5.00 -
×
 Stop Being the Stock Market Plankton with Idan Gabrieli
1 × $6.00
Stop Being the Stock Market Plankton with Idan Gabrieli
1 × $6.00 -
×
 AI For Traders with Trading Markets
1 × $31.00
AI For Traders with Trading Markets
1 × $31.00 -
×
 Confessions of a Pit Trader 2003 with Rick Burgess
1 × $6.00
Confessions of a Pit Trader 2003 with Rick Burgess
1 × $6.00 -
×
 Robotic trading interactive
1 × $31.00
Robotic trading interactive
1 × $31.00 -
×
 Smart Money Trading Course with Prosperity Academy
1 × $5.00
Smart Money Trading Course with Prosperity Academy
1 × $5.00 -
×
 How To Read The Market Professionally with TradeSmart
1 × $27.00
How To Read The Market Professionally with TradeSmart
1 × $27.00 -
×
 The Complete Guide to Multiple Time Frame Analysis & Reading Price Action with Aiman Almansoori
1 × $13.00
The Complete Guide to Multiple Time Frame Analysis & Reading Price Action with Aiman Almansoori
1 × $13.00 -
×
 Affinity Foundation Option Course with Affinitytrading
1 × $6.00
Affinity Foundation Option Course with Affinitytrading
1 × $6.00 -
×
 Trading Forex With Market Profile
1 × $15.00
Trading Forex With Market Profile
1 × $15.00 -
×
 0 DTE Options Trading Workshop with Aeromir Corporation
1 × $15.00
0 DTE Options Trading Workshop with Aeromir Corporation
1 × $15.00 -
×
 Handbook of Integral Equations with Andrei D.Polyanin, Alexander V.Manzhirov
1 × $6.00
Handbook of Integral Equations with Andrei D.Polyanin, Alexander V.Manzhirov
1 × $6.00 -
×
 ICT Mastery with Casper SMC
1 × $14.00
ICT Mastery with Casper SMC
1 × $14.00 -
×
 How to Pick Hot Reverse Merger Penny Stocks with John Lux
1 × $5.00
How to Pick Hot Reverse Merger Penny Stocks with John Lux
1 × $5.00 -
×
 Main Online Course with MadCharts
1 × $5.00
Main Online Course with MadCharts
1 × $5.00 -
×
 Oportunities in Forex Calendar Trading Patterns with Anduril Analytics
1 × $6.00
Oportunities in Forex Calendar Trading Patterns with Anduril Analytics
1 × $6.00 -
×
 3 Volatility Strategies with Quantified Strategies
1 × $23.00
3 Volatility Strategies with Quantified Strategies
1 × $23.00 -
×
 Master Trader Course
1 × $23.00
Master Trader Course
1 × $23.00 -
×
 Trading Aplications of Japanese Candlestick Charting with Gary S.Wagner & Bradley L.Matheny
1 × $6.00
Trading Aplications of Japanese Candlestick Charting with Gary S.Wagner & Bradley L.Matheny
1 × $6.00 -
×
 Exploring MetaStock Basic with Martin Pring
1 × $6.00
Exploring MetaStock Basic with Martin Pring
1 × $6.00 -
×
 How to Predict and Prepare for a Stock Market Crash with Damon Verial
1 × $6.00
How to Predict and Prepare for a Stock Market Crash with Damon Verial
1 × $6.00 -
×
 Mars Vesta Cycle in Stocks Markets (Article) with Bill Meridian
1 × $6.00
Mars Vesta Cycle in Stocks Markets (Article) with Bill Meridian
1 × $6.00 -
×
 Cluster Delta with Gova Trading Academy
1 × $5.00
Cluster Delta with Gova Trading Academy
1 × $5.00 -
×
 SQX Mentorship with Tip Toe Hippo
1 × $23.00
SQX Mentorship with Tip Toe Hippo
1 × $23.00 -
×
 Lifespan Investing with Clifford Pistolese
1 × $6.00
Lifespan Investing with Clifford Pistolese
1 × $6.00 -
×
 Ron Wagner - Creating a Profitable Trading & Investing Plan + Techniques to Perfect Your Intraday GAP
1 × $6.00
Ron Wagner - Creating a Profitable Trading & Investing Plan + Techniques to Perfect Your Intraday GAP
1 × $6.00 -
×
 Basic of Market Astrophisics with Hans Hannula
1 × $6.00
Basic of Market Astrophisics with Hans Hannula
1 × $6.00 -
×
 The Complete XAUUSD GOLD Forex Scalping System On Real Trading Account with Forex Lia
1 × $5.00
The Complete XAUUSD GOLD Forex Scalping System On Real Trading Account with Forex Lia
1 × $5.00 -
×
 Deep Dive Butterfly Trading Strategy Class with SJG Trades
1 × $41.00
Deep Dive Butterfly Trading Strategy Class with SJG Trades
1 × $41.00 -
×
 Forecast for 2010 with Larry Williams
1 × $6.00
Forecast for 2010 with Larry Williams
1 × $6.00 -
×
 Month 01 to 08 2018
1 × $62.00
Month 01 to 08 2018
1 × $62.00 -
×
 Home Run Options Trading Course with Dave Aquino - Base Camp Trading
1 × $11.00
Home Run Options Trading Course with Dave Aquino - Base Camp Trading
1 × $11.00 -
×
 Risk Management Toolkit with Peter Bain
1 × $6.00
Risk Management Toolkit with Peter Bain
1 × $6.00 -
×
 Algo Wizard Essentials Course with Srategy Quant
1 × $13.00
Algo Wizard Essentials Course with Srategy Quant
1 × $13.00 -
×
 High Probability Trading Using Elliott Wave And Fibonacci Analysis withVic Patel - Forex Training Group
1 × $10.00
High Probability Trading Using Elliott Wave And Fibonacci Analysis withVic Patel - Forex Training Group
1 × $10.00

Footprint Deep Dive
Original price was: $497.00.$15.00Current price is: $15.00.
File Size: Coming soon!
Delivery Time: 1–12 hours
Media Type: Online Course
MarketDelta – Footprint Deep Dive
Introduction
Welcome to our in-depth guide on MarketDelta – Footprint Deep Dive. This article explores the essential features, techniques, and benefits of using MarketDelta’s Footprint charts. Whether you’re a beginner or an experienced trader, understanding and leveraging Footprint charts can significantly enhance your trading accuracy and decision-making.
What is MarketDelta?
Definition
MarketDelta is a leading trading platform known for its advanced charting and analysis tools, particularly the Footprint chart, which provides a detailed view of market activity.
Importance
- Enhanced Market Analysis: Offers unique insights into order flow and market sentiment.
- Accurate Decision-Making: Helps traders make more informed decisions based on real-time data.
- Versatile Application: Suitable for various trading styles and markets.
Core Concepts of Footprint Charts
1. Understanding Footprint Charts
Definition
Footprint charts display detailed information about market activity, showing the number of trades executed at each price level during a specific time period.
Components
- Volume: Total number of contracts traded at each price level.
- Bid and Ask: Differentiates between buy and sell orders.
2. Benefits of Footprint Charts
Transparency
Provides a transparent view of market activity, revealing hidden trends and potential reversals.
Precision
Allows traders to pinpoint exact entry and exit points, reducing guesswork.
3. Types of Footprint Charts
Bid/Ask Footprint
Shows the number of buy and sell orders at each price level.
Volume Footprint
Displays the total volume traded at each price level.
Delta Footprint
Shows the difference between the number of buy and sell orders, indicating market sentiment.
Techniques for Using Footprint Charts
1. Identifying Market Trends
Analyzing Volume
High volume at specific price levels can indicate strong support or resistance.
Observing Order Flow
Consistent buy orders at higher prices suggest a bullish trend, while consistent sell orders at lower prices indicate a bearish trend.
2. Spotting Reversals
Volume Spikes
Sudden increases in volume at a specific price level can signal a potential market reversal.
Bid/Ask Imbalances
A significant imbalance between buy and sell orders can indicate a change in market direction.
3. Enhancing Entry and Exit Points
Precision Entries
Use Footprint charts to identify precise entry points by observing where buying or selling pressure is strongest.
Strategic Exits
Determine optimal exit points by analyzing where volume tapers off, suggesting a weakening trend.
Benefits of Using MarketDelta Footprint Charts
Detailed Market Insights
Provides granular details about market activity, helping traders understand the underlying forces driving price movements.
Improved Accuracy
Enhances the accuracy of trading decisions by offering a clear view of order flow and volume distribution.
Real-Time Data
Access to real-time data ensures that traders are always making decisions based on the most current market information.
Implementing Footprint Charts in Trading Strategies
Step-by-Step Guide
- Set Up Your Charts: Configure your MarketDelta platform with Footprint charts.
- Identify Key Levels: Look for significant levels of support and resistance using volume and order flow data.
- Monitor Order Flow: Observe the bid and ask orders to gauge market sentiment.
- Enter Trades: Use Footprint data to pinpoint precise entry points.
- Set Stop-Loss Orders: Place stop-loss orders based on where volume significantly drops off.
- Take Profits: Determine exit points by analyzing where buying or selling pressure weakens.
Example Strategy
Bullish Trading Strategy
- Identify Uptrend: Use Footprint charts to confirm a bullish trend through consistent buying pressure.
- Enter Trade: Buy at a price level where a significant volume of buy orders is present.
- Set Stop-Loss: Place a stop-loss order below a key support level identified by a high volume of sell orders.
- Take Profit: Exit the trade when buying pressure diminishes or at a pre-determined resistance level.
Common Mistakes to Avoid
Ignoring Market Context
Always consider the broader market context and avoid making decisions based solely on Footprint charts.
Overtrading
Stick to your trading plan and avoid taking trades that do not meet your criteria.
Neglecting Risk Management
Implement proper risk management techniques to protect your capital.
Tools and Resources for Footprint Trading
Trading Platforms
Choose a trading platform like MarketDelta that supports advanced Footprint charting and provides real-time data.
Educational Resources
Utilize books, online courses, and webinars to deepen your understanding of Footprint trading.
Success Stories with MarketDelta
Trader A’s Journey
Trader A significantly improved their trading accuracy and profitability by incorporating Footprint charts into their analysis.
Trader B’s Experience
Trader B found success by combining Footprint data with other technical indicators, leading to more informed trading decisions.
Conclusion
MarketDelta – Footprint Deep Dive offers a robust framework for mastering the use of Footprint charts in trading. By understanding the core concepts, implementing effective techniques, and managing risk, you can enhance your trading performance and achieve consistent success. Remember to stay disciplined, continuously educate yourself, and adapt to changing market conditions.
Commonly Asked Questions:
- Business Model Innovation: Accept the truth of a legitimate business! Our strategy is organising a group buy in which participants share the costs. We use these cash to acquire popular courses from sale pages and make them available to people with limited financial resources. Despite the authors’ worries, our clients love the cost and accessibility we give.
- The Legal Environment: Yes or No The legality of our activity is ambiguous. While we don’t have specific permission from the course authors to resell the material, there is a technicality at work. The author did not specify any limits on resale when purchasing the course. This legal intricacy is both an opportunity for us and a boon for individuals looking for low-cost access.
- Quality Control: Uncovering the Truth
Getting to the heart of the issue – quality. Purchasing the course straight from the sale page guarantees that all documents and resources are the same as those obtained through traditional channels.
However, we distinguish ourselves by going beyond personal research and resale. It is crucial to note that we are not the official course providers, which means that the following premium services are not included in our package:
- There are no scheduled coaching calls or sessions with the author.
- Access to the author’s private Facebook group or web portal is not permitted.
- No access to the author’s private membership forum.
- There is no direct email support available from the author or their team.
We operate independently, with the goal of bridging the pricing gap without the extra services provided by official course channels. Your comprehension of our distinct approach is much appreciated.
Be the first to review “Footprint Deep Dive”
You must be logged in to post a review.
Related products
Forex Trading
Original price was: $1,898.00.$10.00Current price is: $10.00.

Forex Trading
Original price was: $239.00.$8.00Current price is: $8.00.
Forex Trading
Original price was: $797.00.$10.00Current price is: $10.00.
Forex Trading
The Complete Guide to Multiple Time Frame Analysis & Reading Price Action with Aiman Almansoori
Original price was: $1,399.00.$13.00Current price is: $13.00.
Forex Trading
Original price was: $499.00.$15.00Current price is: $15.00.
Forex Trading
Original price was: $2,997.00.$23.00Current price is: $23.00.

Original price was: $197.00.$5.00Current price is: $5.00.

Forex Trading
Original price was: $249.00.$15.00Current price is: $15.00.
Original price was: $310.00.$23.00Current price is: $23.00.

Forex Trading
Original price was: $125.00.$17.00Current price is: $17.00.

Forex Trading
Original price was: $397.00.$31.00Current price is: $31.00.
Forex Trading
Original price was: $4,997.00.$27.00Current price is: $27.00.

Original price was: $1,849.00.$15.00Current price is: $15.00.

Original price was: $999.00.$5.00Current price is: $5.00.

Forex Trading
Original price was: $500.00.$5.00Current price is: $5.00.
Forex Trading
Original price was: $2,995.00.$31.00Current price is: $31.00.

Original price was: $700.00.$39.00Current price is: $39.00.
Original price was: $497.00.$11.00Current price is: $11.00.
Original price was: $695.00.$41.00Current price is: $41.00.

Original price was: $139.00.$23.00Current price is: $23.00.

Reviews
There are no reviews yet.