-
×
 Alexander Elder Full Courses Package
1 × $6.00
Alexander Elder Full Courses Package
1 × $6.00 -
×
 The Market Maker’s Edge with Josh Lukeman
1 × $6.00
The Market Maker’s Edge with Josh Lukeman
1 × $6.00 -
×
 Team Bull Trading Academy
1 × $5.00
Team Bull Trading Academy
1 × $5.00 -
×
 ICT Prodigy Trading Course – $650K in Payouts with Alex Solignani
1 × $15.00
ICT Prodigy Trading Course – $650K in Payouts with Alex Solignani
1 × $15.00 -
×
 How to Buy Stocks Before They Skyrocket
1 × $6.00
How to Buy Stocks Before They Skyrocket
1 × $6.00 -
×
 The A14 Weekly Option Strategy Workshop with Amy Meissner
1 × $23.00
The A14 Weekly Option Strategy Workshop with Amy Meissner
1 × $23.00 -
×
 Forex Trading Strategies Modules 1-3 Complete Set with Blake Young - Shadow Trader
1 × $54.00
Forex Trading Strategies Modules 1-3 Complete Set with Blake Young - Shadow Trader
1 × $54.00 -
×
 Secrets of Swiss Banking with Hoyt Barber
1 × $6.00
Secrets of Swiss Banking with Hoyt Barber
1 × $6.00 -
×
 Steve Jobs. The Greatest Second Act in the History of Business with Young Simon
1 × $6.00
Steve Jobs. The Greatest Second Act in the History of Business with Young Simon
1 × $6.00 -
×
 Professional Approaches to Directional Option Trading with Option Pit
1 × $23.00
Professional Approaches to Directional Option Trading with Option Pit
1 × $23.00 -
×
 Dan Sheridan Volatility Class
1 × $6.00
Dan Sheridan Volatility Class
1 × $6.00 -
×
 How To Build An Automated Trading Robot In Excel with Peter Titus - Marwood Research
1 × $15.00
How To Build An Automated Trading Robot In Excel with Peter Titus - Marwood Research
1 × $15.00 -
×
 Investing with LEAPS. What You Should Know About Long Term Investing with James Bittman
1 × $6.00
Investing with LEAPS. What You Should Know About Long Term Investing with James Bittman
1 × $6.00 -
×
 Best of AM Review (Volume 1-3) with Peter Bain
1 × $6.00
Best of AM Review (Volume 1-3) with Peter Bain
1 × $6.00 -
×
 Elliott Wave Indicator Suite for ThinkorSwim
1 × $15.00
Elliott Wave Indicator Suite for ThinkorSwim
1 × $15.00 -
×
 Ultimate Trading Course with Dodgy's Dungeon
1 × $8.00
Ultimate Trading Course with Dodgy's Dungeon
1 × $8.00 -
×
 More on the Short Cycles of Interest Rates (Article) with Arie Melnik, Alan Kraus
1 × $6.00
More on the Short Cycles of Interest Rates (Article) with Arie Melnik, Alan Kraus
1 × $6.00 -
×
 Short Term Trading. Integrated Pithfork Analysis with Dr. Mircea Dologa
1 × $6.00
Short Term Trading. Integrated Pithfork Analysis with Dr. Mircea Dologa
1 × $6.00 -
×
 Knowing Where the Energy is Coming From with Charles Drummond
1 × $6.00
Knowing Where the Energy is Coming From with Charles Drummond
1 × $6.00 -
×
 Crystal Ball Pack PLUS bonus Live Trade By Pat Mitchell - Trick Trades
1 × $20.00
Crystal Ball Pack PLUS bonus Live Trade By Pat Mitchell - Trick Trades
1 × $20.00 -
×
 The Binary Trigger (Video, Books) with John Piper
1 × $6.00
The Binary Trigger (Video, Books) with John Piper
1 × $6.00 -
×
 AI For Traders with Trading Markets
1 × $31.00
AI For Traders with Trading Markets
1 × $31.00 -
×
 Advanced Option Trading with Broken Wing Butterflys with Greg Loehr
1 × $9.00
Advanced Option Trading with Broken Wing Butterflys with Greg Loehr
1 × $9.00 -
×
 Ahead of the Curve with Joseph Ellis
1 × $6.00
Ahead of the Curve with Joseph Ellis
1 × $6.00 -
×
 Astro-Cycles and Speculative Markets with L.J.Jensen
1 × $6.00
Astro-Cycles and Speculative Markets with L.J.Jensen
1 × $6.00 -
×
 Advanced Trading Techniques 2 CDs with Sammy Chua
1 × $6.00
Advanced Trading Techniques 2 CDs with Sammy Chua
1 × $6.00 -
×
 Computational Financial Mathematics with Mathematica
1 × $6.00
Computational Financial Mathematics with Mathematica
1 × $6.00 -
×
 Secrets of a Winning Trader with Gareth Soloway
1 × $871.00
Secrets of a Winning Trader with Gareth Soloway
1 × $871.00 -
×
 Forex Trading Course. Turn $1,260 Into $12,300 In 30 Days with David Arena
1 × $6.00
Forex Trading Course. Turn $1,260 Into $12,300 In 30 Days with David Arena
1 × $6.00 -
×
 The Complete Guide to Multiple Time Frame Analysis & Reading Price Action with Aiman Almansoori
1 × $13.00
The Complete Guide to Multiple Time Frame Analysis & Reading Price Action with Aiman Almansoori
1 × $13.00 -
×
 FasTrack Premium with Note Conference
1 × $78.00
FasTrack Premium with Note Conference
1 × $78.00 -
×
 5 Day Volume Profile Analysis Indicator Course with Mark Stone
1 × $54.00
5 Day Volume Profile Analysis Indicator Course with Mark Stone
1 × $54.00 -
×
 Equity Trader 101 Course with KeyStone Trading
1 × $6.00
Equity Trader 101 Course with KeyStone Trading
1 × $6.00 -
×
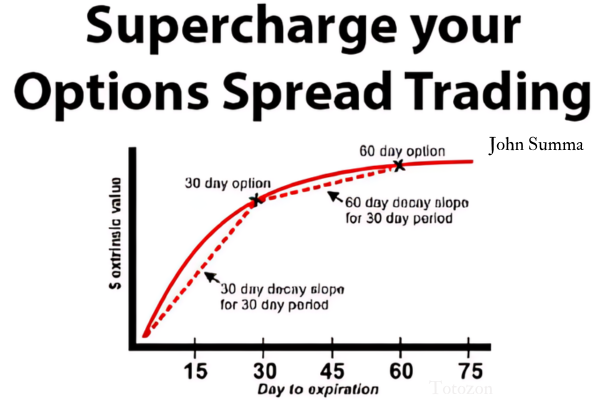 Supercharge your Options Spread Trading with John Summa
1 × $6.00
Supercharge your Options Spread Trading with John Summa
1 × $6.00 -
×
 How To Read The Market Professionally with TradeSmart
1 × $27.00
How To Read The Market Professionally with TradeSmart
1 × $27.00 -
×
 Euro Trading Course with Bkforex
1 × $6.00
Euro Trading Course with Bkforex
1 × $6.00 -
×
 The Best Option Trading Course with David Jaffee - Best Stock Strategy
1 × $15.00
The Best Option Trading Course with David Jaffee - Best Stock Strategy
1 × $15.00 -
×
 Master Commodities Course
1 × $6.00
Master Commodities Course
1 × $6.00 -
×
 Stock Market Wizards Interviews with America’s Top Stock Traders - Jack Schwager
1 × $6.00
Stock Market Wizards Interviews with America’s Top Stock Traders - Jack Schwager
1 × $6.00 -
×
 Inefficient Markets with Andrei Shleifer
1 × $6.00
Inefficient Markets with Andrei Shleifer
1 × $6.00 -
×
 7 Figures Forex Course
1 × $15.00
7 Figures Forex Course
1 × $15.00 -
×
 W. D Gann 's Square Of 9 Applied To Modern Markets with Sean Avidar - Hexatrade350
1 × $23.00
W. D Gann 's Square Of 9 Applied To Modern Markets with Sean Avidar - Hexatrade350
1 × $23.00 -
×
 White Phoenix’s The Smart (Money) Approach to Trading with Jayson Casper
1 × $39.00
White Phoenix’s The Smart (Money) Approach to Trading with Jayson Casper
1 × $39.00 -
×
 Forex in Five Full Time Strategies for Part Time Traders (fxstreet.com) - Raghee Horner
1 × $6.00
Forex in Five Full Time Strategies for Part Time Traders (fxstreet.com) - Raghee Horner
1 × $6.00 -
×
 The Trader's Mindset Course with Chris Mathews
1 × $6.00
The Trader's Mindset Course with Chris Mathews
1 × $6.00 -
×
 3 Volatility Strategies with Quantified Strategies
1 × $23.00
3 Volatility Strategies with Quantified Strategies
1 × $23.00 -
×
 Selective Forex Trading with Don Snellgrove
1 × $6.00
Selective Forex Trading with Don Snellgrove
1 × $6.00 -
×
 Fibonnacci Trader WorkShop (Video 2.38 GB) with Dennis Bolze, Thom Hartle
1 × $6.00
Fibonnacci Trader WorkShop (Video 2.38 GB) with Dennis Bolze, Thom Hartle
1 × $6.00 -
×
 The Profit Magic of Stock Transaction Timing with J.M.Hurst
1 × $6.00
The Profit Magic of Stock Transaction Timing with J.M.Hurst
1 × $6.00 -
×
 Order flow self-study training program with iMFtracker
1 × $10.00
Order flow self-study training program with iMFtracker
1 × $10.00

Elliott Flat Waves CD with David Elliott
$6.00
File Size: Coming soon!
Delivery Time: 1–12 hours
Media Type: Online Course
Content Proof: Watch Here!
You may check content proof of “Elliott Flat Waves CD with David Elliott” below:

Elliott Flat Waves CD with David Elliott
Introduction
Elliott Wave Theory is a cornerstone of technical analysis used by traders worldwide to predict market movements. David Elliott’s “Elliott Flat Waves CD” provides a detailed exploration of flat waves, a crucial component of this theory. In this article, we will delve into the concepts, significance, and practical applications of flat waves as discussed by Elliott, helping you to enhance your trading strategy effectively.
Understanding Elliott Wave Theory
Elliott Wave Theory, developed by Ralph Nelson Elliott, posits that market prices move in predictable patterns, which can be identified and leveraged for trading.
What Are Elliott Waves?
Elliott Waves are repetitive patterns in financial markets comprising five-wave impulsive phases and three-wave corrective phases.
Impulse Waves
Impulse waves consist of five waves that move in the direction of the main trend (1, 2, 3, 4, 5).
Corrective Waves
Corrective waves consist of three waves that move against the main trend (A, B, C).
Introduction to Flat Waves
Flat waves are a type of corrective wave pattern in Elliott Wave Theory. They are characterized by their sideways movement and limited price range.
Characteristics of Flat Waves
- Structure: Composed of three waves (A, B, C).
- Retracement: Wave B typically retraces more than 90% of Wave A.
- Pattern: Appears horizontal, hence the term ‘flat.’
Types of Flat Waves
- Regular Flat: Wave B retraces close to 100% of Wave A.
- Expanded Flat: Wave B exceeds the starting point of Wave A, and Wave C moves beyond the end of Wave A.
- Running Flat: Wave B exceeds the starting point of Wave A, but Wave C falls short of the end of Wave A.
Significance of Flat Waves in Trading
Flat waves provide traders with essential signals about market consolidations and potential future movements.
Why Flat Waves Matter
- Consolidation Indicators: Signal periods of market consolidation.
- Trend Continuation: Often precede the continuation of the main trend.
- Trading Opportunities: Provide clear entry and exit points.
Consolidation Indicators
Flat waves indicate periods where the market is neither making significant gains nor losses, often leading to significant future movements.
Identifying Flat Waves
Recognizing flat waves on a chart is crucial for applying Elliott Wave Theory effectively.
Steps to Identify Flat Waves
- Observe Wave Structure: Look for the three-wave (A, B, C) pattern.
- Check Retracement Levels: Confirm that Wave B retraces close to or beyond the start of Wave A.
- Analyze Market Context: Ensure the pattern fits within a corrective phase.
Key Indicators
- Wave Structure: Clear A, B, C formation.
- Retracement Analysis: Use Fibonacci retracement to verify levels.
Practical Application of Flat Waves
Step-by-Step Guide
- Identify Main Trend: Determine the direction of the primary trend.
- Spot Flat Waves: Look for flat wave patterns during corrective phases.
- Use Technical Indicators: Confirm patterns with tools like RSI and MACD.
- Plan Trades: Develop entry and exit strategies based on identified patterns.
Technical Indicators to Confirm
- Fibonacci Retracement: Validate retracement levels.
- RSI (Relative Strength Index): Check for overbought or oversold conditions.
- MACD (Moving Average Convergence Divergence): Confirm momentum.
Example Trade
A trader identifies an upward main trend and spots a flat wave correction. By using Fibonacci retracement, they confirm the levels and plan to enter the trade at the end of Wave C, expecting the trend to resume upwards.
Advantages of Using Flat Waves
Enhanced Predictive Power
Flat waves help traders anticipate market moves, providing an edge in forecasting trends.
Benefits
- Clear Signals: Offer distinct entry and exit points.
- Trend Confirmation: Assist in confirming the continuation of the main trend.
Improved Trading Performance
Utilizing flat waves can lead to more consistent trading results.
Performance Metrics
- Win Rate: Track the percentage of successful trades.
- Average Return: Measure average profit per trade.
- Risk Management: Monitor potential losses and adjust strategies accordingly.
Common Pitfalls and How to Avoid Them
Misidentifying Patterns
Flat waves can sometimes be mistaken for other corrective patterns.
Avoiding Misidentification
- Detailed Analysis: Conduct thorough analysis of wave structures.
- Multiple Confirmations: Use various technical indicators to confirm patterns.
Overtrading
Trading every identified flat wave can lead to unnecessary risks.
Avoiding Overtrading
- Selectivity: Trade only high-probability setups.
- Risk Management: Implement stop-loss orders to minimize potential losses.
Advanced Techniques
Combining Flat Waves with Other Patterns
Integrate flat waves with other Elliott Wave patterns for a comprehensive analysis.
Example
Combine flat waves with impulse waves to identify strong trend continuation points.
Using Multiple Time Frames
Analyze flat waves across different time frames for a more detailed market perspective.
Multiple Time Frame Analysis
- Long-Term Trends: Identify flat waves in higher time frames.
- Short-Term Opportunities: Use lower time frames for precise trade entries and exits.
Conclusion
David Elliott’s “Elliott Flat Waves CD” provides an in-depth look at one of the most essential corrective patterns in Elliott Wave Theory. By understanding and applying flat waves, traders can enhance their market analysis and improve their trading performance. Incorporating these patterns into your trading strategy can provide significant advantages and lead to more consistent and profitable outcomes.
FAQs
1. What are flat waves in Elliott Wave Theory?
Flat waves are a type of corrective pattern characterized by a three-wave structure (A, B, C) that generally moves sideways.
2. Why are flat waves important in trading?
Flat waves help predict future market movements, indicate trend continuation, and provide trading opportunities.
3. How can I identify flat waves in a chart?
Look for a three-wave pattern with Wave B retracing close to or beyond the start of Wave A. Use technical indicators for confirmation.
4. What are the different types of flat waves?
The main types are regular flat, expanded flat, and running flat, each with distinct retracement characteristics.
5. How can I incorporate flat waves into my trading strategy?
Identify the main trend, spot flat waves during corrections, confirm with indicators, and plan your entry and exit points based on the identified patterns.
Be the first to review “Elliott Flat Waves CD with David Elliott”
You must be logged in to post a review.
Related products

Original price was: $4,995.00.$15.00Current price is: $15.00.

Forex Trading
Original price was: $797.00.$10.00Current price is: $10.00.

Forex Trading
Original price was: $500.00.$5.00Current price is: $5.00.

Forex Trading
Original price was: $499.00.$15.00Current price is: $15.00.

Original price was: $997.00.$13.00Current price is: $13.00.
Original price was: $139.00.$23.00Current price is: $23.00.

Original price was: $999.00.$5.00Current price is: $5.00.

Forex Trading
Original price was: $697.00.$5.00Current price is: $5.00.

Forex Trading
Quantamentals – The Next Great Forefront Of Trading and Investing with Trading Markets
Original price was: $1,495.00.$8.00Current price is: $8.00.

Original price was: $997.00.$8.00Current price is: $8.00.

Forex Trading
Original price was: $850.00.$23.00Current price is: $23.00.
Original price was: $700.00.$39.00Current price is: $39.00.

Original price was: $497.00.$11.00Current price is: $11.00.
Original price was: $310.00.$23.00Current price is: $23.00.

Original price was: $197.00.$5.00Current price is: $5.00.

Original price was: $799.00.$15.00Current price is: $15.00.
Forex Trading
Original price was: $4,997.00.$27.00Current price is: $27.00.
Original price was: $1,849.00.$15.00Current price is: $15.00.

Forex Trading
Original price was: $249.00.$15.00Current price is: $15.00.

Original price was: $1,200.00.$23.00Current price is: $23.00.
Reviews
There are no reviews yet.