-
×
 The Aftermath + Jack Savage Extras (How To Trade Gold) with FXSavages
1 × $6.00
The Aftermath + Jack Savage Extras (How To Trade Gold) with FXSavages
1 × $6.00 -
×
 Crypto Trading Academy with Cheeky Investor - Aussie Day Trader
1 × $13.00
Crypto Trading Academy with Cheeky Investor - Aussie Day Trader
1 × $13.00 -
×
 The Orderflows Trade Opportunities Encyclopedia with Michael Valtos
1 × $8.00
The Orderflows Trade Opportunities Encyclopedia with Michael Valtos
1 × $8.00 -
×
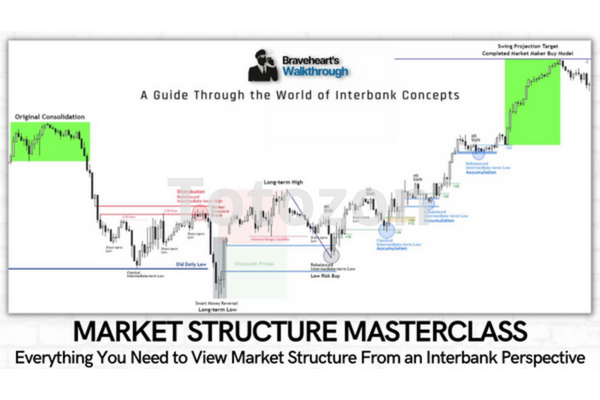 Market Structure Masterclass with Braveheart Trading
1 × $5.00
Market Structure Masterclass with Braveheart Trading
1 × $5.00 -
×
 Advanced Spread Trading with Guy Bower - MasterClass Trader
1 × $15.00
Advanced Spread Trading with Guy Bower - MasterClass Trader
1 × $15.00 -
×
 Crystal Ball Pack PLUS bonus Live Trade By Pat Mitchell - Trick Trades
1 × $20.00
Crystal Ball Pack PLUS bonus Live Trade By Pat Mitchell - Trick Trades
1 × $20.00 -
×
 EFT – The Art of Delivery with Gary Craig
1 × $5.00
EFT – The Art of Delivery with Gary Craig
1 × $5.00 -
×
 White Phoenix’s The Smart (Money) Approach to Trading with Jayson Casper
1 × $39.00
White Phoenix’s The Smart (Money) Approach to Trading with Jayson Casper
1 × $39.00 -
×
 Mastering Momentum Gaps with Toni Hansen
1 × $6.00
Mastering Momentum Gaps with Toni Hansen
1 × $6.00 -
×
 0 DTE Options Trading Workshop with Aeromir Corporation
1 × $15.00
0 DTE Options Trading Workshop with Aeromir Corporation
1 × $15.00 -
×
 Basic of Market Astrophisics with Hans Hannula
1 × $6.00
Basic of Market Astrophisics with Hans Hannula
1 × $6.00 -
×
 T3 Live - The Simple Art of Trading
1 × $31.00
T3 Live - The Simple Art of Trading
1 × $31.00 -
×
 Trading Short TermSame Day Trades Sep 2023 with Dan Sheridan & Mark Fenton - Sheridan Options Mentoring
1 × $31.00
Trading Short TermSame Day Trades Sep 2023 with Dan Sheridan & Mark Fenton - Sheridan Options Mentoring
1 × $31.00 -
×
 8 Year Presidential Election Pattern (Article) with Adam White
1 × $6.00
8 Year Presidential Election Pattern (Article) with Adam White
1 × $6.00 -
×
 Dan Sheridan Volatility Class
1 × $6.00
Dan Sheridan Volatility Class
1 × $6.00 -
×
 Algo Trading Masterclass with Ali Casey - StatOasis
1 × $23.00
Algo Trading Masterclass with Ali Casey - StatOasis
1 × $23.00 -
×
 Ultimate Trading Course with Dodgy's Dungeon
1 × $8.00
Ultimate Trading Course with Dodgy's Dungeon
1 × $8.00 -
×
 An Introduction to Capital Markets with Andrew M.Chisholm
1 × $6.00
An Introduction to Capital Markets with Andrew M.Chisholm
1 × $6.00 -
×
 Vertex Investing Course (2023)
1 × $8.00
Vertex Investing Course (2023)
1 × $8.00 -
×
 Investing in 401k Plans with Cliffsnotes
1 × $6.00
Investing in 401k Plans with Cliffsnotes
1 × $6.00 -
×
 TradeCraft: Your Path to Peak Performance Trading By Adam Grimes
1 × $15.00
TradeCraft: Your Path to Peak Performance Trading By Adam Grimes
1 × $15.00 -
×
 Scalp Strategy and Flipping Small Accounts with Opes Trading Group
1 × $5.00
Scalp Strategy and Flipping Small Accounts with Opes Trading Group
1 × $5.00 -
×
 30 Trading Classics with 3T Live
1 × $5.00
30 Trading Classics with 3T Live
1 × $5.00 -
×
 Yarimi University Course
1 × $56.00
Yarimi University Course
1 × $56.00 -
×
 Trading for a Bright Future with Martin Cole
1 × $6.00
Trading for a Bright Future with Martin Cole
1 × $6.00 -
×
 The New Technical Trader with Chande Kroll
1 × $6.00
The New Technical Trader with Chande Kroll
1 × $6.00 -
×
 TRADING NFX Course with Andrew NFX
1 × $5.00
TRADING NFX Course with Andrew NFX
1 × $5.00 -
×
 Trading Connors VIX Reversals Tradestation Files with Laurence A. Connors & Gregory J. Che
1 × $6.00
Trading Connors VIX Reversals Tradestation Files with Laurence A. Connors & Gregory J. Che
1 × $6.00 -
×
 The Best Option Trading Course with David Jaffee - Best Stock Strategy
1 × $15.00
The Best Option Trading Course with David Jaffee - Best Stock Strategy
1 × $15.00 -
×
 CAT 2007 Seminar with Stephen W.Bigalow
1 × $6.00
CAT 2007 Seminar with Stephen W.Bigalow
1 × $6.00 -
×
 A Really Friendly Guide to Wavelets with C.Vallens
1 × $6.00
A Really Friendly Guide to Wavelets with C.Vallens
1 × $6.00 -
×
 Compass Trading System with Right Line Trading
1 × $39.00
Compass Trading System with Right Line Trading
1 × $39.00 -
×
 Pattern Recognition: A Fundamental Introduction to Japanese Candlestick Charting Techniques Class with Jeff Bierman
1 × $6.00
Pattern Recognition: A Fundamental Introduction to Japanese Candlestick Charting Techniques Class with Jeff Bierman
1 × $6.00 -
×
 Fibonnacci Trader WorkShop (Video 2.38 GB) with Dennis Bolze, Thom Hartle
1 × $6.00
Fibonnacci Trader WorkShop (Video 2.38 GB) with Dennis Bolze, Thom Hartle
1 × $6.00 -
×
 ETF Trading Strategies Revealed with David Vomund
1 × $6.00
ETF Trading Strategies Revealed with David Vomund
1 × $6.00 -
×
 Best of the Best: Collars with Amy Meissner & Scott Ruble
1 × $15.00
Best of the Best: Collars with Amy Meissner & Scott Ruble
1 × $15.00 -
×
 The Indices Orderflow Masterclass with The Forex Scalpers
1 × $23.00
The Indices Orderflow Masterclass with The Forex Scalpers
1 × $23.00 -
×
 Elliott Wave Indicator Suite for ThinkorSwim
1 × $15.00
Elliott Wave Indicator Suite for ThinkorSwim
1 × $15.00 -
×
 The Beginners Guide to Commodities Investing with Brian & Gayle Rice
1 × $6.00
The Beginners Guide to Commodities Investing with Brian & Gayle Rice
1 × $6.00 -
×
 Practical Elliott Wave Trading Strategies with Robert Miner
1 × $6.00
Practical Elliott Wave Trading Strategies with Robert Miner
1 × $6.00 -
×
 Forex Project Advanced Course with Tyler Crowell
1 × $5.00
Forex Project Advanced Course with Tyler Crowell
1 × $5.00 -
×
 Wyckoff Unleashed Official Online Course (2018) with Wyckoffsmi
1 × $23.00
Wyckoff Unleashed Official Online Course (2018) with Wyckoffsmi
1 × $23.00 -
×
 The HV7 Option Trading System with Amy Meissner – Aeromir
1 × $8.00
The HV7 Option Trading System with Amy Meissner – Aeromir
1 × $8.00 -
×
 A PLAN TO MAKE $4K MONTHLY ON $20K with Dan Sheridan - Sheridan Options Mentoring
1 × $15.00
A PLAN TO MAKE $4K MONTHLY ON $20K with Dan Sheridan - Sheridan Options Mentoring
1 × $15.00 -
×
 Quarterly Theory with Trader Daye
1 × $20.00
Quarterly Theory with Trader Daye
1 × $20.00 -
×
 How To Read The Market Professionally with TradeSmart
1 × $27.00
How To Read The Market Professionally with TradeSmart
1 × $27.00 -
×
 Guidelines for Analysis and Establishing a Trading Plan with Charles Drummond
1 × $6.00
Guidelines for Analysis and Establishing a Trading Plan with Charles Drummond
1 × $6.00 -
×
 Essentials in Quantitative Trading QT01 By HangukQuant's
1 × $23.00
Essentials in Quantitative Trading QT01 By HangukQuant's
1 × $23.00 -
×
 The Prop Trading Code with Brannigan Barrett - Axia Futures
1 × $23.00
The Prop Trading Code with Brannigan Barrett - Axia Futures
1 × $23.00 -
×
 Day Trading with Volume Profile and Orderflow - Price Action Volume Trader
1 × $6.00
Day Trading with Volume Profile and Orderflow - Price Action Volume Trader
1 × $6.00 -
×
 Profinacci Complete Course with Stephen A.Pierce
1 × $6.00
Profinacci Complete Course with Stephen A.Pierce
1 × $6.00

Elliott Flat Waves CD with David Elliott
$6.00
File Size: Coming soon!
Delivery Time: 1–12 hours
Media Type: Online Course
Content Proof: Watch Here!
You may check content proof of “Elliott Flat Waves CD with David Elliott” below:

Elliott Flat Waves CD with David Elliott
Introduction
Elliott Wave Theory is a cornerstone of technical analysis used by traders worldwide to predict market movements. David Elliott’s “Elliott Flat Waves CD” provides a detailed exploration of flat waves, a crucial component of this theory. In this article, we will delve into the concepts, significance, and practical applications of flat waves as discussed by Elliott, helping you to enhance your trading strategy effectively.
Understanding Elliott Wave Theory
Elliott Wave Theory, developed by Ralph Nelson Elliott, posits that market prices move in predictable patterns, which can be identified and leveraged for trading.
What Are Elliott Waves?
Elliott Waves are repetitive patterns in financial markets comprising five-wave impulsive phases and three-wave corrective phases.
Impulse Waves
Impulse waves consist of five waves that move in the direction of the main trend (1, 2, 3, 4, 5).
Corrective Waves
Corrective waves consist of three waves that move against the main trend (A, B, C).
Introduction to Flat Waves
Flat waves are a type of corrective wave pattern in Elliott Wave Theory. They are characterized by their sideways movement and limited price range.
Characteristics of Flat Waves
- Structure: Composed of three waves (A, B, C).
- Retracement: Wave B typically retraces more than 90% of Wave A.
- Pattern: Appears horizontal, hence the term ‘flat.’
Types of Flat Waves
- Regular Flat: Wave B retraces close to 100% of Wave A.
- Expanded Flat: Wave B exceeds the starting point of Wave A, and Wave C moves beyond the end of Wave A.
- Running Flat: Wave B exceeds the starting point of Wave A, but Wave C falls short of the end of Wave A.
Significance of Flat Waves in Trading
Flat waves provide traders with essential signals about market consolidations and potential future movements.
Why Flat Waves Matter
- Consolidation Indicators: Signal periods of market consolidation.
- Trend Continuation: Often precede the continuation of the main trend.
- Trading Opportunities: Provide clear entry and exit points.
Consolidation Indicators
Flat waves indicate periods where the market is neither making significant gains nor losses, often leading to significant future movements.
Identifying Flat Waves
Recognizing flat waves on a chart is crucial for applying Elliott Wave Theory effectively.
Steps to Identify Flat Waves
- Observe Wave Structure: Look for the three-wave (A, B, C) pattern.
- Check Retracement Levels: Confirm that Wave B retraces close to or beyond the start of Wave A.
- Analyze Market Context: Ensure the pattern fits within a corrective phase.
Key Indicators
- Wave Structure: Clear A, B, C formation.
- Retracement Analysis: Use Fibonacci retracement to verify levels.
Practical Application of Flat Waves
Step-by-Step Guide
- Identify Main Trend: Determine the direction of the primary trend.
- Spot Flat Waves: Look for flat wave patterns during corrective phases.
- Use Technical Indicators: Confirm patterns with tools like RSI and MACD.
- Plan Trades: Develop entry and exit strategies based on identified patterns.
Technical Indicators to Confirm
- Fibonacci Retracement: Validate retracement levels.
- RSI (Relative Strength Index): Check for overbought or oversold conditions.
- MACD (Moving Average Convergence Divergence): Confirm momentum.
Example Trade
A trader identifies an upward main trend and spots a flat wave correction. By using Fibonacci retracement, they confirm the levels and plan to enter the trade at the end of Wave C, expecting the trend to resume upwards.
Advantages of Using Flat Waves
Enhanced Predictive Power
Flat waves help traders anticipate market moves, providing an edge in forecasting trends.
Benefits
- Clear Signals: Offer distinct entry and exit points.
- Trend Confirmation: Assist in confirming the continuation of the main trend.
Improved Trading Performance
Utilizing flat waves can lead to more consistent trading results.
Performance Metrics
- Win Rate: Track the percentage of successful trades.
- Average Return: Measure average profit per trade.
- Risk Management: Monitor potential losses and adjust strategies accordingly.
Common Pitfalls and How to Avoid Them
Misidentifying Patterns
Flat waves can sometimes be mistaken for other corrective patterns.
Avoiding Misidentification
- Detailed Analysis: Conduct thorough analysis of wave structures.
- Multiple Confirmations: Use various technical indicators to confirm patterns.
Overtrading
Trading every identified flat wave can lead to unnecessary risks.
Avoiding Overtrading
- Selectivity: Trade only high-probability setups.
- Risk Management: Implement stop-loss orders to minimize potential losses.
Advanced Techniques
Combining Flat Waves with Other Patterns
Integrate flat waves with other Elliott Wave patterns for a comprehensive analysis.
Example
Combine flat waves with impulse waves to identify strong trend continuation points.
Using Multiple Time Frames
Analyze flat waves across different time frames for a more detailed market perspective.
Multiple Time Frame Analysis
- Long-Term Trends: Identify flat waves in higher time frames.
- Short-Term Opportunities: Use lower time frames for precise trade entries and exits.
Conclusion
David Elliott’s “Elliott Flat Waves CD” provides an in-depth look at one of the most essential corrective patterns in Elliott Wave Theory. By understanding and applying flat waves, traders can enhance their market analysis and improve their trading performance. Incorporating these patterns into your trading strategy can provide significant advantages and lead to more consistent and profitable outcomes.
FAQs
1. What are flat waves in Elliott Wave Theory?
Flat waves are a type of corrective pattern characterized by a three-wave structure (A, B, C) that generally moves sideways.
2. Why are flat waves important in trading?
Flat waves help predict future market movements, indicate trend continuation, and provide trading opportunities.
3. How can I identify flat waves in a chart?
Look for a three-wave pattern with Wave B retracing close to or beyond the start of Wave A. Use technical indicators for confirmation.
4. What are the different types of flat waves?
The main types are regular flat, expanded flat, and running flat, each with distinct retracement characteristics.
5. How can I incorporate flat waves into my trading strategy?
Identify the main trend, spot flat waves during corrections, confirm with indicators, and plan your entry and exit points based on the identified patterns.
Be the first to review “Elliott Flat Waves CD with David Elliott”
You must be logged in to post a review.
Related products
Forex Trading
Original price was: $850.00.$23.00Current price is: $23.00.
Original price was: $4,995.00.$15.00Current price is: $15.00.

Original price was: $997.00.$8.00Current price is: $8.00.
Original price was: $799.00.$15.00Current price is: $15.00.

Forex Trading
Original price was: $249.00.$15.00Current price is: $15.00.

Forex Trading
Original price was: $799.00.$15.00Current price is: $15.00.

Forex Trading
Original price was: $2,995.00.$31.00Current price is: $31.00.
Original price was: $895.00.$15.00Current price is: $15.00.
Original price was: $1,849.00.$15.00Current price is: $15.00.
Forex Trading
Original price was: $1,098.00.$39.00Current price is: $39.00.
Original price was: $299.00.$8.00Current price is: $8.00.

Original price was: $695.00.$41.00Current price is: $41.00.

Forex Trading
Quantamentals – The Next Great Forefront Of Trading and Investing with Trading Markets
Original price was: $1,495.00.$8.00Current price is: $8.00.

Original price was: $497.00.$31.00Current price is: $31.00.

Original price was: $2,120.00.$15.00Current price is: $15.00.

Original price was: $310.00.$23.00Current price is: $23.00.
Forex Trading
Original price was: $4,997.00.$27.00Current price is: $27.00.
Original price was: $700.00.$39.00Current price is: $39.00.
Forex Trading
Original price was: $239.00.$8.00Current price is: $8.00.

Forex Trading
Original price was: $499.00.$15.00Current price is: $15.00.
Reviews
There are no reviews yet.