-
×
 European Members - March 2023 with Stockbee
1 × $5.00
European Members - March 2023 with Stockbee
1 × $5.00 -
×
 Options Trading & Ultimate MasterClass With Tyrone Abela - FX Evolution
1 × $54.00
Options Trading & Ultimate MasterClass With Tyrone Abela - FX Evolution
1 × $54.00 -
×
 ProfileTraders - Swing and Price Analysis (May 2014)
1 × $6.00
ProfileTraders - Swing and Price Analysis (May 2014)
1 × $6.00 -
×
 Crystal Ball Pack PLUS bonus Live Trade By Pat Mitchell - Trick Trades
1 × $20.00
Crystal Ball Pack PLUS bonus Live Trade By Pat Mitchell - Trick Trades
1 × $20.00 -
×
 The New Science of Asset Allocation with Thomas Schneeweis
1 × $6.00
The New Science of Asset Allocation with Thomas Schneeweis
1 × $6.00 -
×
 The Complete Guide to Multiple Time Frame Analysis & Reading Price Action with Aiman Almansoori
1 × $13.00
The Complete Guide to Multiple Time Frame Analysis & Reading Price Action with Aiman Almansoori
1 × $13.00 -
×
 HunterFX Video Course with HunterFX
1 × $6.00
HunterFX Video Course with HunterFX
1 × $6.00 -
×
 The Naked Eye: Raw Data Analytics with Edgar Torres - Raw Data Analytics
1 × $8.00
The Naked Eye: Raw Data Analytics with Edgar Torres - Raw Data Analytics
1 × $8.00 -
×
 A Trader's Guide to Self-Discipline: Proven Techniques to Improve Trading Profits
1 × $6.00
A Trader's Guide to Self-Discipline: Proven Techniques to Improve Trading Profits
1 × $6.00 -
×
 W. D Gann 's Square Of 9 Applied To Modern Markets with Sean Avidar - Hexatrade350
1 × $23.00
W. D Gann 's Square Of 9 Applied To Modern Markets with Sean Avidar - Hexatrade350
1 × $23.00 -
×
 Quantamentals - The Next Great Forefront Of Trading and Investing with Trading Markets
1 × $8.00
Quantamentals - The Next Great Forefront Of Trading and Investing with Trading Markets
1 × $8.00 -
×
 Option Insanity Strategy with PDS Trader
1 × $69.00
Option Insanity Strategy with PDS Trader
1 × $69.00 -
×
 Matrix Spread Options Trading Course with Base Camp Trading
1 × $31.00
Matrix Spread Options Trading Course with Base Camp Trading
1 × $31.00 -
×
 The Trader's Mindset Course with Chris Mathews
1 × $6.00
The Trader's Mindset Course with Chris Mathews
1 × $6.00 -
×
 TradeCraft: Your Path to Peak Performance Trading By Adam Grimes
1 × $15.00
TradeCraft: Your Path to Peak Performance Trading By Adam Grimes
1 × $15.00 -
×
 How to Trade Diagonal Triangles. Superior Risk Reward Trade Setups
1 × $6.00
How to Trade Diagonal Triangles. Superior Risk Reward Trade Setups
1 × $6.00 -
×
 5 Steps to Investment Success with Tyler Bolhorn
1 × $6.00
5 Steps to Investment Success with Tyler Bolhorn
1 × $6.00 -
×
 Short-Term Trading with Precision Timing - Jack Bernstein
1 × $6.00
Short-Term Trading with Precision Timing - Jack Bernstein
1 × $6.00 -
×
 All About Bonds, Bond Mutual Funds & Bond ETFs (3rd Ed.) with Esme Faerber
1 × $6.00
All About Bonds, Bond Mutual Funds & Bond ETFs (3rd Ed.) with Esme Faerber
1 × $6.00 -
×
 Forecast 2024 Clarification with Larry Williams
1 × $15.00
Forecast 2024 Clarification with Larry Williams
1 × $15.00 -
×
 All About High-Frequency Trading with Michael Durbin
1 × $6.00
All About High-Frequency Trading with Michael Durbin
1 × $6.00 -
×
 How to Avoid Tax on Your Stock Market Profits with Lee Hadnum
1 × $6.00
How to Avoid Tax on Your Stock Market Profits with Lee Hadnum
1 × $6.00 -
×
 White Phoenix’s The Smart (Money) Approach to Trading with Jayson Casper
1 × $39.00
White Phoenix’s The Smart (Money) Approach to Trading with Jayson Casper
1 × $39.00 -
×
 Algo Trading Masterclass with Ali Casey - StatOasis
1 × $23.00
Algo Trading Masterclass with Ali Casey - StatOasis
1 × $23.00 -
×
 A Comprehensive Guide to Intraday Trading Strategies & Setups Class with Jeff Bierman
1 × $6.00
A Comprehensive Guide to Intraday Trading Strategies & Setups Class with Jeff Bierman
1 × $6.00 -
×
 ActiveBeta Indexes. Capturing Systematic Sources of Active Equity Returns (HTML) with Andrew Lo
1 × $6.00
ActiveBeta Indexes. Capturing Systematic Sources of Active Equity Returns (HTML) with Andrew Lo
1 × $6.00 -
×
 The Prop Trading Code with Brannigan Barrett - Axia Futures
1 × $23.00
The Prop Trading Code with Brannigan Barrett - Axia Futures
1 × $23.00 -
×
 Advanced Scalping Techniques Home Study Course with Sami Abusaad - T3Live
1 × $31.00
Advanced Scalping Techniques Home Study Course with Sami Abusaad - T3Live
1 × $31.00 -
×
 All About Stock Market Strategies: The Easy Way To Get Started (All About Series) with David Brown
1 × $6.00
All About Stock Market Strategies: The Easy Way To Get Started (All About Series) with David Brown
1 × $6.00 -
×
 Activedaytrader - Mastering Technicals
1 × $15.00
Activedaytrader - Mastering Technicals
1 × $15.00 -
×
 Bond Market Course with The Macro Compass
1 × $15.00
Bond Market Course with The Macro Compass
1 × $15.00 -
×
 Starter Guide to Investing Stocks, Crypto & Precious Metals with Ryan Hogue
1 × $5.00
Starter Guide to Investing Stocks, Crypto & Precious Metals with Ryan Hogue
1 × $5.00 -
×
 Trading for a Bright Future with Martin Cole
1 × $6.00
Trading for a Bright Future with Martin Cole
1 × $6.00 -
×
 The Trading Blueprint with Brad Goh - The Trading Geek
1 × $5.00
The Trading Blueprint with Brad Goh - The Trading Geek
1 × $5.00 -
×
 501 Stock Market Tips & Guidelines with Arshad Khan
1 × $6.00
501 Stock Market Tips & Guidelines with Arshad Khan
1 × $6.00 -
×
 Advanced Spread Trading with Guy Bower - MasterClass Trader
1 × $15.00
Advanced Spread Trading with Guy Bower - MasterClass Trader
1 × $15.00 -
×
 The Indices Orderflow Masterclass with The Forex Scalpers
1 × $23.00
The Indices Orderflow Masterclass with The Forex Scalpers
1 × $23.00 -
×
 Candlestick Secrets For Profiting In Options
1 × $23.00
Candlestick Secrets For Profiting In Options
1 × $23.00 -
×
 4 Class Bundle
1 × $31.00
4 Class Bundle
1 × $31.00 -
×
 A Really Friendly Guide to Wavelets with C.Vallens
1 × $6.00
A Really Friendly Guide to Wavelets with C.Vallens
1 × $6.00 -
×
 Futures Commodity Trading with G. Scott Martin
1 × $6.00
Futures Commodity Trading with G. Scott Martin
1 × $6.00 -
×
 Candlestick Charts with Clive Lambert
1 × $6.00
Candlestick Charts with Clive Lambert
1 × $6.00 -
×
 Forex Trading Education Program (Apr-June 2010) with Jimmy Young
1 × $6.00
Forex Trading Education Program (Apr-June 2010) with Jimmy Young
1 × $6.00 -
×
 High Probability Trading Using Elliott Wave And Fibonacci Analysis withVic Patel - Forex Training Group
1 × $10.00
High Probability Trading Using Elliott Wave And Fibonacci Analysis withVic Patel - Forex Training Group
1 × $10.00 -
×
 Private Access Pro Webinars 2021-2022 with Trader Lion
1 × $5.00
Private Access Pro Webinars 2021-2022 with Trader Lion
1 × $5.00 -
×
 Technical Analysis for the Trading Professional with Constance Brown
1 × $6.00
Technical Analysis for the Trading Professional with Constance Brown
1 × $6.00 -
×
 Mastertrader – Mastering Swing Trading
1 × $31.00
Mastertrader – Mastering Swing Trading
1 × $31.00 -
×
 Scalp Strategy and Flipping Small Accounts with Opes Trading Group
1 × $5.00
Scalp Strategy and Flipping Small Accounts with Opes Trading Group
1 × $5.00 -
×
 An Ultimate Guide to Successful Investing with Trading Tuitions
1 × $23.00
An Ultimate Guide to Successful Investing with Trading Tuitions
1 × $23.00 -
×
 AstroFX Course
1 × $6.00
AstroFX Course
1 × $6.00 -
×
 Essential Stock Picking Strategies with Daniel Strachman
1 × $6.00
Essential Stock Picking Strategies with Daniel Strachman
1 × $6.00 -
×
 Equity Trader 101 Course with KeyStone Trading
1 × $6.00
Equity Trader 101 Course with KeyStone Trading
1 × $6.00 -
×
 Market Forecasting. Stocks and Grain
1 × $6.00
Market Forecasting. Stocks and Grain
1 × $6.00 -
×
 Gann’s Scientific Methods Unveiled (Vol I, II)
1 × $6.00
Gann’s Scientific Methods Unveiled (Vol I, II)
1 × $6.00 -
×
 Sixpart Study Guide to Market Profile
1 × $6.00
Sixpart Study Guide to Market Profile
1 × $6.00 -
×
 5 Basic Elliott Wave Patterns + Technical Tools = Trading Success with Jeffrey Kennedy
1 × $15.00
5 Basic Elliott Wave Patterns + Technical Tools = Trading Success with Jeffrey Kennedy
1 × $15.00 -
×
 AG Trading Journal with Ace Gazette
1 × $6.00
AG Trading Journal with Ace Gazette
1 × $6.00 -
×
 MAP. Moving Average Patterns CD with David Elliott
1 × $6.00
MAP. Moving Average Patterns CD with David Elliott
1 × $6.00 -
×
 AI For Traders with Trading Markets
1 × $31.00
AI For Traders with Trading Markets
1 × $31.00 -
×
 Getting New Insights from Old Indicators with Martin Pring
1 × $6.00
Getting New Insights from Old Indicators with Martin Pring
1 × $6.00 -
×
 How to Call the Top in a Stock (To the Penny!) and Earn 9-11% Annualized Cash Yields Doing It with Dan Ferris
1 × $6.00
How to Call the Top in a Stock (To the Penny!) and Earn 9-11% Annualized Cash Yields Doing It with Dan Ferris
1 × $6.00 -
×
 Financial Fortress with TradeSmart University
1 × $6.00
Financial Fortress with TradeSmart University
1 × $6.00 -
×
 Simple Methods for Detecting Buying and Selling Points in Securities with James Liveright
1 × $6.00
Simple Methods for Detecting Buying and Selling Points in Securities with James Liveright
1 × $6.00 -
×
 The Crash of 1997 (Article) with Hans Hannula
1 × $6.00
The Crash of 1997 (Article) with Hans Hannula
1 × $6.00 -
×
 Simple Forex Profits with Rayy Bannzz
1 × $31.00
Simple Forex Profits with Rayy Bannzz
1 × $31.00 -
×
 Day Trading and Swing Trading the Currency Market with Kathy Lien
1 × $6.00
Day Trading and Swing Trading the Currency Market with Kathy Lien
1 × $6.00 -
×
 The Random Character of Interest Rates with Joseph Murphy
1 × $6.00
The Random Character of Interest Rates with Joseph Murphy
1 × $6.00 -
×
 The Orderflow Masterclass with PrimeTrading
1 × $17.00
The Orderflow Masterclass with PrimeTrading
1 × $17.00 -
×
 Natural Language Processing in Trading with Dr. Terry Benzschawel
1 × $31.00
Natural Language Processing in Trading with Dr. Terry Benzschawel
1 × $31.00 -
×
 Self-Managed Trading with Stochastics By George Lane
1 × $4.00
Self-Managed Trading with Stochastics By George Lane
1 × $4.00 -
×
 Learn To Profit From The Forex Market with FX Hustle
1 × $6.00
Learn To Profit From The Forex Market with FX Hustle
1 × $6.00 -
×
 The Afluent Desktop Currency Trader with Amin Sadak
1 × $6.00
The Afluent Desktop Currency Trader with Amin Sadak
1 × $6.00 -
×
 Trading Natural Resources in a Volatile Market with Kevin Kerr
1 × $6.00
Trading Natural Resources in a Volatile Market with Kevin Kerr
1 × $6.00 -
×
 Alternative Beta Strategies & Hedge Fund Replication with Lars Jaeger & Jeffrey Pease
1 × $6.00
Alternative Beta Strategies & Hedge Fund Replication with Lars Jaeger & Jeffrey Pease
1 × $6.00 -
×
 Scalping the Forex
1 × $6.00
Scalping the Forex
1 × $6.00 -
×
 The Market Geometry Basic Seminar DVD with Market Geometry
1 × $31.00
The Market Geometry Basic Seminar DVD with Market Geometry
1 × $31.00 -
×
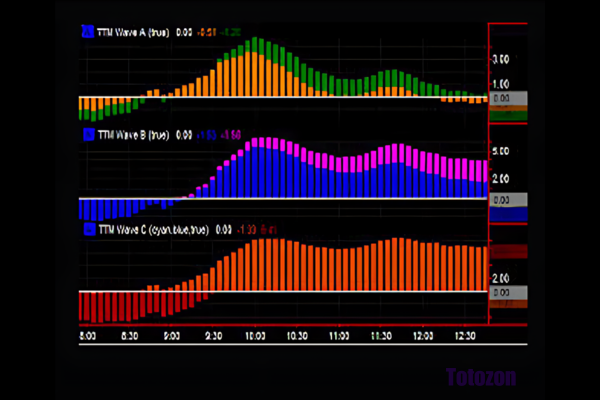 ABC Waves TOS Indicator & Live Class with Simpler Options
1 × $6.00
ABC Waves TOS Indicator & Live Class with Simpler Options
1 × $6.00 -
×
 Campaign Trading with John Sweeney
1 × $6.00
Campaign Trading with John Sweeney
1 × $6.00 -
×
 Price Action Trading Manual 2010
1 × $6.00
Price Action Trading Manual 2010
1 × $6.00 -
×
 Hedge Fund Market Wizards: How Winning Traders Win with Jack Schwager
1 × $6.00
Hedge Fund Market Wizards: How Winning Traders Win with Jack Schwager
1 × $6.00 -
×
 Edge Trading Group with Edge Elite
1 × $6.00
Edge Trading Group with Edge Elite
1 × $6.00 -
×
 The Precision Profit Float Indicator (TS Code & Setups) with Steve Woods
1 × $6.00
The Precision Profit Float Indicator (TS Code & Setups) with Steve Woods
1 × $6.00 -
×
 Crypto Trading Academy with Cheeky Investor - Aussie Day Trader
1 × $13.00
Crypto Trading Academy with Cheeky Investor - Aussie Day Trader
1 × $13.00

Elliott Flat Waves CD with David Elliott
$6.00
File Size: Coming soon!
Delivery Time: 1–12 hours
Media Type: Online Course
Content Proof: Watch Here!
You may check content proof of “Elliott Flat Waves CD with David Elliott” below:

Elliott Flat Waves CD with David Elliott
Introduction
Elliott Wave Theory is a cornerstone of technical analysis used by traders worldwide to predict market movements. David Elliott’s “Elliott Flat Waves CD” provides a detailed exploration of flat waves, a crucial component of this theory. In this article, we will delve into the concepts, significance, and practical applications of flat waves as discussed by Elliott, helping you to enhance your trading strategy effectively.
Understanding Elliott Wave Theory
Elliott Wave Theory, developed by Ralph Nelson Elliott, posits that market prices move in predictable patterns, which can be identified and leveraged for trading.
What Are Elliott Waves?
Elliott Waves are repetitive patterns in financial markets comprising five-wave impulsive phases and three-wave corrective phases.
Impulse Waves
Impulse waves consist of five waves that move in the direction of the main trend (1, 2, 3, 4, 5).
Corrective Waves
Corrective waves consist of three waves that move against the main trend (A, B, C).
Introduction to Flat Waves
Flat waves are a type of corrective wave pattern in Elliott Wave Theory. They are characterized by their sideways movement and limited price range.
Characteristics of Flat Waves
- Structure: Composed of three waves (A, B, C).
- Retracement: Wave B typically retraces more than 90% of Wave A.
- Pattern: Appears horizontal, hence the term ‘flat.’
Types of Flat Waves
- Regular Flat: Wave B retraces close to 100% of Wave A.
- Expanded Flat: Wave B exceeds the starting point of Wave A, and Wave C moves beyond the end of Wave A.
- Running Flat: Wave B exceeds the starting point of Wave A, but Wave C falls short of the end of Wave A.
Significance of Flat Waves in Trading
Flat waves provide traders with essential signals about market consolidations and potential future movements.
Why Flat Waves Matter
- Consolidation Indicators: Signal periods of market consolidation.
- Trend Continuation: Often precede the continuation of the main trend.
- Trading Opportunities: Provide clear entry and exit points.
Consolidation Indicators
Flat waves indicate periods where the market is neither making significant gains nor losses, often leading to significant future movements.
Identifying Flat Waves
Recognizing flat waves on a chart is crucial for applying Elliott Wave Theory effectively.
Steps to Identify Flat Waves
- Observe Wave Structure: Look for the three-wave (A, B, C) pattern.
- Check Retracement Levels: Confirm that Wave B retraces close to or beyond the start of Wave A.
- Analyze Market Context: Ensure the pattern fits within a corrective phase.
Key Indicators
- Wave Structure: Clear A, B, C formation.
- Retracement Analysis: Use Fibonacci retracement to verify levels.
Practical Application of Flat Waves
Step-by-Step Guide
- Identify Main Trend: Determine the direction of the primary trend.
- Spot Flat Waves: Look for flat wave patterns during corrective phases.
- Use Technical Indicators: Confirm patterns with tools like RSI and MACD.
- Plan Trades: Develop entry and exit strategies based on identified patterns.
Technical Indicators to Confirm
- Fibonacci Retracement: Validate retracement levels.
- RSI (Relative Strength Index): Check for overbought or oversold conditions.
- MACD (Moving Average Convergence Divergence): Confirm momentum.
Example Trade
A trader identifies an upward main trend and spots a flat wave correction. By using Fibonacci retracement, they confirm the levels and plan to enter the trade at the end of Wave C, expecting the trend to resume upwards.
Advantages of Using Flat Waves
Enhanced Predictive Power
Flat waves help traders anticipate market moves, providing an edge in forecasting trends.
Benefits
- Clear Signals: Offer distinct entry and exit points.
- Trend Confirmation: Assist in confirming the continuation of the main trend.
Improved Trading Performance
Utilizing flat waves can lead to more consistent trading results.
Performance Metrics
- Win Rate: Track the percentage of successful trades.
- Average Return: Measure average profit per trade.
- Risk Management: Monitor potential losses and adjust strategies accordingly.
Common Pitfalls and How to Avoid Them
Misidentifying Patterns
Flat waves can sometimes be mistaken for other corrective patterns.
Avoiding Misidentification
- Detailed Analysis: Conduct thorough analysis of wave structures.
- Multiple Confirmations: Use various technical indicators to confirm patterns.
Overtrading
Trading every identified flat wave can lead to unnecessary risks.
Avoiding Overtrading
- Selectivity: Trade only high-probability setups.
- Risk Management: Implement stop-loss orders to minimize potential losses.
Advanced Techniques
Combining Flat Waves with Other Patterns
Integrate flat waves with other Elliott Wave patterns for a comprehensive analysis.
Example
Combine flat waves with impulse waves to identify strong trend continuation points.
Using Multiple Time Frames
Analyze flat waves across different time frames for a more detailed market perspective.
Multiple Time Frame Analysis
- Long-Term Trends: Identify flat waves in higher time frames.
- Short-Term Opportunities: Use lower time frames for precise trade entries and exits.
Conclusion
David Elliott’s “Elliott Flat Waves CD” provides an in-depth look at one of the most essential corrective patterns in Elliott Wave Theory. By understanding and applying flat waves, traders can enhance their market analysis and improve their trading performance. Incorporating these patterns into your trading strategy can provide significant advantages and lead to more consistent and profitable outcomes.
FAQs
1. What are flat waves in Elliott Wave Theory?
Flat waves are a type of corrective pattern characterized by a three-wave structure (A, B, C) that generally moves sideways.
2. Why are flat waves important in trading?
Flat waves help predict future market movements, indicate trend continuation, and provide trading opportunities.
3. How can I identify flat waves in a chart?
Look for a three-wave pattern with Wave B retracing close to or beyond the start of Wave A. Use technical indicators for confirmation.
4. What are the different types of flat waves?
The main types are regular flat, expanded flat, and running flat, each with distinct retracement characteristics.
5. How can I incorporate flat waves into my trading strategy?
Identify the main trend, spot flat waves during corrections, confirm with indicators, and plan your entry and exit points based on the identified patterns.
Be the first to review “Elliott Flat Waves CD with David Elliott”
You must be logged in to post a review.
Related products

Forex Trading
Original price was: $1,098.00.$39.00Current price is: $39.00.

Original price was: $695.00.$41.00Current price is: $41.00.

Original price was: $497.00.$11.00Current price is: $11.00.
Forex Trading
The Complete Guide to Multiple Time Frame Analysis & Reading Price Action with Aiman Almansoori
Original price was: $1,399.00.$13.00Current price is: $13.00.

Forex Trading
Original price was: $4,997.00.$27.00Current price is: $27.00.
Forex Trading
Original price was: $697.00.$5.00Current price is: $5.00.

Original price was: $197.00.$5.00Current price is: $5.00.

Original price was: $2,120.00.$15.00Current price is: $15.00.
Original price was: $999.00.$5.00Current price is: $5.00.
Original price was: $4,995.00.$15.00Current price is: $15.00.

Original price was: $1,849.00.$15.00Current price is: $15.00.

Forex Trading
Original price was: $799.00.$15.00Current price is: $15.00.
Forex Trading
Original price was: $2,995.00.$31.00Current price is: $31.00.
Original price was: $1,800.00.$54.00Current price is: $54.00.
Forex Trading
Quantamentals – The Next Great Forefront Of Trading and Investing with Trading Markets
Original price was: $1,495.00.$8.00Current price is: $8.00.
Forex Trading
Original price was: $797.00.$10.00Current price is: $10.00.

Forex Trading
Original price was: $850.00.$23.00Current price is: $23.00.

Original price was: $799.00.$15.00Current price is: $15.00.
Original price was: $450.00.$23.00Current price is: $23.00.

Forex Trading
Original price was: $550.00.$5.00Current price is: $5.00.
Reviews
There are no reviews yet.