-
×
 ICT Prodigy Trading Course – $650K in Payouts with Alex Solignani
1 × $15.00
ICT Prodigy Trading Course – $650K in Payouts with Alex Solignani
1 × $15.00 -
×
 Scalp Strategy and Flipping Small Accounts with Opes Trading Group
1 × $5.00
Scalp Strategy and Flipping Small Accounts with Opes Trading Group
1 × $5.00 -
×
 Home Run Options Trading Course with Dave Aquino - Base Camp Trading
1 × $11.00
Home Run Options Trading Course with Dave Aquino - Base Camp Trading
1 × $11.00 -
×
 W. D Gann 's Square Of 9 Applied To Modern Markets with Sean Avidar - Hexatrade350
1 × $23.00
W. D Gann 's Square Of 9 Applied To Modern Markets with Sean Avidar - Hexatrade350
1 × $23.00 -
×
 The Orderflows Trade Opportunities Encyclopedia with Michael Valtos
1 × $8.00
The Orderflows Trade Opportunities Encyclopedia with Michael Valtos
1 × $8.00 -
×
 Patterns to Profits with Ryan Mallory - Share Planner
1 × $6.00
Patterns to Profits with Ryan Mallory - Share Planner
1 × $6.00 -
×
 Options Trading & Ultimate MasterClass With Tyrone Abela - FX Evolution
1 × $54.00
Options Trading & Ultimate MasterClass With Tyrone Abela - FX Evolution
1 × $54.00 -
×
 Speculating with Futures and Traditional Commodities with Liverpool Group
1 × $6.00
Speculating with Futures and Traditional Commodities with Liverpool Group
1 × $6.00 -
×
 Altcoin Investing Course with Rekt Capital
1 × $5.00
Altcoin Investing Course with Rekt Capital
1 × $5.00 -
×
 Advanced Spread Trading with Guy Bower - MasterClass Trader
1 × $15.00
Advanced Spread Trading with Guy Bower - MasterClass Trader
1 × $15.00 -
×
 Best of the Best: Collars with Amy Meissner & Scott Ruble
1 × $15.00
Best of the Best: Collars with Amy Meissner & Scott Ruble
1 × $15.00 -
×
 AI For Traders with Trading Markets
1 × $31.00
AI For Traders with Trading Markets
1 × $31.00 -
×
 Matrix Spread Options Trading Course with Base Camp Trading
1 × $31.00
Matrix Spread Options Trading Course with Base Camp Trading
1 × $31.00 -
×
 High Probability Trading Using Elliott Wave And Fibonacci Analysis withVic Patel - Forex Training Group
1 × $10.00
High Probability Trading Using Elliott Wave And Fibonacci Analysis withVic Patel - Forex Training Group
1 × $10.00 -
×
 Order flow self-study training program with iMFtracker
1 × $10.00
Order flow self-study training program with iMFtracker
1 × $10.00 -
×
 Inside the Mind of Trader Stewie - Art of Trading
1 × $23.00
Inside the Mind of Trader Stewie - Art of Trading
1 × $23.00 -
×
 The Orderflow Masterclass with PrimeTrading
1 × $17.00
The Orderflow Masterclass with PrimeTrading
1 × $17.00 -
×
 Trading Short TermSame Day Trades Sep 2023 with Dan Sheridan & Mark Fenton - Sheridan Options Mentoring
1 × $31.00
Trading Short TermSame Day Trades Sep 2023 with Dan Sheridan & Mark Fenton - Sheridan Options Mentoring
1 × $31.00 -
×
 $20 – 52k 20 pips a day challange with Rafał Zuchowicz - TopMasterTrader
1 × $5.00
$20 – 52k 20 pips a day challange with Rafał Zuchowicz - TopMasterTrader
1 × $5.00 -
×
 Quantamentals - The Next Great Forefront Of Trading and Investing with Trading Markets
1 × $8.00
Quantamentals - The Next Great Forefront Of Trading and Investing with Trading Markets
1 × $8.00 -
×
 The Indices Orderflow Masterclass with The Forex Scalpers
1 × $23.00
The Indices Orderflow Masterclass with The Forex Scalpers
1 × $23.00 -
×
 Fast Fibonacci for Day Traders
1 × $15.00
Fast Fibonacci for Day Traders
1 × $15.00 -
×
 0 DTE Options Trading Workshop with Aeromir Corporation
1 × $15.00
0 DTE Options Trading Workshop with Aeromir Corporation
1 × $15.00 -
×
 Butterfly and Condor Workshop with Aeromir
1 × $15.00
Butterfly and Condor Workshop with Aeromir
1 × $15.00 -
×
 SQX Mentorship with Tip Toe Hippo
1 × $23.00
SQX Mentorship with Tip Toe Hippo
1 × $23.00 -
×
 Bond Market Course with The Macro Compass
1 × $15.00
Bond Market Course with The Macro Compass
1 × $15.00 -
×
 Crystal Ball Pack PLUS bonus Live Trade By Pat Mitchell - Trick Trades
1 × $20.00
Crystal Ball Pack PLUS bonus Live Trade By Pat Mitchell - Trick Trades
1 × $20.00 -
×
 Crash Profits Make Money When Stocks Sink and Soar with Martin D.Weiss
1 × $6.00
Crash Profits Make Money When Stocks Sink and Soar with Martin D.Weiss
1 × $6.00 -
×
 The Complete Guide to Multiple Time Frame Analysis & Reading Price Action with Aiman Almansoori
1 × $13.00
The Complete Guide to Multiple Time Frame Analysis & Reading Price Action with Aiman Almansoori
1 × $13.00 -
×
 How To Read The Market Professionally with TradeSmart
1 × $27.00
How To Read The Market Professionally with TradeSmart
1 × $27.00 -
×
 Forecast 2024 Clarification with Larry Williams
1 × $15.00
Forecast 2024 Clarification with Larry Williams
1 × $15.00 -
×
 Crypto Trading Academy with Cheeky Investor - Aussie Day Trader
1 × $13.00
Crypto Trading Academy with Cheeky Investor - Aussie Day Trader
1 × $13.00 -
×
 The Prop Trading Code with Brannigan Barrett - Axia Futures
1 × $23.00
The Prop Trading Code with Brannigan Barrett - Axia Futures
1 × $23.00 -
×
 Forex Trading using Intermarket Analysis with Louis Mendelsohn
1 × $6.00
Forex Trading using Intermarket Analysis with Louis Mendelsohn
1 × $6.00 -
×
 Pit Bull with Martin Schwartz
1 × $6.00
Pit Bull with Martin Schwartz
1 × $6.00 -
×
 The Best Option Trading Course with David Jaffee - Best Stock Strategy
1 × $15.00
The Best Option Trading Course with David Jaffee - Best Stock Strategy
1 × $15.00 -
×
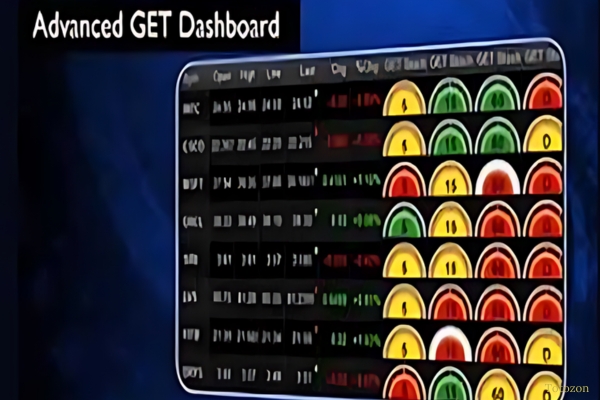 Advanced GET 8.0 EOD
1 × $6.00
Advanced GET 8.0 EOD
1 × $6.00 -
×
 WondaFX Signature Strategy with WondaFX
1 × $5.00
WondaFX Signature Strategy with WondaFX
1 × $5.00 -
×
 White Phoenix’s The Smart (Money) Approach to Trading with Jayson Casper
1 × $39.00
White Phoenix’s The Smart (Money) Approach to Trading with Jayson Casper
1 × $39.00 -
×
 Essentials in Quantitative Trading QT01 By HangukQuant's
1 × $23.00
Essentials in Quantitative Trading QT01 By HangukQuant's
1 × $23.00 -
×
 Generating Consistent Profits On Smaller Accounts
1 × $23.00
Generating Consistent Profits On Smaller Accounts
1 × $23.00 -
×
 The A14 Weekly Option Strategy Workshop with Amy Meissner
1 × $23.00
The A14 Weekly Option Strategy Workshop with Amy Meissner
1 × $23.00 -
×
 Hiden Collective Factors in Speculative Trading with Bertrand Roehner
1 × $6.00
Hiden Collective Factors in Speculative Trading with Bertrand Roehner
1 × $6.00 -
×
 Rockwell Trading - Can You Make A Living Day Trading - 2 DVD
1 × $6.00
Rockwell Trading - Can You Make A Living Day Trading - 2 DVD
1 × $6.00 -
×
 The Naked Eye: Raw Data Analytics with Edgar Torres - Raw Data Analytics
1 × $8.00
The Naked Eye: Raw Data Analytics with Edgar Torres - Raw Data Analytics
1 × $8.00 -
×
 Compass Trading System with Right Line Trading
1 × $39.00
Compass Trading System with Right Line Trading
1 × $39.00 -
×
 TradeCraft: Your Path to Peak Performance Trading By Adam Grimes
1 × $15.00
TradeCraft: Your Path to Peak Performance Trading By Adam Grimes
1 × $15.00 -
×
 Advanced Trading Strategies with Larry Connors
1 × $6.00
Advanced Trading Strategies with Larry Connors
1 × $6.00 -
×
 Traders Forge with Ryan Litchfield
1 × $6.00
Traders Forge with Ryan Litchfield
1 × $6.00 -
×
 Forex Strategy Master with Russ Horn
1 × $6.00
Forex Strategy Master with Russ Horn
1 × $6.00 -
×
 Practical Astro with Ruth Miller & Iam Williams
1 × $6.00
Practical Astro with Ruth Miller & Iam Williams
1 × $6.00 -
×
 Using Robert’s Indicators with Rob Hoffman
1 × $6.00
Using Robert’s Indicators with Rob Hoffman
1 × $6.00 -
×
 Deep Dive Butterfly Trading Strategy Class with SJG Trades
1 × $41.00
Deep Dive Butterfly Trading Strategy Class with SJG Trades
1 × $41.00 -
×
 The Trading Blueprint with Brad Goh - The Trading Geek
1 × $5.00
The Trading Blueprint with Brad Goh - The Trading Geek
1 × $5.00 -
×
 Ultimate Trading Course with Dodgy's Dungeon
1 × $8.00
Ultimate Trading Course with Dodgy's Dungeon
1 × $8.00 -
×
 Complete Guide to Online Stock Market Investing (2nd Edition) with Alexander Davidson
1 × $6.00
Complete Guide to Online Stock Market Investing (2nd Edition) with Alexander Davidson
1 × $6.00 -
×
 TRADING NFX Course with Andrew NFX
1 × $5.00
TRADING NFX Course with Andrew NFX
1 × $5.00

Day Trading with Lines in the Sky By R.L.Muehlberg
$6.00
File Size: 19.8 MB
Delivery Time: 1–12 hours
Media Type: Online Course
You may check content of “DayTrading with Lines in the Sky By R.L.Muehlberg” below:
Introduction
Day trading is an exhilarating and potentially profitable endeavor that attracts many traders worldwide. “Day Trading with Lines in the Sky” by R.L. Muehlberg offers a unique approach to this trading style, focusing on specific technical analysis techniques that use “lines in the sky” to predict market movements. In this article, we will delve into the core concepts of Muehlberg’s strategy, exploring how these lines can help traders make informed decisions.
Understanding Lines in the Sky
What Are Lines in the Sky?
Definition
- Technical Lines: Lines in the sky refer to specific technical indicators and trend lines drawn on stock charts to predict future price movements.
- Purpose: These lines help traders identify support and resistance levels, trend directions, and potential reversal points.
Importance of Lines in Trading
Trend Identification
- Bullish Trends: Identifying upward trends to capitalize on price increases.
- Bearish Trends: Recognizing downward trends to profit from falling prices.
Support and Resistance
- Support Levels: Price levels where a stock tends to find buying interest.
- Resistance Levels: Price points where selling pressure often occurs.
Key Components of Muehlberg’s Strategy
Technical Indicators
Moving Averages
- Simple Moving Average (SMA): Average price over a specified period, used to smooth out price data.
- Exponential Moving Average (EMA): Gives more weight to recent prices, making it more responsive to new information.
Relative Strength Index (RSI)
- Overbought and Oversold Conditions: Helps identify potential reversal points when the market is overbought or oversold.
Trend Lines
Drawing Trend Lines
- Connecting Highs and Lows: Draw lines connecting consecutive highs or lows to identify the direction of the trend.
- Channel Patterns: Creating channels by drawing parallel lines to the main trend line.
Volume Analysis
Volume Spikes
- Significance: High volume can indicate strong market interest and potential trend continuations or reversals.
- Volume Patterns: Analyzing volume patterns helps confirm price movements.
Implementing the Strategy
Setting Up Your Chart
Selecting Time Frames
- Intraday Charts: Using 1-minute, 5-minute, or 15-minute charts for day trading.
- Daily and Weekly Charts: For broader market context and trend analysis.
Applying Indicators
- Moving Averages: Adding SMA and EMA to identify trend directions.
- RSI: Implementing RSI to gauge market momentum.
Identifying Trade Opportunities
Trend Confirmation
- Trend Line Breaks: Entering trades when price breaks above or below a trend line.
- Moving Average Crossovers: Trading signals generated when shorter-term moving averages cross longer-term moving averages.
Support and Resistance Trades
- Buying at Support: Entering long positions at identified support levels.
- Selling at Resistance: Initiating short positions at resistance points.
Risk Management
Stop-Loss Orders
- Placement: Setting stop-loss orders below support levels for long positions and above resistance levels for short positions.
- Adjustments: Modifying stop-loss levels as the trade progresses to lock in profits.
Position Sizing
- Capital Allocation: Determining the appropriate amount of capital to risk on each trade based on account size and risk tolerance.
- Consistency: Maintaining consistent position sizes to manage risk effectively.
Case Studies
Example 1: Successful Breakout Trade
Scenario
- Setup: Stock breaks above a key resistance level with high volume.
- Execution: Trader enters a long position, setting a stop-loss just below the breakout level.
- Outcome: Stock continues to rise, resulting in a profitable trade.
Example 2: Trend Reversal
Scenario
- Setup: Stock shows bearish divergence on RSI while forming lower highs.
- Execution: Trader initiates a short position as the price breaks below the trend line.
- Outcome: Stock declines significantly, leading to a successful trade.
Advanced Techniques
Fibonacci Retracements
Application
- Drawing Retracements: Using Fibonacci levels to identify potential support and resistance levels during pullbacks.
- Trade Decisions: Entering trades at key Fibonacci levels for optimal entry points.
Candlestick Patterns
Popular Patterns
- Doji: Indicates potential reversal points.
- Engulfing Patterns: Strong reversal signals when a small candle is followed by a larger candle in the opposite direction.
Common Mistakes to Avoid
Overtrading
Definition
- Excessive Trading: Making too many trades can lead to high transaction costs and emotional exhaustion.
Prevention
- Discipline: Sticking to a well-defined trading plan and avoiding impulsive trades.
Ignoring Volume
Importance
- Volume Confirmation: Always consider volume as a confirmation tool for price movements.
Integration
- Volume Indicators: Using volume indicators alongside price charts to validate trades.
Conclusion
Day trading with lines in the sky, as outlined by R.L. Muehlberg, offers a structured approach to navigating the stock market’s complexities. By integrating technical indicators, trend lines, and volume analysis, traders can make informed decisions and manage risks effectively. Continuous learning and practice are key to mastering this strategy and achieving consistent trading success.
Frequently Asked Questions:
- Business Model Innovation:
Embrace our legitimate business model! We organize group buys, allowing participants to share costs for popular courses, making them accessible to those with limited financial resources. Our approach ensures affordability and accessibility, despite author concerns. - The Legal Environment:
The legality of our activity is uncertain. While we lack specific permission from course authors, there’s a technicality: authors didn’t impose resale limits upon course purchase. This presents both an opportunity for us and a benefit for individuals seeking low-cost access. - Quality Control:
Unveiling the Truth
Quality is paramount. Purchasing courses directly from sales pages ensures consistency with traditionally obtained materials. However, we’re not official course providers and don’t offer premium services:
- No scheduled coaching calls or sessions with the author.
- No access to the author’s private Facebook group or web portal.
- No entry to the author’s private membership forum.
- Direct email support from the author or their team is unavailable.Operating independently, we aim to bridge the pricing gap without additional services provided by official channels. Your understanding of our unique approach is valued.
Be the first to review “Day Trading with Lines in the Sky By R.L.Muehlberg”
You must be logged in to post a review.
Related products
Original price was: $4,995.00.$15.00Current price is: $15.00.
Forex Trading
Original price was: $239.00.$8.00Current price is: $8.00.
Original price was: $1,800.00.$54.00Current price is: $54.00.
Original price was: $299.00.$8.00Current price is: $8.00.
Original price was: $1,200.00.$23.00Current price is: $23.00.
Original price was: $997.00.$13.00Current price is: $13.00.
Original price was: $997.00.$8.00Current price is: $8.00.
Original price was: $695.00.$41.00Current price is: $41.00.
Forex Trading
Original price was: $125.00.$17.00Current price is: $17.00.
Original price was: $197.00.$5.00Current price is: $5.00.
Original price was: $450.00.$23.00Current price is: $23.00.
Original price was: $310.00.$23.00Current price is: $23.00.
Forex Trading
Original price was: $697.00.$5.00Current price is: $5.00.
Original price was: $700.00.$39.00Current price is: $39.00.
Forex Trading
Original price was: $1,898.00.$10.00Current price is: $10.00.
Original price was: $895.00.$15.00Current price is: $15.00.
Forex Trading
Original price was: $500.00.$5.00Current price is: $5.00.
Forex Trading
Original price was: $850.00.$23.00Current price is: $23.00.
Original price was: $799.00.$15.00Current price is: $15.00.
Original price was: $1,849.00.$15.00Current price is: $15.00.
Reviews
There are no reviews yet.