-
×
 Butterfly and Condor Workshop with Aeromir
1 × $15.00
Butterfly and Condor Workshop with Aeromir
1 × $15.00 -
×
 White Phoenix’s The Smart (Money) Approach to Trading with Jayson Casper
1 × $39.00
White Phoenix’s The Smart (Money) Approach to Trading with Jayson Casper
1 × $39.00 -
×
 The Orderflow Masterclass with PrimeTrading
1 × $17.00
The Orderflow Masterclass with PrimeTrading
1 × $17.00 -
×
 Options Trading & Ultimate MasterClass With Tyrone Abela - FX Evolution
1 × $54.00
Options Trading & Ultimate MasterClass With Tyrone Abela - FX Evolution
1 × $54.00 -
×
 Home Run Options Trading Course with Dave Aquino - Base Camp Trading
1 × $11.00
Home Run Options Trading Course with Dave Aquino - Base Camp Trading
1 × $11.00 -
×
 Algo Trading Masterclass with Ali Casey - StatOasis
1 × $23.00
Algo Trading Masterclass with Ali Casey - StatOasis
1 × $23.00 -
×
 Best of the Best: Collars with Amy Meissner & Scott Ruble
1 × $15.00
Best of the Best: Collars with Amy Meissner & Scott Ruble
1 × $15.00 -
×
 Shawn Sharma Mentorship Program
1 × $34.00
Shawn Sharma Mentorship Program
1 × $34.00 -
×
 AI For Traders with Trading Markets
1 × $31.00
AI For Traders with Trading Markets
1 × $31.00 -
×
 0 DTE Options Trading Workshop with Aeromir Corporation
1 × $15.00
0 DTE Options Trading Workshop with Aeromir Corporation
1 × $15.00 -
×
 Order flow self-study training program with iMFtracker
1 × $10.00
Order flow self-study training program with iMFtracker
1 × $10.00 -
×
 Compass Trading System with Right Line Trading
1 × $39.00
Compass Trading System with Right Line Trading
1 × $39.00 -
×
 The Best Option Trading Course with David Jaffee - Best Stock Strategy
1 × $15.00
The Best Option Trading Course with David Jaffee - Best Stock Strategy
1 × $15.00 -
×
 Frank Paul – Fibonacci Swing Trader Foundation Course 2011 (Video, Manuals, 5.1 GB) with Forexmentor
1 × $6.00
Frank Paul – Fibonacci Swing Trader Foundation Course 2011 (Video, Manuals, 5.1 GB) with Forexmentor
1 × $6.00 -
×
 Zeus Capital (ZCFX) Full Mentorship Course
1 × $13.00
Zeus Capital (ZCFX) Full Mentorship Course
1 × $13.00 -
×
 Hiden Collective Factors in Speculative Trading with Bertrand Roehner
1 × $6.00
Hiden Collective Factors in Speculative Trading with Bertrand Roehner
1 × $6.00 -
×
 Online Course: Forex Trading By Fxtc.co
1 × $5.00
Online Course: Forex Trading By Fxtc.co
1 × $5.00 -
×
 Evolve MasterClass with Irek Piekarski
1 × $13.00
Evolve MasterClass with Irek Piekarski
1 × $13.00 -
×
 Forex Fortune Factory with Nehemiah Douglass & Cottrell Phillip
1 × $5.00
Forex Fortune Factory with Nehemiah Douglass & Cottrell Phillip
1 × $5.00 -
×
 The Prop Trading Code with Brannigan Barrett - Axia Futures
1 × $23.00
The Prop Trading Code with Brannigan Barrett - Axia Futures
1 × $23.00 -
×
 Annual Forecast Reports - Forecast 2023 with Larry Williams
1 × $8.00
Annual Forecast Reports - Forecast 2023 with Larry Williams
1 × $8.00 -
×
 Ichimoku Cloud Trading Course with FollowMeTrades
1 × $15.00
Ichimoku Cloud Trading Course with FollowMeTrades
1 × $15.00 -
×
 FX Capital Online
1 × $5.00
FX Capital Online
1 × $5.00 -
×
 Modeling Financial Markets. Using Visual Basic Net & Databases To Create Pricing Trading & Risk Management Models
1 × $6.00
Modeling Financial Markets. Using Visual Basic Net & Databases To Create Pricing Trading & Risk Management Models
1 × $6.00 -
×
 Onyx Platinum Trading Accelerator 2.0 with Nick Deflorio
1 × $6.00
Onyx Platinum Trading Accelerator 2.0 with Nick Deflorio
1 × $6.00 -
×
 Stock Patterns for DayTrading I & II with Barry Rudd
1 × $6.00
Stock Patterns for DayTrading I & II with Barry Rudd
1 × $6.00 -
×
 FX Video Course with Geri Trader
1 × $5.00
FX Video Course with Geri Trader
1 × $5.00 -
×
 Forex Eye
1 × $5.00
Forex Eye
1 × $5.00 -
×
 Fundamentals of the Stock Market with B.O’Neill Wyss
1 × $6.00
Fundamentals of the Stock Market with B.O’Neill Wyss
1 × $6.00 -
×
 Read The Market RTM Master Trader Course + Journals
1 × $5.00
Read The Market RTM Master Trader Course + Journals
1 × $5.00 -
×
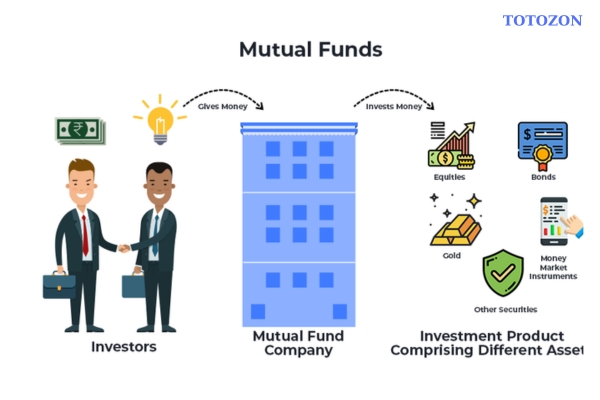 Mutual Funds: Fifty Years of Research Findings by Seth C. Anderson
1 × $6.00
Mutual Funds: Fifty Years of Research Findings by Seth C. Anderson
1 × $6.00 -
×
 The Investor Accelerator Premium Membership
1 × $34.00
The Investor Accelerator Premium Membership
1 × $34.00 -
×
 FX Cartel Online Course
1 × $31.00
FX Cartel Online Course
1 × $31.00 -
×
 Harmonic Elliott Wave: The Case for Modification of R. N. Elliott's Impulsive Wave Structure with Ian Copsey
1 × $6.00
Harmonic Elliott Wave: The Case for Modification of R. N. Elliott's Impulsive Wave Structure with Ian Copsey
1 × $6.00 -
×
 Random Walk Trading - J.L.Lord - One Strategy for All Markets
1 × $6.00
Random Walk Trading - J.L.Lord - One Strategy for All Markets
1 × $6.00 -
×
 Pentagonal Time Cycle Theory
1 × $6.00
Pentagonal Time Cycle Theory
1 × $6.00 -
×
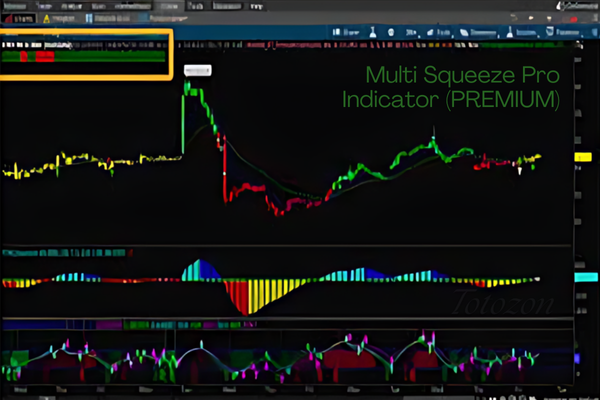 Multi Squeeze Pro Indicator (PREMIUM)
1 × $69.00
Multi Squeeze Pro Indicator (PREMIUM)
1 × $69.00 -
×
 High Probability Trading Using Elliott Wave And Fibonacci Analysis withVic Patel - Forex Training Group
1 × $10.00
High Probability Trading Using Elliott Wave And Fibonacci Analysis withVic Patel - Forex Training Group
1 × $10.00 -
×
 Mindset Trader Day Trading Course with Mafia Trading
1 × $6.00
Mindset Trader Day Trading Course with Mafia Trading
1 × $6.00 -
×
 Master Bundle with Gemify Academy
1 × $5.00
Master Bundle with Gemify Academy
1 × $5.00 -
×
 Fx Engine Trading Course with Adeh Mirzakhani
1 × $6.00
Fx Engine Trading Course with Adeh Mirzakhani
1 × $6.00 -
×
 The Market Masters: Wall Street's Top Investment Pros Reveal How to Make Money in Both Bull and Bear Markets - Kirk Kazanjian
1 × $6.00
The Market Masters: Wall Street's Top Investment Pros Reveal How to Make Money in Both Bull and Bear Markets - Kirk Kazanjian
1 × $6.00 -
×
 Naked Forex: High-Probability Techniques for Trading Without Indicators (2012) with Alex Nekritin & Walter Peters
1 × $6.00
Naked Forex: High-Probability Techniques for Trading Without Indicators (2012) with Alex Nekritin & Walter Peters
1 × $6.00 -
×
 Guide To Selling High Probability Spreads Class with Don Kaufman
1 × $6.00
Guide To Selling High Probability Spreads Class with Don Kaufman
1 × $6.00 -
×
 Indicator Companion for Metastock with Martin Pring
1 × $6.00
Indicator Companion for Metastock with Martin Pring
1 × $6.00 -
×
 Measuring Market Risk (2nd Edition) with Kevin Dowd
1 × $6.00
Measuring Market Risk (2nd Edition) with Kevin Dowd
1 × $6.00 -
×
 Optimize Funding Program 2023 with Solo Network Courses
1 × $13.00
Optimize Funding Program 2023 with Solo Network Courses
1 × $13.00 -
×
 ICT Charter 2020 with Inner Circle Trader
1 × $13.00
ICT Charter 2020 with Inner Circle Trader
1 × $13.00 -
×
 Harmonic Pattern Detection Indicator
1 × $6.00
Harmonic Pattern Detection Indicator
1 × $6.00 -
×
 Mentfx Paid Mentoship (2021)
1 × $5.00
Mentfx Paid Mentoship (2021)
1 × $5.00 -
×
 Hedge Fund Alpha with John Longo - World Scientific
1 × $6.00
Hedge Fund Alpha with John Longo - World Scientific
1 × $6.00 -
×
 The Naked Eye: Raw Data Analytics with Edgar Torres - Raw Data Analytics
1 × $8.00
The Naked Eye: Raw Data Analytics with Edgar Torres - Raw Data Analytics
1 × $8.00 -
×
 Breakout Trading Systems with Chris Tate
1 × $6.00
Breakout Trading Systems with Chris Tate
1 × $6.00 -
×
 Earnings Power Play with Dave Aquino
1 × $15.00
Earnings Power Play with Dave Aquino
1 × $15.00 -
×
 Momentum Signals Training Course with Fulcum Trader
1 × $5.00
Momentum Signals Training Course with Fulcum Trader
1 × $5.00 -
×
 TRADING NFX Course with Andrew NFX
1 × $5.00
TRADING NFX Course with Andrew NFX
1 × $5.00 -
×
 The Noise Trader Approach to Finance (Article) with Andrei Schleifer, Laurence H.Summers
1 × $6.00
The Noise Trader Approach to Finance (Article) with Andrei Schleifer, Laurence H.Summers
1 × $6.00 -
×
 Quantamentals - The Next Great Forefront Of Trading and Investing with Trading Markets
1 × $8.00
Quantamentals - The Next Great Forefront Of Trading and Investing with Trading Markets
1 × $8.00 -
×
 Ultimate Trading Course with Dodgy's Dungeon
1 × $8.00
Ultimate Trading Course with Dodgy's Dungeon
1 × $8.00 -
×
 $20 – 52k 20 pips a day challange with Rafał Zuchowicz - TopMasterTrader
1 × $5.00
$20 – 52k 20 pips a day challange with Rafał Zuchowicz - TopMasterTrader
1 × $5.00 -
×
 NYC REPLAYS 2018
1 × $6.00
NYC REPLAYS 2018
1 × $6.00 -
×
 Elliott Wave Educational Video Series (10 dvds, video)
1 × $6.00
Elliott Wave Educational Video Series (10 dvds, video)
1 × $6.00 -
×
 Trading Short TermSame Day Trades Sep 2023 with Dan Sheridan & Mark Fenton - Sheridan Options Mentoring
1 × $31.00
Trading Short TermSame Day Trades Sep 2023 with Dan Sheridan & Mark Fenton - Sheridan Options Mentoring
1 × $31.00 -
×
 Crystal Ball Pack PLUS bonus Live Trade By Pat Mitchell - Trick Trades
1 × $20.00
Crystal Ball Pack PLUS bonus Live Trade By Pat Mitchell - Trick Trades
1 × $20.00 -
×
 The Complete Guide to Multiple Time Frame Analysis & Reading Price Action with Aiman Almansoori
1 × $13.00
The Complete Guide to Multiple Time Frame Analysis & Reading Price Action with Aiman Almansoori
1 × $13.00 -
×
 Rapid Results Method with Russ Horn
1 × $6.00
Rapid Results Method with Russ Horn
1 × $6.00 -
×
 How To Read The Market Professionally with TradeSmart
1 × $27.00
How To Read The Market Professionally with TradeSmart
1 × $27.00 -
×
 Advanced Spread Trading with Guy Bower - MasterClass Trader
1 × $15.00
Advanced Spread Trading with Guy Bower - MasterClass Trader
1 × $15.00 -
×
 Seasonal Stock Market Trends: The Definitive Guide to Calendar‐Based Stock Market Trading with Jay Kaeppel
1 × $6.00
Seasonal Stock Market Trends: The Definitive Guide to Calendar‐Based Stock Market Trading with Jay Kaeppel
1 × $6.00 -
×
 MACD Divergence Fully Automatic Indicator for ThinkOrSwim TOS
1 × $6.00
MACD Divergence Fully Automatic Indicator for ThinkOrSwim TOS
1 × $6.00 -
×
 ICT Prodigy Trading Course – $650K in Payouts with Alex Solignani
1 × $15.00
ICT Prodigy Trading Course – $650K in Payouts with Alex Solignani
1 × $15.00 -
×
 Frank Kern Courses Collection (23+ Courses)
1 × $20.00
Frank Kern Courses Collection (23+ Courses)
1 × $20.00

Day Trading with Lines in the Sky By R.L.Muehlberg
$6.00
File Size: 19.8 MB
Delivery Time: 1–12 hours
Media Type: Online Course
You may check content of “DayTrading with Lines in the Sky By R.L.Muehlberg” below:
Introduction
Day trading is an exhilarating and potentially profitable endeavor that attracts many traders worldwide. “Day Trading with Lines in the Sky” by R.L. Muehlberg offers a unique approach to this trading style, focusing on specific technical analysis techniques that use “lines in the sky” to predict market movements. In this article, we will delve into the core concepts of Muehlberg’s strategy, exploring how these lines can help traders make informed decisions.
Understanding Lines in the Sky
What Are Lines in the Sky?
Definition
- Technical Lines: Lines in the sky refer to specific technical indicators and trend lines drawn on stock charts to predict future price movements.
- Purpose: These lines help traders identify support and resistance levels, trend directions, and potential reversal points.
Importance of Lines in Trading
Trend Identification
- Bullish Trends: Identifying upward trends to capitalize on price increases.
- Bearish Trends: Recognizing downward trends to profit from falling prices.
Support and Resistance
- Support Levels: Price levels where a stock tends to find buying interest.
- Resistance Levels: Price points where selling pressure often occurs.
Key Components of Muehlberg’s Strategy
Technical Indicators
Moving Averages
- Simple Moving Average (SMA): Average price over a specified period, used to smooth out price data.
- Exponential Moving Average (EMA): Gives more weight to recent prices, making it more responsive to new information.
Relative Strength Index (RSI)
- Overbought and Oversold Conditions: Helps identify potential reversal points when the market is overbought or oversold.
Trend Lines
Drawing Trend Lines
- Connecting Highs and Lows: Draw lines connecting consecutive highs or lows to identify the direction of the trend.
- Channel Patterns: Creating channels by drawing parallel lines to the main trend line.
Volume Analysis
Volume Spikes
- Significance: High volume can indicate strong market interest and potential trend continuations or reversals.
- Volume Patterns: Analyzing volume patterns helps confirm price movements.
Implementing the Strategy
Setting Up Your Chart
Selecting Time Frames
- Intraday Charts: Using 1-minute, 5-minute, or 15-minute charts for day trading.
- Daily and Weekly Charts: For broader market context and trend analysis.
Applying Indicators
- Moving Averages: Adding SMA and EMA to identify trend directions.
- RSI: Implementing RSI to gauge market momentum.
Identifying Trade Opportunities
Trend Confirmation
- Trend Line Breaks: Entering trades when price breaks above or below a trend line.
- Moving Average Crossovers: Trading signals generated when shorter-term moving averages cross longer-term moving averages.
Support and Resistance Trades
- Buying at Support: Entering long positions at identified support levels.
- Selling at Resistance: Initiating short positions at resistance points.
Risk Management
Stop-Loss Orders
- Placement: Setting stop-loss orders below support levels for long positions and above resistance levels for short positions.
- Adjustments: Modifying stop-loss levels as the trade progresses to lock in profits.
Position Sizing
- Capital Allocation: Determining the appropriate amount of capital to risk on each trade based on account size and risk tolerance.
- Consistency: Maintaining consistent position sizes to manage risk effectively.
Case Studies
Example 1: Successful Breakout Trade
Scenario
- Setup: Stock breaks above a key resistance level with high volume.
- Execution: Trader enters a long position, setting a stop-loss just below the breakout level.
- Outcome: Stock continues to rise, resulting in a profitable trade.
Example 2: Trend Reversal
Scenario
- Setup: Stock shows bearish divergence on RSI while forming lower highs.
- Execution: Trader initiates a short position as the price breaks below the trend line.
- Outcome: Stock declines significantly, leading to a successful trade.
Advanced Techniques
Fibonacci Retracements
Application
- Drawing Retracements: Using Fibonacci levels to identify potential support and resistance levels during pullbacks.
- Trade Decisions: Entering trades at key Fibonacci levels for optimal entry points.
Candlestick Patterns
Popular Patterns
- Doji: Indicates potential reversal points.
- Engulfing Patterns: Strong reversal signals when a small candle is followed by a larger candle in the opposite direction.
Common Mistakes to Avoid
Overtrading
Definition
- Excessive Trading: Making too many trades can lead to high transaction costs and emotional exhaustion.
Prevention
- Discipline: Sticking to a well-defined trading plan and avoiding impulsive trades.
Ignoring Volume
Importance
- Volume Confirmation: Always consider volume as a confirmation tool for price movements.
Integration
- Volume Indicators: Using volume indicators alongside price charts to validate trades.
Conclusion
Day trading with lines in the sky, as outlined by R.L. Muehlberg, offers a structured approach to navigating the stock market’s complexities. By integrating technical indicators, trend lines, and volume analysis, traders can make informed decisions and manage risks effectively. Continuous learning and practice are key to mastering this strategy and achieving consistent trading success.
Frequently Asked Questions:
- Business Model Innovation:
Embrace our legitimate business model! We organize group buys, allowing participants to share costs for popular courses, making them accessible to those with limited financial resources. Our approach ensures affordability and accessibility, despite author concerns. - The Legal Environment:
The legality of our activity is uncertain. While we lack specific permission from course authors, there’s a technicality: authors didn’t impose resale limits upon course purchase. This presents both an opportunity for us and a benefit for individuals seeking low-cost access. - Quality Control:
Unveiling the Truth
Quality is paramount. Purchasing courses directly from sales pages ensures consistency with traditionally obtained materials. However, we’re not official course providers and don’t offer premium services:
- No scheduled coaching calls or sessions with the author.
- No access to the author’s private Facebook group or web portal.
- No entry to the author’s private membership forum.
- Direct email support from the author or their team is unavailable.Operating independently, we aim to bridge the pricing gap without additional services provided by official channels. Your understanding of our unique approach is valued.
Be the first to review “Day Trading with Lines in the Sky By R.L.Muehlberg”
You must be logged in to post a review.
Related products
Original price was: $2,120.00.$15.00Current price is: $15.00.
Forex Trading
The Complete Guide to Multiple Time Frame Analysis & Reading Price Action with Aiman Almansoori
Original price was: $1,399.00.$13.00Current price is: $13.00.
Forex Trading
Original price was: $500.00.$5.00Current price is: $5.00.

Original price was: $450.00.$23.00Current price is: $23.00.

Original price was: $310.00.$23.00Current price is: $23.00.
Original price was: $799.00.$15.00Current price is: $15.00.

Forex Trading
Original price was: $499.00.$15.00Current price is: $15.00.

Forex Trading
Original price was: $249.00.$15.00Current price is: $15.00.
Forex Trading
Original price was: $2,995.00.$31.00Current price is: $31.00.
Forex Trading
Original price was: $125.00.$17.00Current price is: $17.00.
Original price was: $1,200.00.$23.00Current price is: $23.00.
Forex Trading
Original price was: $239.00.$8.00Current price is: $8.00.
Forex Trading
Original price was: $797.00.$10.00Current price is: $10.00.
Original price was: $497.00.$11.00Current price is: $11.00.

Forex Trading
Original price was: $550.00.$5.00Current price is: $5.00.
Forex Trading
Original price was: $999.00.$15.00Current price is: $15.00.

Forex Trading
Original price was: $850.00.$23.00Current price is: $23.00.

Original price was: $139.00.$23.00Current price is: $23.00.
Original price was: $997.00.$8.00Current price is: $8.00.

Forex Trading
Original price was: $697.00.$5.00Current price is: $5.00.
Reviews
There are no reviews yet.