-
×
 Momentum Scalping for Profits with Shay Horowitz
1 × $6.00
Momentum Scalping for Profits with Shay Horowitz
1 × $6.00 -
×
 Learn Investing & Trading with Danny Devan
1 × $23.00
Learn Investing & Trading with Danny Devan
1 × $23.00 -
×
 The Best Mechanical DayTrading System I Know with Bruce Babcock
1 × $6.00
The Best Mechanical DayTrading System I Know with Bruce Babcock
1 × $6.00 -
×
 Weekly Credit Spreads for Income
1 × $6.00
Weekly Credit Spreads for Income
1 × $6.00 -
×
 Backspreads, Diagonals and Butterflies – Advanced Options Strategies
1 × $6.00
Backspreads, Diagonals and Butterflies – Advanced Options Strategies
1 × $6.00 -
×
 Tradematic Trading Strategy
1 × $31.00
Tradematic Trading Strategy
1 × $31.00 -
×
 Mining for Golden Trading Opportunities with Jake Bernstein
1 × $8.00
Mining for Golden Trading Opportunities with Jake Bernstein
1 × $8.00 -
×
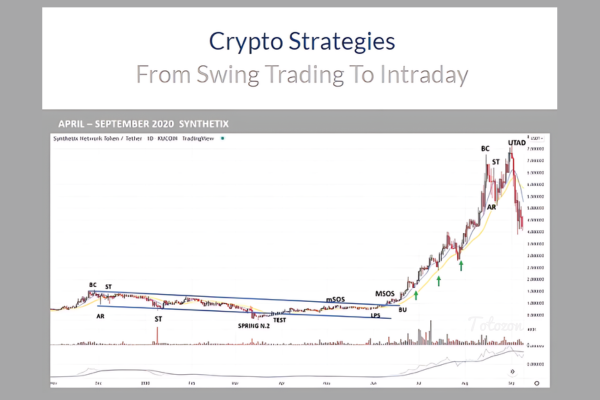 Crypto Strategies From Swing Trading To Intraday with Alessio Rutigliano & Roman Bogomazov
1 × $17.00
Crypto Strategies From Swing Trading To Intraday with Alessio Rutigliano & Roman Bogomazov
1 × $17.00 -
×
 Broker Robbery University Course with Billi Richy FX
1 × $5.00
Broker Robbery University Course with Billi Richy FX
1 × $5.00 -
×
 How To Read The Market Professionally with TradeSmart
1 × $27.00
How To Read The Market Professionally with TradeSmart
1 × $27.00 -
×
 Evolution Forex Trading
1 × $31.00
Evolution Forex Trading
1 × $31.00 -
×
 The Naked Eye: Raw Data Analytics with Edgar Torres - Raw Data Analytics
1 × $8.00
The Naked Eye: Raw Data Analytics with Edgar Torres - Raw Data Analytics
1 × $8.00 -
×
 Beginner to Advanced Trader with Mikesh Shah
1 × $6.00
Beginner to Advanced Trader with Mikesh Shah
1 × $6.00 -
×
 The Ultimate Step By Step Guide to Online Currency Trading with Cynthia Marcy, Erol Bortucene
1 × $6.00
The Ultimate Step By Step Guide to Online Currency Trading with Cynthia Marcy, Erol Bortucene
1 × $6.00 -
×
 The Key to Speculation for Greyhound Dog Racing with Jack Gillen
1 × $4.00
The Key to Speculation for Greyhound Dog Racing with Jack Gillen
1 × $4.00 -
×
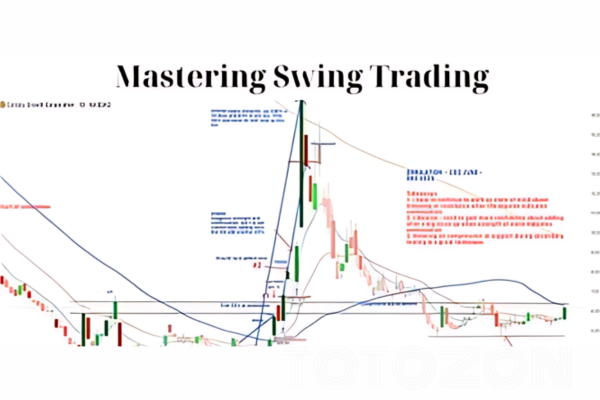 MASTERING SWING TRADING May 2024 with Roman Bogomazov
1 × $194.00
MASTERING SWING TRADING May 2024 with Roman Bogomazov
1 × $194.00 -
×
 Sure-thing Options Trading: A Money-Making Guide to the New Listed Stock and Commodity Options Markets - George Angell
1 × $6.00
Sure-thing Options Trading: A Money-Making Guide to the New Listed Stock and Commodity Options Markets - George Angell
1 × $6.00 -
×
 The Stock Index Futures Market with B.Thomas Byme Jr.
1 × $6.00
The Stock Index Futures Market with B.Thomas Byme Jr.
1 × $6.00 -
×
 The New Multi-10x on Steroids Pro Package
1 × $78.00
The New Multi-10x on Steroids Pro Package
1 × $78.00 -
×
 Hot Commodities: How Anyone Can Invest Profitably in the World's Best Market with Jim Rogers
1 × $6.00
Hot Commodities: How Anyone Can Invest Profitably in the World's Best Market with Jim Rogers
1 × $6.00 -
×
 ATM Forex 2009 System Manual, Videos & Indicators with Keith Cotterill
1 × $6.00
ATM Forex 2009 System Manual, Videos & Indicators with Keith Cotterill
1 × $6.00 -
×
 Online Course - Why Wave Analysis Belongs in Every Trader's Toolbox with Jeffrey Kennedy - Elliott Wave
1 × $15.00
Online Course - Why Wave Analysis Belongs in Every Trader's Toolbox with Jeffrey Kennedy - Elliott Wave
1 × $15.00 -
×
 Complete Portfolio and Stock Comparison Spreadsheet with Joseph Hogue
1 × $6.00
Complete Portfolio and Stock Comparison Spreadsheet with Joseph Hogue
1 × $6.00 -
×
 Forex Courses Collection
1 × $55.00
Forex Courses Collection
1 × $55.00 -
×
 Darvas Trading WorkBook
1 × $6.00
Darvas Trading WorkBook
1 × $6.00 -
×
 Cheat Code Trading System
1 × $13.00
Cheat Code Trading System
1 × $13.00 -
×
 BTC Market Profile
1 × $34.00
BTC Market Profile
1 × $34.00 -
×
 Self-Paced Course – Advanced Financial Statements Analysis 2024
1 × $27.00
Self-Paced Course – Advanced Financial Statements Analysis 2024
1 × $27.00 -
×
 Secrets of a Pivot Boss. Revealing Proven Methods for Profiting in The Market with Franklin Ochoa
1 × $6.00
Secrets of a Pivot Boss. Revealing Proven Methods for Profiting in The Market with Franklin Ochoa
1 × $6.00 -
×
 Tradingconceptsinc - Calendar Spreads
1 × $23.00
Tradingconceptsinc - Calendar Spreads
1 × $23.00 -
×
 Portfolio Investing with Ron Bertino
1 × $54.00
Portfolio Investing with Ron Bertino
1 × $54.00 -
×
 High Powered Investing with Amine Bouchentouf
1 × $6.00
High Powered Investing with Amine Bouchentouf
1 × $6.00 -
×
 August Forex Golem V3
1 × $6.00
August Forex Golem V3
1 × $6.00 -
×
 The Fx220 1 on 1 Mentoring Program
1 × $5.00
The Fx220 1 on 1 Mentoring Program
1 × $5.00 -
×
 Gaining Option Leverage: Using Market Makers Tactics with Jon Najarian
1 × $4.00
Gaining Option Leverage: Using Market Makers Tactics with Jon Najarian
1 × $4.00 -
×
 Create Your Trade Plan with Yuri Shramenko
1 × $6.00
Create Your Trade Plan with Yuri Shramenko
1 × $6.00 -
×
 Options Master Class
1 × $54.00
Options Master Class
1 × $54.00 -
×
 Stop Being the Stock Market Plankton with Idan Gabrieli
1 × $6.00
Stop Being the Stock Market Plankton with Idan Gabrieli
1 × $6.00 -
×
 Compass Trading System with Right Line Trading
1 × $39.00
Compass Trading System with Right Line Trading
1 × $39.00

Day Trading with Lines in the Sky By R.L.Muehlberg
$6.00
File Size: 19.8 MB
Delivery Time: 1–12 hours
Media Type: Online Course
You may check content of “DayTrading with Lines in the Sky By R.L.Muehlberg” below:
Introduction
Day trading is an exhilarating and potentially profitable endeavor that attracts many traders worldwide. “Day Trading with Lines in the Sky” by R.L. Muehlberg offers a unique approach to this trading style, focusing on specific technical analysis techniques that use “lines in the sky” to predict market movements. In this article, we will delve into the core concepts of Muehlberg’s strategy, exploring how these lines can help traders make informed decisions.
Understanding Lines in the Sky
What Are Lines in the Sky?
Definition
- Technical Lines: Lines in the sky refer to specific technical indicators and trend lines drawn on stock charts to predict future price movements.
- Purpose: These lines help traders identify support and resistance levels, trend directions, and potential reversal points.
Importance of Lines in Trading
Trend Identification
- Bullish Trends: Identifying upward trends to capitalize on price increases.
- Bearish Trends: Recognizing downward trends to profit from falling prices.
Support and Resistance
- Support Levels: Price levels where a stock tends to find buying interest.
- Resistance Levels: Price points where selling pressure often occurs.
Key Components of Muehlberg’s Strategy
Technical Indicators
Moving Averages
- Simple Moving Average (SMA): Average price over a specified period, used to smooth out price data.
- Exponential Moving Average (EMA): Gives more weight to recent prices, making it more responsive to new information.
Relative Strength Index (RSI)
- Overbought and Oversold Conditions: Helps identify potential reversal points when the market is overbought or oversold.
Trend Lines
Drawing Trend Lines
- Connecting Highs and Lows: Draw lines connecting consecutive highs or lows to identify the direction of the trend.
- Channel Patterns: Creating channels by drawing parallel lines to the main trend line.
Volume Analysis
Volume Spikes
- Significance: High volume can indicate strong market interest and potential trend continuations or reversals.
- Volume Patterns: Analyzing volume patterns helps confirm price movements.
Implementing the Strategy
Setting Up Your Chart
Selecting Time Frames
- Intraday Charts: Using 1-minute, 5-minute, or 15-minute charts for day trading.
- Daily and Weekly Charts: For broader market context and trend analysis.
Applying Indicators
- Moving Averages: Adding SMA and EMA to identify trend directions.
- RSI: Implementing RSI to gauge market momentum.
Identifying Trade Opportunities
Trend Confirmation
- Trend Line Breaks: Entering trades when price breaks above or below a trend line.
- Moving Average Crossovers: Trading signals generated when shorter-term moving averages cross longer-term moving averages.
Support and Resistance Trades
- Buying at Support: Entering long positions at identified support levels.
- Selling at Resistance: Initiating short positions at resistance points.
Risk Management
Stop-Loss Orders
- Placement: Setting stop-loss orders below support levels for long positions and above resistance levels for short positions.
- Adjustments: Modifying stop-loss levels as the trade progresses to lock in profits.
Position Sizing
- Capital Allocation: Determining the appropriate amount of capital to risk on each trade based on account size and risk tolerance.
- Consistency: Maintaining consistent position sizes to manage risk effectively.
Case Studies
Example 1: Successful Breakout Trade
Scenario
- Setup: Stock breaks above a key resistance level with high volume.
- Execution: Trader enters a long position, setting a stop-loss just below the breakout level.
- Outcome: Stock continues to rise, resulting in a profitable trade.
Example 2: Trend Reversal
Scenario
- Setup: Stock shows bearish divergence on RSI while forming lower highs.
- Execution: Trader initiates a short position as the price breaks below the trend line.
- Outcome: Stock declines significantly, leading to a successful trade.
Advanced Techniques
Fibonacci Retracements
Application
- Drawing Retracements: Using Fibonacci levels to identify potential support and resistance levels during pullbacks.
- Trade Decisions: Entering trades at key Fibonacci levels for optimal entry points.
Candlestick Patterns
Popular Patterns
- Doji: Indicates potential reversal points.
- Engulfing Patterns: Strong reversal signals when a small candle is followed by a larger candle in the opposite direction.
Common Mistakes to Avoid
Overtrading
Definition
- Excessive Trading: Making too many trades can lead to high transaction costs and emotional exhaustion.
Prevention
- Discipline: Sticking to a well-defined trading plan and avoiding impulsive trades.
Ignoring Volume
Importance
- Volume Confirmation: Always consider volume as a confirmation tool for price movements.
Integration
- Volume Indicators: Using volume indicators alongside price charts to validate trades.
Conclusion
Day trading with lines in the sky, as outlined by R.L. Muehlberg, offers a structured approach to navigating the stock market’s complexities. By integrating technical indicators, trend lines, and volume analysis, traders can make informed decisions and manage risks effectively. Continuous learning and practice are key to mastering this strategy and achieving consistent trading success.
Frequently Asked Questions:
- Business Model Innovation:
Embrace our legitimate business model! We organize group buys, allowing participants to share costs for popular courses, making them accessible to those with limited financial resources. Our approach ensures affordability and accessibility, despite author concerns. - The Legal Environment:
The legality of our activity is uncertain. While we lack specific permission from course authors, there’s a technicality: authors didn’t impose resale limits upon course purchase. This presents both an opportunity for us and a benefit for individuals seeking low-cost access. - Quality Control:
Unveiling the Truth
Quality is paramount. Purchasing courses directly from sales pages ensures consistency with traditionally obtained materials. However, we’re not official course providers and don’t offer premium services:
- No scheduled coaching calls or sessions with the author.
- No access to the author’s private Facebook group or web portal.
- No entry to the author’s private membership forum.
- Direct email support from the author or their team is unavailable.Operating independently, we aim to bridge the pricing gap without additional services provided by official channels. Your understanding of our unique approach is valued.
Be the first to review “Day Trading with Lines in the Sky By R.L.Muehlberg”
You must be logged in to post a review.
Related products
Forex Trading
Original price was: $1,098.00.$39.00Current price is: $39.00.

Forex Trading
Original price was: $2,997.00.$23.00Current price is: $23.00.

Original price was: $895.00.$15.00Current price is: $15.00.

Original price was: $310.00.$23.00Current price is: $23.00.

Original price was: $997.00.$13.00Current price is: $13.00.

Original price was: $4,995.00.$15.00Current price is: $15.00.

Original price was: $1,200.00.$23.00Current price is: $23.00.

Original price was: $695.00.$41.00Current price is: $41.00.

Original price was: $497.00.$11.00Current price is: $11.00.

Forex Trading
Original price was: $397.00.$31.00Current price is: $31.00.
Forex Trading
Original price was: $4,997.00.$27.00Current price is: $27.00.

Original price was: $450.00.$23.00Current price is: $23.00.

Forex Trading
Original price was: $500.00.$5.00Current price is: $5.00.

Forex Trading
Original price was: $125.00.$17.00Current price is: $17.00.

Forex Trading
Original price was: $2,995.00.$31.00Current price is: $31.00.

Original price was: $999.00.$5.00Current price is: $5.00.

Original price was: $1,800.00.$54.00Current price is: $54.00.

Forex Trading
Original price was: $550.00.$5.00Current price is: $5.00.

Original price was: $139.00.$23.00Current price is: $23.00.

Original price was: $299.00.$8.00Current price is: $8.00.
Reviews
There are no reviews yet.