-
×
 Ultimate Options Trading with Cash Flow Academy
1 × $34.00
Ultimate Options Trading with Cash Flow Academy
1 × $34.00 -
×
 The Orderflows Trade Opportunities Encyclopedia with Michael Valtos
1 × $8.00
The Orderflows Trade Opportunities Encyclopedia with Michael Valtos
1 × $8.00 -
×
 The Expected Return Calculator
1 × $23.00
The Expected Return Calculator
1 × $23.00 -
×
 Vantagepointtrading - Stock Market Swing Trading Video Course
1 × $15.00
Vantagepointtrading - Stock Market Swing Trading Video Course
1 × $15.00 -
×
 The Orderflow Masterclass with PrimeTrading
1 × $17.00
The Orderflow Masterclass with PrimeTrading
1 × $17.00 -
×
 Kash-FX Elite Course
1 × $10.00
Kash-FX Elite Course
1 × $10.00 -
×
 Butterfly and Condor Workshop with Aeromir
1 × $15.00
Butterfly and Condor Workshop with Aeromir
1 × $15.00 -
×
 Momentum Signals Interactive Training Course 2010-2011
1 × $6.00
Momentum Signals Interactive Training Course 2010-2011
1 × $6.00 -
×
 0 DTE Options Trading Workshop with Aeromir Corporation
1 × $15.00
0 DTE Options Trading Workshop with Aeromir Corporation
1 × $15.00 -
×
 BuySide Global Professional (Jul 2018)
1 × $101.00
BuySide Global Professional (Jul 2018)
1 × $101.00 -
×
 Level 3 - AlgoX Trading Tactics
1 × $31.00
Level 3 - AlgoX Trading Tactics
1 × $31.00 -
×
 The Multi-Fractal Markets Educational Course with Dylan Forexia
1 × $39.00
The Multi-Fractal Markets Educational Course with Dylan Forexia
1 × $39.00 -
×
 Advanced Spread Trading with Guy Bower - MasterClass Trader
1 × $15.00
Advanced Spread Trading with Guy Bower - MasterClass Trader
1 × $15.00 -
×
 The Way of the Turtle with Curtis Faith
1 × $6.00
The Way of the Turtle with Curtis Faith
1 × $6.00 -
×
 Intermediate Stock Course
1 × $54.00
Intermediate Stock Course
1 × $54.00 -
×
 The Stock Market Course with George Fontanills & Tom Gentile
1 × $6.00
The Stock Market Course with George Fontanills & Tom Gentile
1 × $6.00 -
×
 W. D Gann 's Square Of 9 Applied To Modern Markets with Sean Avidar - Hexatrade350
1 × $23.00
W. D Gann 's Square Of 9 Applied To Modern Markets with Sean Avidar - Hexatrade350
1 × $23.00 -
×
 The Stock Index Futures Market with B.Thomas Byme Jr.
1 × $6.00
The Stock Index Futures Market with B.Thomas Byme Jr.
1 × $6.00 -
×
 The SPX 35-40 Day Delta Neutral Unbalanced Butterfly with Sheridan Options Mentoring
1 × $15.00
The SPX 35-40 Day Delta Neutral Unbalanced Butterfly with Sheridan Options Mentoring
1 × $15.00 -
×
 TRADING NFX Course with Andrew NFX
1 × $5.00
TRADING NFX Course with Andrew NFX
1 × $5.00 -
×
 The WWA Core Concepts Bootcamp
1 × $6.00
The WWA Core Concepts Bootcamp
1 × $6.00 -
×
 Uncertainty & Expectation Strategies for the Trading of Risk with Gerald Ashley
1 × $6.00
Uncertainty & Expectation Strategies for the Trading of Risk with Gerald Ashley
1 × $6.00 -
×
 Bollinger Band Jackpot with Mark Deaton
1 × $31.00
Bollinger Band Jackpot with Mark Deaton
1 × $31.00 -
×
 Matrix Spread Options Trading Course with Base Camp Trading
1 × $31.00
Matrix Spread Options Trading Course with Base Camp Trading
1 × $31.00 -
×
 Options University - FX Options Trading Course 2008
1 × $6.00
Options University - FX Options Trading Course 2008
1 × $6.00 -
×
 Ninja Order Flow Trader (NOFT)
1 × $39.00
Ninja Order Flow Trader (NOFT)
1 × $39.00 -
×
 The MMXM Trader’s 2nd Course: My Personal Approach
1 × $17.00
The MMXM Trader’s 2nd Course: My Personal Approach
1 × $17.00 -
×
 Options Trading Training – The Blend Dc with Charles Cottle
1 × $4.00
Options Trading Training – The Blend Dc with Charles Cottle
1 × $4.00 -
×
 Greg Capra – 5 Pristine Trading DVD’s
1 × $31.00
Greg Capra – 5 Pristine Trading DVD’s
1 × $31.00 -
×
 Bond Market Course with The Macro Compass
1 × $15.00
Bond Market Course with The Macro Compass
1 × $15.00 -
×
 Certification in Point & Figure Chart & P&F Chart Patterns
1 × $6.00
Certification in Point & Figure Chart & P&F Chart Patterns
1 × $6.00 -
×
 The Sleuth Investor with Avner Mandelman
1 × $6.00
The Sleuth Investor with Avner Mandelman
1 × $6.00 -
×
 WyseTrade Trading Masterclass Course
1 × $5.00
WyseTrade Trading Masterclass Course
1 × $5.00 -
×
 GMB Master Academy
1 × $31.00
GMB Master Academy
1 × $31.00 -
×
 Investing Courses Bundle
1 × $31.00
Investing Courses Bundle
1 × $31.00 -
×
 Advanced Elliott Wave Analysis : Complex Patterns, Intermarket Relationships, and Global Cash Flow Analysis
1 × $6.00
Advanced Elliott Wave Analysis : Complex Patterns, Intermarket Relationships, and Global Cash Flow Analysis
1 × $6.00 -
×
 Crystal Ball Pack PLUS bonus Live Trade By Pat Mitchell - Trick Trades
1 × $20.00
Crystal Ball Pack PLUS bonus Live Trade By Pat Mitchell - Trick Trades
1 × $20.00 -
×
 SQX Mentorship with Tip Toe Hippo
1 × $23.00
SQX Mentorship with Tip Toe Hippo
1 × $23.00 -
×
 The Pattern Trader with Mark Shawzin
1 × $6.00
The Pattern Trader with Mark Shawzin
1 × $6.00 -
×
 Oliver Velez & Greg Capra - Trading the Pristine Method. The Refresher Course - I & II
1 × $15.00
Oliver Velez & Greg Capra - Trading the Pristine Method. The Refresher Course - I & II
1 × $15.00 -
×
 The Volume Traders 2.0 with Sebastian - The Volume Traders
1 × $5.00
The Volume Traders 2.0 with Sebastian - The Volume Traders
1 × $5.00 -
×
 Options Trading & Ultimate MasterClass With Tyrone Abela - FX Evolution
1 × $54.00
Options Trading & Ultimate MasterClass With Tyrone Abela - FX Evolution
1 × $54.00 -
×
 The Stock Investing Course For Beginners with Matt Dodge
1 × $5.00
The Stock Investing Course For Beginners with Matt Dodge
1 × $5.00 -
×
 Breakthroughs in Commodity Technical Analysis with J.D.Hamon
1 × $6.00
Breakthroughs in Commodity Technical Analysis with J.D.Hamon
1 × $6.00 -
×
 Options Income Generating Blueprint
1 × $31.00
Options Income Generating Blueprint
1 × $31.00 -
×
 The Septiform System of the Cosmos with Alec Stuart
1 × $6.00
The Septiform System of the Cosmos with Alec Stuart
1 × $6.00 -
×
 Van Tharp Courses Collection
1 × $41.00
Van Tharp Courses Collection
1 × $41.00 -
×
 Advanced Guide to How SimplerOptions Uses ThinkorSwim (274 Minutes) with Henry Gambell
1 × $15.00
Advanced Guide to How SimplerOptions Uses ThinkorSwim (274 Minutes) with Henry Gambell
1 × $15.00 -
×
 Trading the Eclipses
1 × $6.00
Trading the Eclipses
1 × $6.00 -
×
 Offshore Keys (2023)
1 × $5.00
Offshore Keys (2023)
1 × $5.00 -
×
 Professional Development Program (BRONZE Bundle) with Deeyana Angelo
1 × $78.00
Professional Development Program (BRONZE Bundle) with Deeyana Angelo
1 × $78.00 -
×
 Intra-Day Trading Techniques CD with Greg Capra
1 × $6.00
Intra-Day Trading Techniques CD with Greg Capra
1 × $6.00 -
×
 Start Trading Stocks Using Technical Analysis with Corey Halliday
1 × $6.00
Start Trading Stocks Using Technical Analysis with Corey Halliday
1 × $6.00 -
×
 Triple Your Trading Profits Couse with David Jenyns
1 × $6.00
Triple Your Trading Profits Couse with David Jenyns
1 × $6.00 -
×
 Trading Short TermSame Day Trades Sep 2023 with Dan Sheridan & Mark Fenton - Sheridan Options Mentoring
1 × $31.00
Trading Short TermSame Day Trades Sep 2023 with Dan Sheridan & Mark Fenton - Sheridan Options Mentoring
1 × $31.00 -
×
 The Haller Theory of Stock Market Trends
1 × $6.00
The Haller Theory of Stock Market Trends
1 × $6.00 -
×
 The Truth About Day Trading Stocks with Josh DiPietro
1 × $6.00
The Truth About Day Trading Stocks with Josh DiPietro
1 × $6.00 -
×
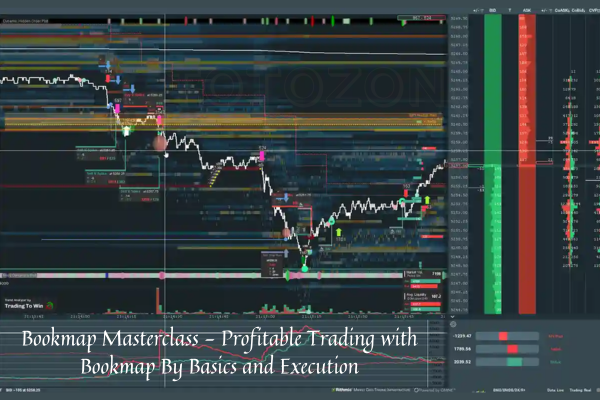 Bookmap Masterclass - Profitable Trading with Bookmap By Basics and Execution
1 × $8.00
Bookmap Masterclass - Profitable Trading with Bookmap By Basics and Execution
1 × $8.00 -
×
 Atlas Forex Trading Course
1 × $5.00
Atlas Forex Trading Course
1 × $5.00 -
×
 The Forex Scalper
1 × $5.00
The Forex Scalper
1 × $5.00 -
×
 The Indices Orderflow Masterclass with The Forex Scalpers
1 × $23.00
The Indices Orderflow Masterclass with The Forex Scalpers
1 × $23.00 -
×
 Compass Trading System with Right Line Trading
1 × $39.00
Compass Trading System with Right Line Trading
1 × $39.00 -
×
 The Super MACD Indicator Package
1 × $15.00
The Super MACD Indicator Package
1 × $15.00 -
×
 Instant Cash With Judgment Liens with Mike Warren
1 × $6.00
Instant Cash With Judgment Liens with Mike Warren
1 × $6.00 -
×
 Order flow self-study training program with iMFtracker
1 × $10.00
Order flow self-study training program with iMFtracker
1 × $10.00

Day Trading with Lines in the Sky By R.L.Muehlberg
$6.00
File Size: 19.8 MB
Delivery Time: 1–12 hours
Media Type: Online Course
You may check content of “DayTrading with Lines in the Sky By R.L.Muehlberg” below:
Introduction
Day trading is an exhilarating and potentially profitable endeavor that attracts many traders worldwide. “Day Trading with Lines in the Sky” by R.L. Muehlberg offers a unique approach to this trading style, focusing on specific technical analysis techniques that use “lines in the sky” to predict market movements. In this article, we will delve into the core concepts of Muehlberg’s strategy, exploring how these lines can help traders make informed decisions.
Understanding Lines in the Sky
What Are Lines in the Sky?
Definition
- Technical Lines: Lines in the sky refer to specific technical indicators and trend lines drawn on stock charts to predict future price movements.
- Purpose: These lines help traders identify support and resistance levels, trend directions, and potential reversal points.
Importance of Lines in Trading
Trend Identification
- Bullish Trends: Identifying upward trends to capitalize on price increases.
- Bearish Trends: Recognizing downward trends to profit from falling prices.
Support and Resistance
- Support Levels: Price levels where a stock tends to find buying interest.
- Resistance Levels: Price points where selling pressure often occurs.
Key Components of Muehlberg’s Strategy
Technical Indicators
Moving Averages
- Simple Moving Average (SMA): Average price over a specified period, used to smooth out price data.
- Exponential Moving Average (EMA): Gives more weight to recent prices, making it more responsive to new information.
Relative Strength Index (RSI)
- Overbought and Oversold Conditions: Helps identify potential reversal points when the market is overbought or oversold.
Trend Lines
Drawing Trend Lines
- Connecting Highs and Lows: Draw lines connecting consecutive highs or lows to identify the direction of the trend.
- Channel Patterns: Creating channels by drawing parallel lines to the main trend line.
Volume Analysis
Volume Spikes
- Significance: High volume can indicate strong market interest and potential trend continuations or reversals.
- Volume Patterns: Analyzing volume patterns helps confirm price movements.
Implementing the Strategy
Setting Up Your Chart
Selecting Time Frames
- Intraday Charts: Using 1-minute, 5-minute, or 15-minute charts for day trading.
- Daily and Weekly Charts: For broader market context and trend analysis.
Applying Indicators
- Moving Averages: Adding SMA and EMA to identify trend directions.
- RSI: Implementing RSI to gauge market momentum.
Identifying Trade Opportunities
Trend Confirmation
- Trend Line Breaks: Entering trades when price breaks above or below a trend line.
- Moving Average Crossovers: Trading signals generated when shorter-term moving averages cross longer-term moving averages.
Support and Resistance Trades
- Buying at Support: Entering long positions at identified support levels.
- Selling at Resistance: Initiating short positions at resistance points.
Risk Management
Stop-Loss Orders
- Placement: Setting stop-loss orders below support levels for long positions and above resistance levels for short positions.
- Adjustments: Modifying stop-loss levels as the trade progresses to lock in profits.
Position Sizing
- Capital Allocation: Determining the appropriate amount of capital to risk on each trade based on account size and risk tolerance.
- Consistency: Maintaining consistent position sizes to manage risk effectively.
Case Studies
Example 1: Successful Breakout Trade
Scenario
- Setup: Stock breaks above a key resistance level with high volume.
- Execution: Trader enters a long position, setting a stop-loss just below the breakout level.
- Outcome: Stock continues to rise, resulting in a profitable trade.
Example 2: Trend Reversal
Scenario
- Setup: Stock shows bearish divergence on RSI while forming lower highs.
- Execution: Trader initiates a short position as the price breaks below the trend line.
- Outcome: Stock declines significantly, leading to a successful trade.
Advanced Techniques
Fibonacci Retracements
Application
- Drawing Retracements: Using Fibonacci levels to identify potential support and resistance levels during pullbacks.
- Trade Decisions: Entering trades at key Fibonacci levels for optimal entry points.
Candlestick Patterns
Popular Patterns
- Doji: Indicates potential reversal points.
- Engulfing Patterns: Strong reversal signals when a small candle is followed by a larger candle in the opposite direction.
Common Mistakes to Avoid
Overtrading
Definition
- Excessive Trading: Making too many trades can lead to high transaction costs and emotional exhaustion.
Prevention
- Discipline: Sticking to a well-defined trading plan and avoiding impulsive trades.
Ignoring Volume
Importance
- Volume Confirmation: Always consider volume as a confirmation tool for price movements.
Integration
- Volume Indicators: Using volume indicators alongside price charts to validate trades.
Conclusion
Day trading with lines in the sky, as outlined by R.L. Muehlberg, offers a structured approach to navigating the stock market’s complexities. By integrating technical indicators, trend lines, and volume analysis, traders can make informed decisions and manage risks effectively. Continuous learning and practice are key to mastering this strategy and achieving consistent trading success.
Frequently Asked Questions:
- Business Model Innovation:
Embrace our legitimate business model! We organize group buys, allowing participants to share costs for popular courses, making them accessible to those with limited financial resources. Our approach ensures affordability and accessibility, despite author concerns. - The Legal Environment:
The legality of our activity is uncertain. While we lack specific permission from course authors, there’s a technicality: authors didn’t impose resale limits upon course purchase. This presents both an opportunity for us and a benefit for individuals seeking low-cost access. - Quality Control:
Unveiling the Truth
Quality is paramount. Purchasing courses directly from sales pages ensures consistency with traditionally obtained materials. However, we’re not official course providers and don’t offer premium services:
- No scheduled coaching calls or sessions with the author.
- No access to the author’s private Facebook group or web portal.
- No entry to the author’s private membership forum.
- Direct email support from the author or their team is unavailable.Operating independently, we aim to bridge the pricing gap without additional services provided by official channels. Your understanding of our unique approach is valued.
Be the first to review “Day Trading with Lines in the Sky By R.L.Muehlberg”
You must be logged in to post a review.
Related products

Original price was: $2,120.00.$15.00Current price is: $15.00.

Forex Trading
Original price was: $697.00.$5.00Current price is: $5.00.

Original price was: $695.00.$41.00Current price is: $41.00.
Forex Trading
Original price was: $125.00.$17.00Current price is: $17.00.
Original price was: $139.00.$23.00Current price is: $23.00.
Forex Trading
Original price was: $397.00.$31.00Current price is: $31.00.
Forex Trading
Original price was: $1,098.00.$39.00Current price is: $39.00.
Original price was: $895.00.$15.00Current price is: $15.00.
Original price was: $299.00.$8.00Current price is: $8.00.

Forex Trading
Original price was: $4,997.00.$27.00Current price is: $27.00.
Forex Trading
Original price was: $500.00.$5.00Current price is: $5.00.
Forex Trading
Original price was: $499.00.$15.00Current price is: $15.00.

Original price was: $1,200.00.$23.00Current price is: $23.00.

Forex Trading
Original price was: $2,000.00.$23.00Current price is: $23.00.
Original price was: $497.00.$31.00Current price is: $31.00.

Forex Trading
Original price was: $2,995.00.$31.00Current price is: $31.00.

Forex Trading
Original price was: $797.00.$10.00Current price is: $10.00.

Original price was: $997.00.$13.00Current price is: $13.00.

Original price was: $197.00.$5.00Current price is: $5.00.
Original price was: $649.00.$20.00Current price is: $20.00.
Reviews
There are no reviews yet.