-
×
 Ichimoku Cloud Triple Confirmation Indicator and Scan with AlphaShark
1 × $31.00
Ichimoku Cloud Triple Confirmation Indicator and Scan with AlphaShark
1 × $31.00 -
×
 The Game In WallStreet & How to Play it Successfully with Hoyle
1 × $6.00
The Game In WallStreet & How to Play it Successfully with Hoyle
1 × $6.00 -
×
 Dan Sheridan Options Mentoring Weekly Webinars
1 × $6.00
Dan Sheridan Options Mentoring Weekly Webinars
1 × $6.00 -
×
 Executive Mentoring Elliot Wave Course (Video & Manuals)
1 × $6.00
Executive Mentoring Elliot Wave Course (Video & Manuals)
1 × $6.00 -
×
 Hidden Cash Flow Fortunes
1 × $54.00
Hidden Cash Flow Fortunes
1 × $54.00 -
×
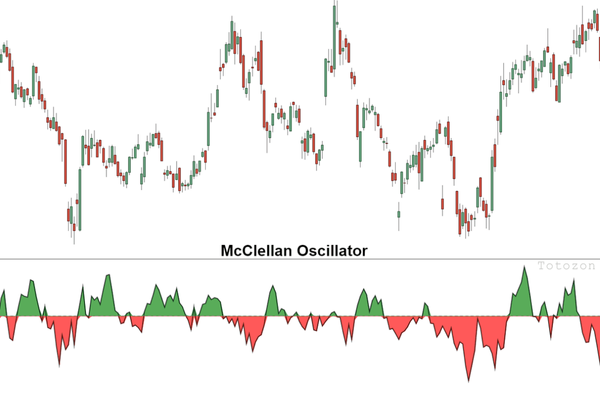 The McClellan Oscillator and Other Tools for with Tom McClellan
1 × $6.00
The McClellan Oscillator and Other Tools for with Tom McClellan
1 × $6.00 -
×
 Currency Trading for Dummies with Mark Galant
1 × $6.00
Currency Trading for Dummies with Mark Galant
1 × $6.00 -
×
 The Weekly Options Advantage with Chuck Hughes
1 × $6.00
The Weekly Options Advantage with Chuck Hughes
1 × $6.00 -
×
 Market Mindfields - 2 DVDs with Ryan Litchfield
1 × $6.00
Market Mindfields - 2 DVDs with Ryan Litchfield
1 × $6.00 -
×
 Rocking Wall Street with Gary Marks
1 × $6.00
Rocking Wall Street with Gary Marks
1 × $6.00 -
×
 Bodhi, Lighthouse, Truckin by Brian James Sklenka
1 × $6.00
Bodhi, Lighthouse, Truckin by Brian James Sklenka
1 × $6.00 -
×
 WYCKOFF TRADING COURSE (WTC) PART I – ANALYSIS (Spring 2023) - Roman Bogomazov & Alessio Rutigliano
1 × $209.00
WYCKOFF TRADING COURSE (WTC) PART I – ANALYSIS (Spring 2023) - Roman Bogomazov & Alessio Rutigliano
1 × $209.00 -
×
 If You Are So Smart Why Aren’t You Rich with Ben Branch
1 × $6.00
If You Are So Smart Why Aren’t You Rich with Ben Branch
1 × $6.00 -
×
 Ambush Trading Method (EBOOK) with MARCO MAYER - Trading Educators
1 × $256.00
Ambush Trading Method (EBOOK) with MARCO MAYER - Trading Educators
1 × $256.00 -
×
 Affinity Foundation Stocks Course with Affinitytrading
1 × $6.00
Affinity Foundation Stocks Course with Affinitytrading
1 × $6.00 -
×
 Fx Engine Trading Course with Adeh Mirzakhani
1 × $6.00
Fx Engine Trading Course with Adeh Mirzakhani
1 × $6.00 -
×
 High Probability Trading Using Elliott Wave And Fibonacci Analysis withVic Patel - Forex Training Group
1 × $10.00
High Probability Trading Using Elliott Wave And Fibonacci Analysis withVic Patel - Forex Training Group
1 × $10.00 -
×
 Cecil Robles Advent Forex Course & Indicators with Adventforex
1 × $6.00
Cecil Robles Advent Forex Course & Indicators with Adventforex
1 × $6.00 -
×
 Stacey Pigmentation Mentorship
1 × $17.00
Stacey Pigmentation Mentorship
1 × $17.00 -
×
 Advanced Trading System 2020
1 × $179.00
Advanced Trading System 2020
1 × $179.00 -
×
 A Trader's Guide to Self-Discipline: Proven Techniques to Improve Trading Profits
1 × $6.00
A Trader's Guide to Self-Discipline: Proven Techniques to Improve Trading Profits
1 × $6.00 -
×
 Wall Street Stories with Edwin Lefevre
1 × $6.00
Wall Street Stories with Edwin Lefevre
1 × $6.00 -
×
 The A to Z of Mathematics: A Basic Guide with Thomas Sidebotham
1 × $6.00
The A to Z of Mathematics: A Basic Guide with Thomas Sidebotham
1 × $6.00 -
×
 HYDRA 3 Day Bootcamp
1 × $5.00
HYDRA 3 Day Bootcamp
1 × $5.00 -
×
 Commodities for Dummies with Amine Bouchentouf
1 × $6.00
Commodities for Dummies with Amine Bouchentouf
1 × $6.00 -
×
 Investing for the Long Term with Peter Bernstein
1 × $6.00
Investing for the Long Term with Peter Bernstein
1 × $6.00 -
×
 Scalping Strategy Webinar! recorded. BEST WEBINAR
1 × $23.00
Scalping Strategy Webinar! recorded. BEST WEBINAR
1 × $23.00 -
×
 How to Trade Options 101 2021 with The Travel Trader
1 × $54.00
How to Trade Options 101 2021 with The Travel Trader
1 × $54.00 -
×
 Forex Candlestick System. High Profit Forex Trading with B.M.Davis
1 × $6.00
Forex Candlestick System. High Profit Forex Trading with B.M.Davis
1 × $6.00 -
×
 Measuring Risk in Complex Stochastic Systems with J.Franke, W. Hardle, G. Stahl
1 × $6.00
Measuring Risk in Complex Stochastic Systems with J.Franke, W. Hardle, G. Stahl
1 × $6.00 -
×
 The Raptor 10 Momentum Methodology Course
1 × $6.00
The Raptor 10 Momentum Methodology Course
1 × $6.00 -
×
 Trading Triggers - The Secrets to Profitable Trading with John Person
1 × $6.00
Trading Triggers - The Secrets to Profitable Trading with John Person
1 × $6.00 -
×
 The Day Traders Fast Track Program
1 × $23.00
The Day Traders Fast Track Program
1 × $23.00 -
×
 Secret $100k Meeting with Russell Brunson
1 × $6.00
Secret $100k Meeting with Russell Brunson
1 × $6.00 -
×
 Markets In Motion with Ned Davis
1 × $6.00
Markets In Motion with Ned Davis
1 × $6.00 -
×
 Mastering the Trade
1 × $6.00
Mastering the Trade
1 × $6.00 -
×
 W. D Gann 's Square Of 9 Applied To Modern Markets with Sean Avidar - Hexatrade350
1 × $23.00
W. D Gann 's Square Of 9 Applied To Modern Markets with Sean Avidar - Hexatrade350
1 × $23.00 -
×
 The Indices Orderflow Masterclass with The Forex Scalpers
1 × $23.00
The Indices Orderflow Masterclass with The Forex Scalpers
1 × $23.00 -
×
 Researching your Trade
1 × $6.00
Researching your Trade
1 × $6.00 -
×
 Long-Term Secrets to Short-Term Trading with Larry Williams
1 × $6.00
Long-Term Secrets to Short-Term Trading with Larry Williams
1 × $6.00 -
×
 Krautgap By John Piper
1 × $6.00
Krautgap By John Piper
1 × $6.00 -
×
 Real-Time Course with Rich Swannell
1 × $6.00
Real-Time Course with Rich Swannell
1 × $6.00 -
×
 Diary of an Internet Trader with Alpesh Patel
1 × $6.00
Diary of an Internet Trader with Alpesh Patel
1 × $6.00 -
×
 The Trading Blueprint with Brad Goh - The Trading Geek
1 × $5.00
The Trading Blueprint with Brad Goh - The Trading Geek
1 × $5.00 -
×
 How to Trade the New Single Stock Futures with Jack Bernstein
1 × $6.00
How to Trade the New Single Stock Futures with Jack Bernstein
1 × $6.00 -
×
 Complete Guide to Online Stock Market Investing (2nd Edition) with Alexander Davidson
1 × $6.00
Complete Guide to Online Stock Market Investing (2nd Edition) with Alexander Davidson
1 × $6.00 -
×
 Order flow self-study training program with iMFtracker
1 × $10.00
Order flow self-study training program with iMFtracker
1 × $10.00 -
×
 Design for Six Sigma with Subir Chowdhury
1 × $6.00
Design for Six Sigma with Subir Chowdhury
1 × $6.00 -
×
 Dhia’s Journal 2022
1 × $6.00
Dhia’s Journal 2022
1 × $6.00 -
×
 Streetsmart Guide To Valuing a Stock (2nd Ed.) with Gary Gray
1 × $6.00
Streetsmart Guide To Valuing a Stock (2nd Ed.) with Gary Gray
1 × $6.00 -
×
 Stock Trading Wizard
1 × $6.00
Stock Trading Wizard
1 × $6.00 -
×
 Discounted Cash Flow Valuation: Spot Undervalued Stocks Fast with Jari Roomer
1 × $6.00
Discounted Cash Flow Valuation: Spot Undervalued Stocks Fast with Jari Roomer
1 × $6.00 -
×
 The M21 Strategy
1 × $15.00
The M21 Strategy
1 × $15.00 -
×
 0 DTE Options Trading Workshop with Aeromir Corporation
1 × $15.00
0 DTE Options Trading Workshop with Aeromir Corporation
1 × $15.00

Day Trading with Lines in the Sky By R.L.Muehlberg
$6.00
File Size: 19.8 MB
Delivery Time: 1–12 hours
Media Type: Online Course
You may check content of “DayTrading with Lines in the Sky By R.L.Muehlberg” below:
Introduction
Day trading is an exhilarating and potentially profitable endeavor that attracts many traders worldwide. “Day Trading with Lines in the Sky” by R.L. Muehlberg offers a unique approach to this trading style, focusing on specific technical analysis techniques that use “lines in the sky” to predict market movements. In this article, we will delve into the core concepts of Muehlberg’s strategy, exploring how these lines can help traders make informed decisions.
Understanding Lines in the Sky
What Are Lines in the Sky?
Definition
- Technical Lines: Lines in the sky refer to specific technical indicators and trend lines drawn on stock charts to predict future price movements.
- Purpose: These lines help traders identify support and resistance levels, trend directions, and potential reversal points.
Importance of Lines in Trading
Trend Identification
- Bullish Trends: Identifying upward trends to capitalize on price increases.
- Bearish Trends: Recognizing downward trends to profit from falling prices.
Support and Resistance
- Support Levels: Price levels where a stock tends to find buying interest.
- Resistance Levels: Price points where selling pressure often occurs.
Key Components of Muehlberg’s Strategy
Technical Indicators
Moving Averages
- Simple Moving Average (SMA): Average price over a specified period, used to smooth out price data.
- Exponential Moving Average (EMA): Gives more weight to recent prices, making it more responsive to new information.
Relative Strength Index (RSI)
- Overbought and Oversold Conditions: Helps identify potential reversal points when the market is overbought or oversold.
Trend Lines
Drawing Trend Lines
- Connecting Highs and Lows: Draw lines connecting consecutive highs or lows to identify the direction of the trend.
- Channel Patterns: Creating channels by drawing parallel lines to the main trend line.
Volume Analysis
Volume Spikes
- Significance: High volume can indicate strong market interest and potential trend continuations or reversals.
- Volume Patterns: Analyzing volume patterns helps confirm price movements.
Implementing the Strategy
Setting Up Your Chart
Selecting Time Frames
- Intraday Charts: Using 1-minute, 5-minute, or 15-minute charts for day trading.
- Daily and Weekly Charts: For broader market context and trend analysis.
Applying Indicators
- Moving Averages: Adding SMA and EMA to identify trend directions.
- RSI: Implementing RSI to gauge market momentum.
Identifying Trade Opportunities
Trend Confirmation
- Trend Line Breaks: Entering trades when price breaks above or below a trend line.
- Moving Average Crossovers: Trading signals generated when shorter-term moving averages cross longer-term moving averages.
Support and Resistance Trades
- Buying at Support: Entering long positions at identified support levels.
- Selling at Resistance: Initiating short positions at resistance points.
Risk Management
Stop-Loss Orders
- Placement: Setting stop-loss orders below support levels for long positions and above resistance levels for short positions.
- Adjustments: Modifying stop-loss levels as the trade progresses to lock in profits.
Position Sizing
- Capital Allocation: Determining the appropriate amount of capital to risk on each trade based on account size and risk tolerance.
- Consistency: Maintaining consistent position sizes to manage risk effectively.
Case Studies
Example 1: Successful Breakout Trade
Scenario
- Setup: Stock breaks above a key resistance level with high volume.
- Execution: Trader enters a long position, setting a stop-loss just below the breakout level.
- Outcome: Stock continues to rise, resulting in a profitable trade.
Example 2: Trend Reversal
Scenario
- Setup: Stock shows bearish divergence on RSI while forming lower highs.
- Execution: Trader initiates a short position as the price breaks below the trend line.
- Outcome: Stock declines significantly, leading to a successful trade.
Advanced Techniques
Fibonacci Retracements
Application
- Drawing Retracements: Using Fibonacci levels to identify potential support and resistance levels during pullbacks.
- Trade Decisions: Entering trades at key Fibonacci levels for optimal entry points.
Candlestick Patterns
Popular Patterns
- Doji: Indicates potential reversal points.
- Engulfing Patterns: Strong reversal signals when a small candle is followed by a larger candle in the opposite direction.
Common Mistakes to Avoid
Overtrading
Definition
- Excessive Trading: Making too many trades can lead to high transaction costs and emotional exhaustion.
Prevention
- Discipline: Sticking to a well-defined trading plan and avoiding impulsive trades.
Ignoring Volume
Importance
- Volume Confirmation: Always consider volume as a confirmation tool for price movements.
Integration
- Volume Indicators: Using volume indicators alongside price charts to validate trades.
Conclusion
Day trading with lines in the sky, as outlined by R.L. Muehlberg, offers a structured approach to navigating the stock market’s complexities. By integrating technical indicators, trend lines, and volume analysis, traders can make informed decisions and manage risks effectively. Continuous learning and practice are key to mastering this strategy and achieving consistent trading success.
Frequently Asked Questions:
- Business Model Innovation:
Embrace our legitimate business model! We organize group buys, allowing participants to share costs for popular courses, making them accessible to those with limited financial resources. Our approach ensures affordability and accessibility, despite author concerns. - The Legal Environment:
The legality of our activity is uncertain. While we lack specific permission from course authors, there’s a technicality: authors didn’t impose resale limits upon course purchase. This presents both an opportunity for us and a benefit for individuals seeking low-cost access. - Quality Control:
Unveiling the Truth
Quality is paramount. Purchasing courses directly from sales pages ensures consistency with traditionally obtained materials. However, we’re not official course providers and don’t offer premium services:
- No scheduled coaching calls or sessions with the author.
- No access to the author’s private Facebook group or web portal.
- No entry to the author’s private membership forum.
- Direct email support from the author or their team is unavailable.Operating independently, we aim to bridge the pricing gap without additional services provided by official channels. Your understanding of our unique approach is valued.
Be the first to review “Day Trading with Lines in the Sky By R.L.Muehlberg”
You must be logged in to post a review.
Related products

Forex Trading
The Complete Guide to Multiple Time Frame Analysis & Reading Price Action with Aiman Almansoori
Original price was: $1,399.00.$13.00Current price is: $13.00.

Forex Trading
Original price was: $239.00.$8.00Current price is: $8.00.

Original price was: $299.00.$8.00Current price is: $8.00.

Forex Trading
Original price was: $499.00.$15.00Current price is: $15.00.
Original price was: $450.00.$23.00Current price is: $23.00.

Original price was: $497.00.$11.00Current price is: $11.00.

Original price was: $310.00.$23.00Current price is: $23.00.

Original price was: $1,849.00.$15.00Current price is: $15.00.

Forex Trading
Original price was: $1,098.00.$39.00Current price is: $39.00.

Original price was: $700.00.$39.00Current price is: $39.00.

Original price was: $1,800.00.$54.00Current price is: $54.00.

Original price was: $4,995.00.$15.00Current price is: $15.00.

Forex Trading
Original price was: $2,997.00.$23.00Current price is: $23.00.

Forex Trading
Original price was: $799.00.$15.00Current price is: $15.00.

Original price was: $997.00.$8.00Current price is: $8.00.

Forex Trading
Original price was: $397.00.$31.00Current price is: $31.00.

Original price was: $497.00.$31.00Current price is: $31.00.
Forex Trading
Original price was: $797.00.$10.00Current price is: $10.00.

Original price was: $695.00.$41.00Current price is: $41.00.

Forex Trading
Original price was: $500.00.$5.00Current price is: $5.00.
Reviews
There are no reviews yet.